| Param | Original file | Final file |
|---|---|---|
| Filename | modeM0/AS1G05_127T01_9000000436_03185cztM0_level2.evt | modeM0/AS1G05_127T01_9000000436_03185cztM0_level2_quad_clean.evt |
| Size (bytes) | 687,481,920 | 69,485,760 |
| Size | 655.6 MB | 66.3 MB |
| Events in quadrant A | 2,809,165 | 482,027 |
| Events in quadrant B | 3,011,718 | 488,093 |
| Events in quadrant C | 11,778,085 | 256,843 |
| Events in quadrant D | 2,814,342 | 456,812 |
| Mode M9 | |||
|---|---|---|---|
| Quadrant | BADHDUFLAG | Total packets | Discarded packets |
| A | 0 | 13 | 0 |
| B | 0 | 13 | 0 |
| C | 0 | 13 | 0 |
| D | 0 | 13 | 0 |
| Mode SS | |||
|---|---|---|---|
| Quadrant | BADHDUFLAG | Total packets | Discarded packets |
| A | 0 | 122 | 0 |
| B | 0 | 122 | 0 |
| C | 0 | 122 | 0 |
| D | 0 | 122 | 0 |
| Mode M0 | |||
|---|---|---|---|
| Quadrant | BADHDUFLAG | Total packets | Discarded packets |
| A | 0 | 12365 | 2 |
| B | 0 | 12826 | 1 |
| C | 0 | 39111 | 1 |
| D | 0 | 12725 | 1 |
| Quadrant | Total seconds | Saturated seconds | Saturation percentage |
|---|---|---|---|
| A | 6000 | 45 | 0.750000% |
| B | 6000 | 76 | 1.266667% |
| C | 6000 | 4169 | 69.483333% |
| D | 6000 | 34 | 0.566667% |
Noise dominated data is calculated using 1-second bins in cleaned event files. If a bin has >2000 counts, and if more than 50% of those come from <1% of pixels, then it is considered to be noise-dominated and hence unusable.
| Quadrant | # 1 sec bins | Bins with >0 counts | Bins with >2000 counts | High rate bins dominated by noise | Noise dominated (total time) | Noise dominated (detector-on time) | Marked lightcurve |
|---|---|---|---|---|---|---|---|
| A | 7250 | 6001 | 0 | 0 | 0.00% | 0.00% | 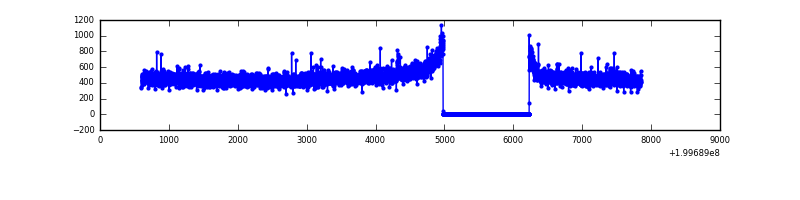 |
| B | 7250 | 6001 | 14 | 14 | 0.19% | 0.23% | 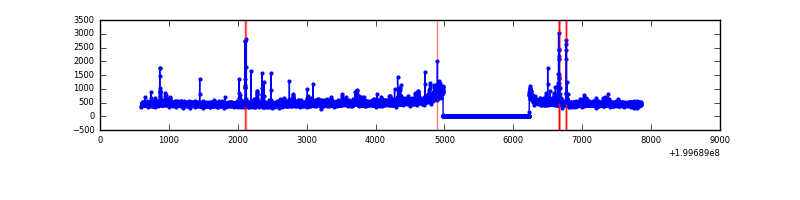 |
| C | 7250 | 6000 | 3490 | 3490 | 48.14% | 58.17% | 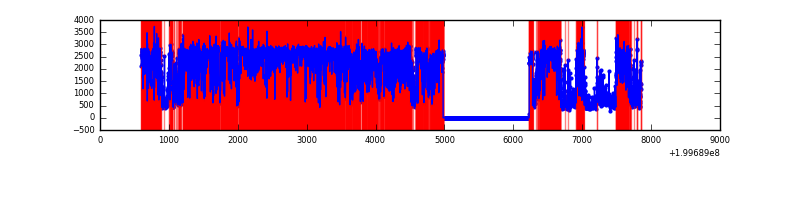 |
| D | 7250 | 6001 | 7 | 7 | 0.10% | 0.12% | 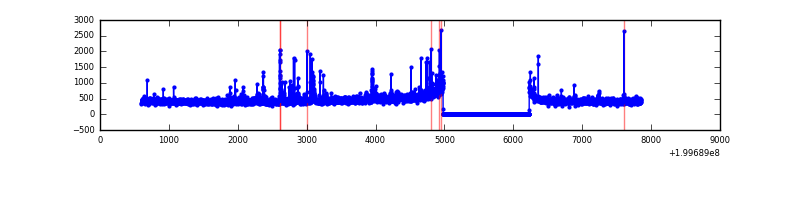 |
Top three noisy pixels from each quadrant. If the there are fewer than three noisy pixels in the level2.evt file, extra rows are filled as -1
| Pixel properties | Quadrant properties | ||||||
|---|---|---|---|---|---|---|---|
| Quadrant | DetID | PixID | Counts | Sigma | Mean | Median | Sigma |
| A | 3 | 1 | 8284 | 51.12 | 726 | 714 | 148.1 |
| A | 12 | 194 | 7639 | 46.77 | 726 | 714 | 148.1 |
| A | 0 | 226 | 7609 | 46.57 | 726 | 714 | 148.1 |
| B | 2 | 249 | 51739 | 365.42 | 732 | 717 | 139.6 |
| B | 4 | 81 | 47854 | 337.6 | 732 | 717 | 139.6 |
| B | 4 | 80 | 36812 | 258.51 | 732 | 717 | 139.6 |
| C | 12 | 206 | 10329698 | 128878.85 | 343 | 347 | 80.1 |
| C | 6 | 80 | 71736 | 890.72 | 343 | 347 | 80.1 |
| C | 1 | 192 | 12410 | 150.51 | 343 | 347 | 80.1 |
| D | 13 | 120 | 50960 | 298.86 | 692 | 672 | 168.3 |
| D | 5 | 233 | 49960 | 292.92 | 692 | 672 | 168.3 |
| D | 13 | 223 | 39029 | 227.96 | 692 | 672 | 168.3 |
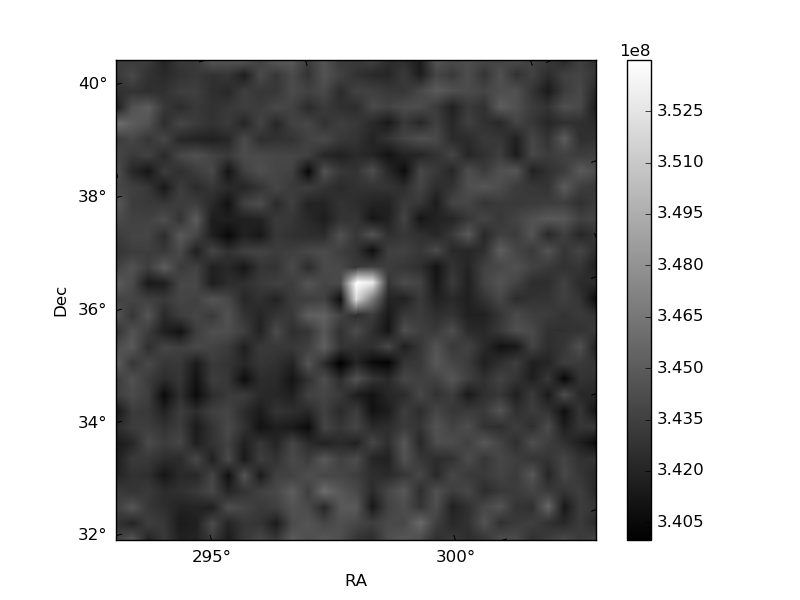
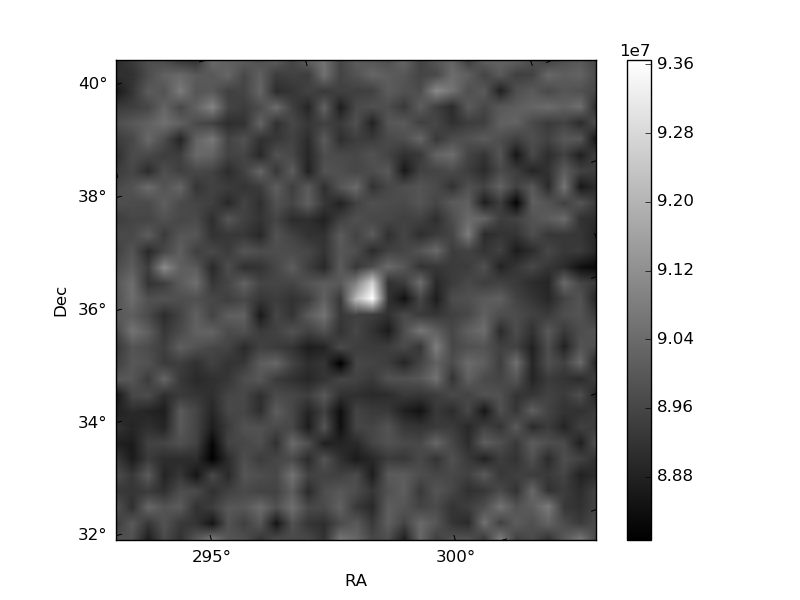
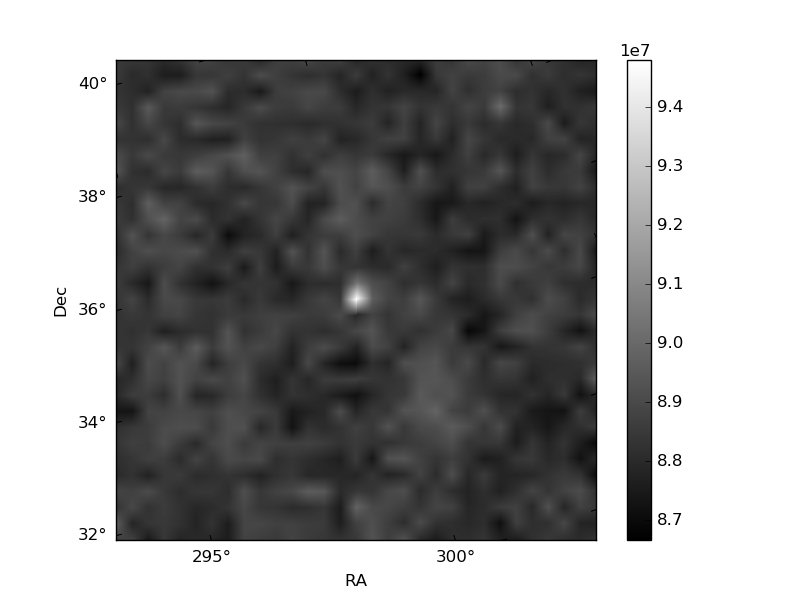
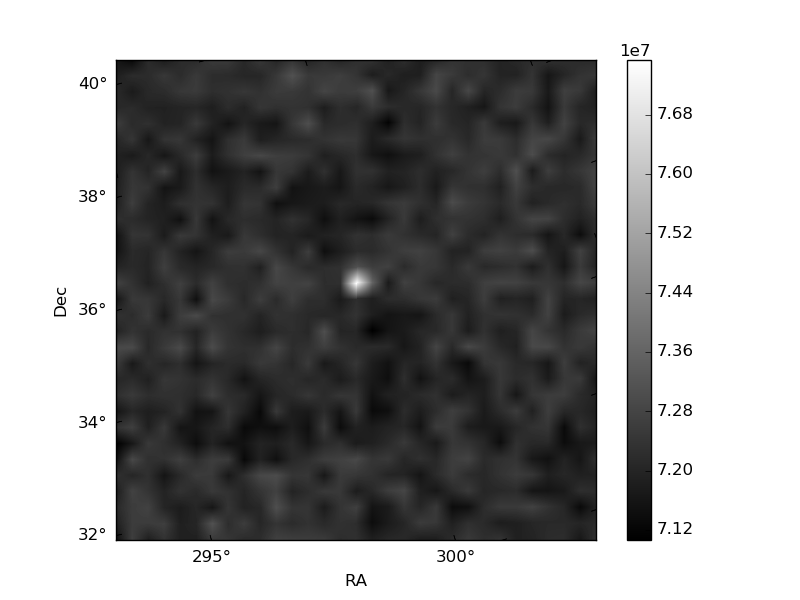
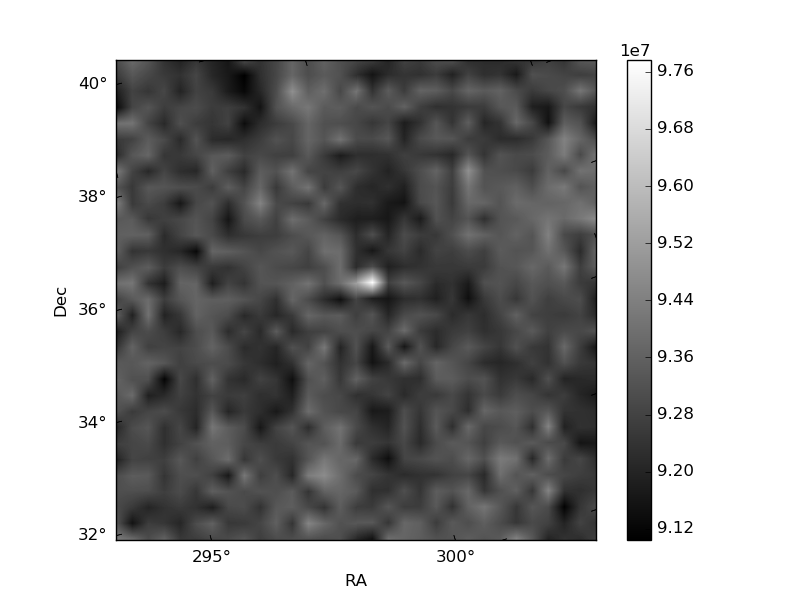
Histogram calculated using DETX and DETY for each event in the final _common_clean file
| Quadrant A | 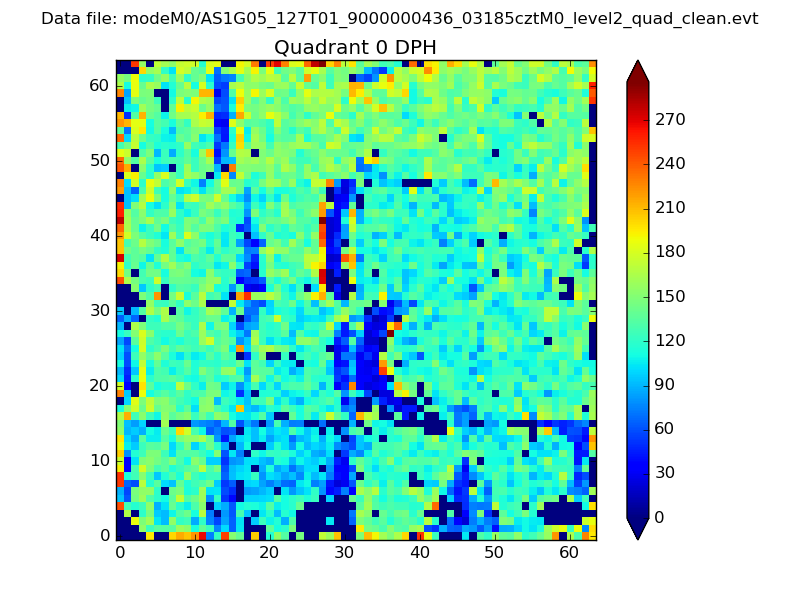 |
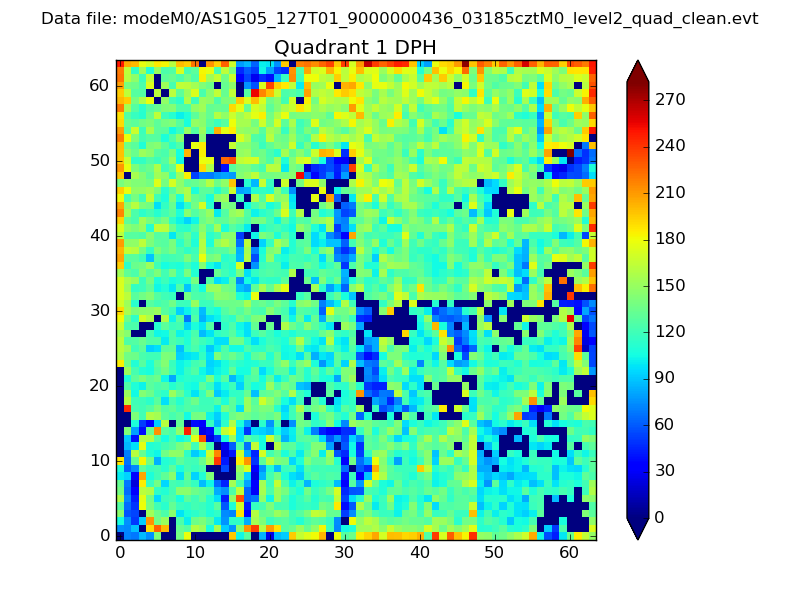 |
Quadrant B |
|---|---|---|---|
| Quadrant D | 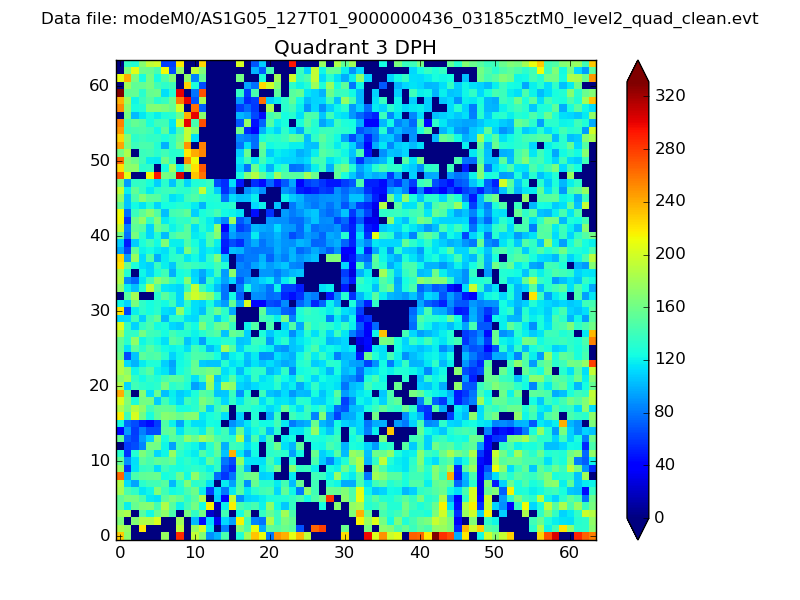 |
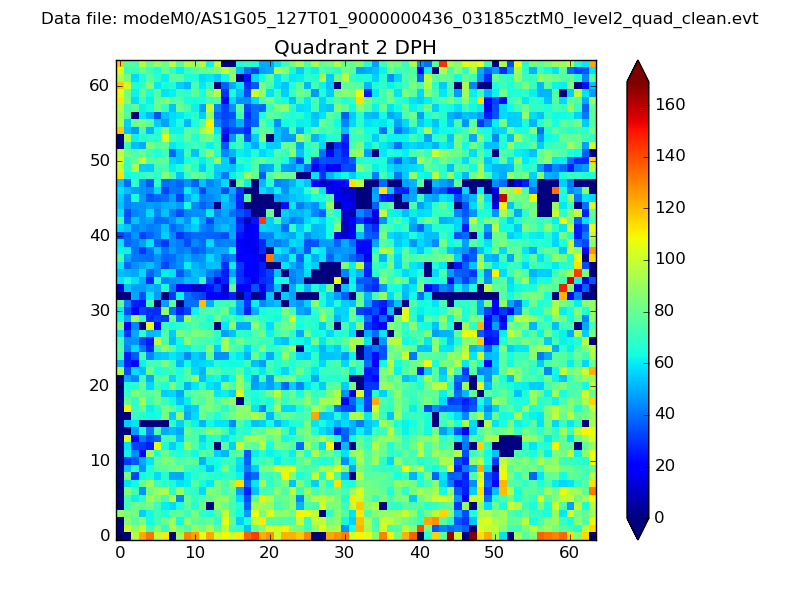 |
Quadrant C |
| Plot type | Count rate plots | Images |
|---|---|---|
| Comparison with Poisson distribution Blue bars denote a histogram of data divided into 1 sec bins. Red curve is a Poisson curve with rate = median count rate of data. |
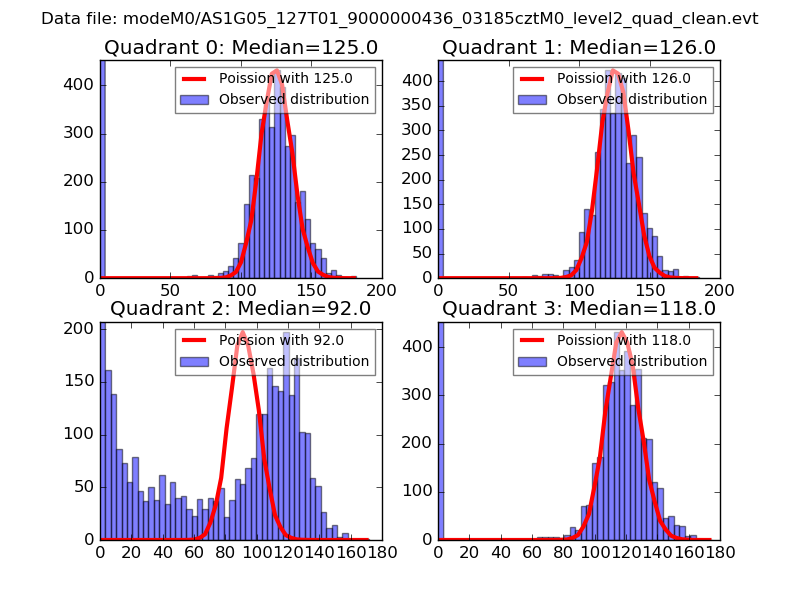 |
 |
| Quadrant-wise count rates Data is divided into 100 sec bins |
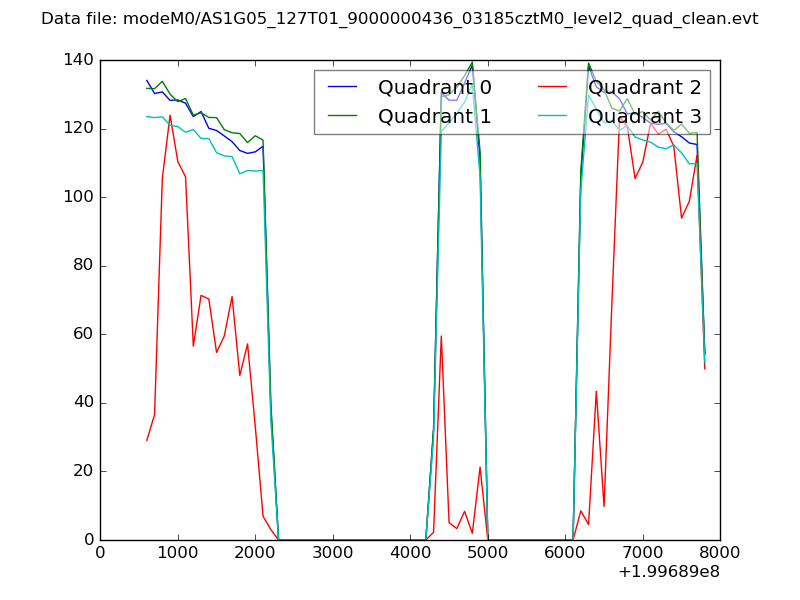 |
|
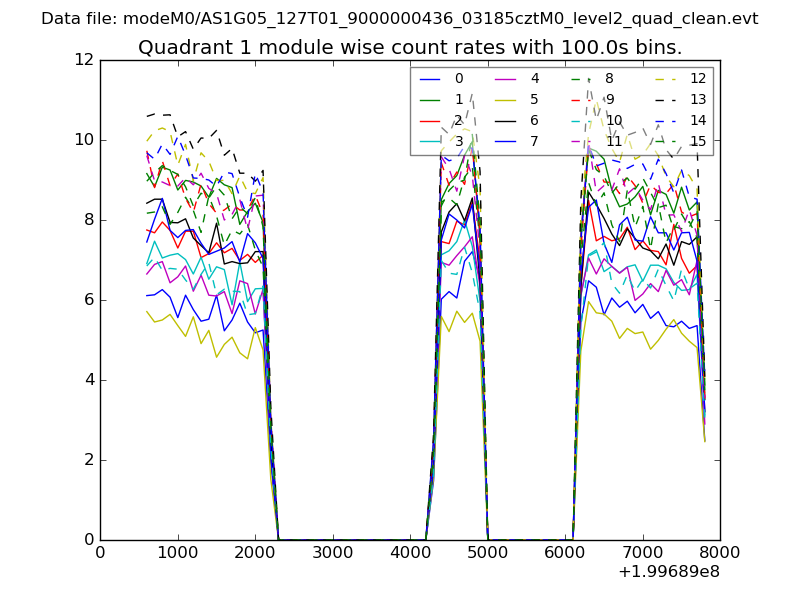
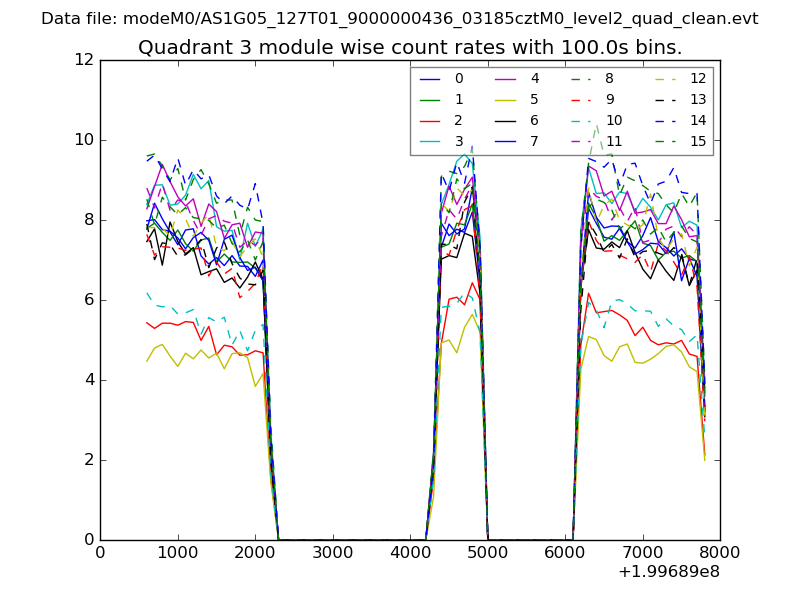
| Module-wise count rates for Quadrant A Data is divided into 100 sec bins |
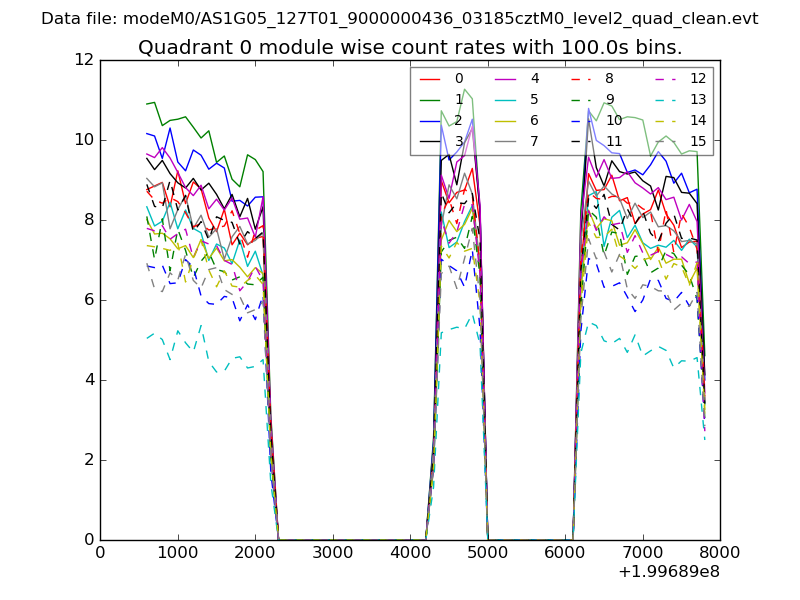 |
 |
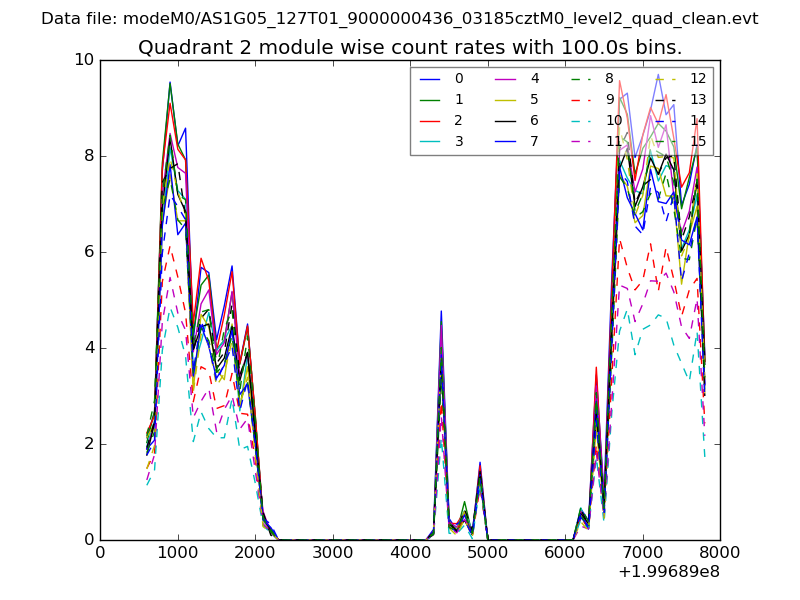
| Module-wise count rates for Quadrant B Data is divided into 100 sec bins |
 |
 |
| Module-wise count rates for Quadrant C Data is divided into 100 sec bins |
 |
 |
| Module-wise count rates for Quadrant D Data is divided into 100 sec bins |
 |
 |
| Parameter | Plot |
|---|---|
| CZT HV Monitor |  |
| D_VDD | 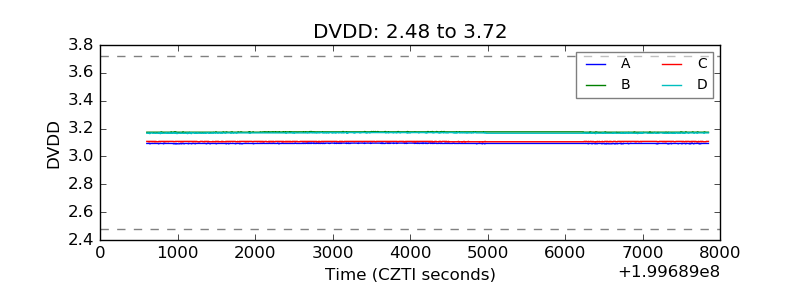 |
| Temperature 1 | 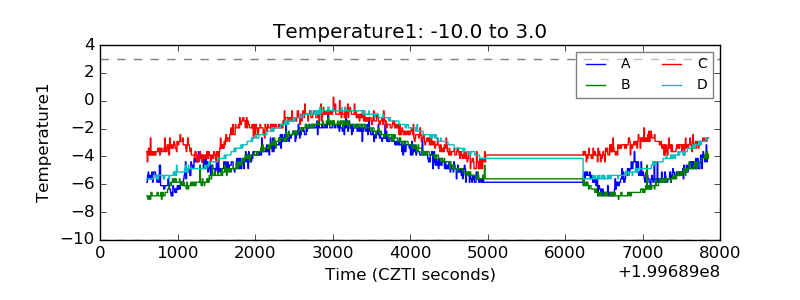 |
| Veto HV Monitor | 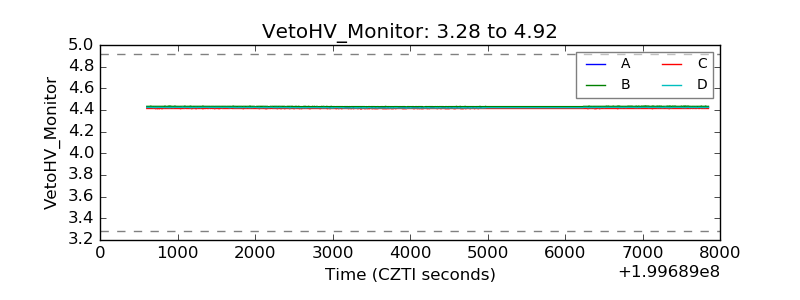 |
| Veto LLD | 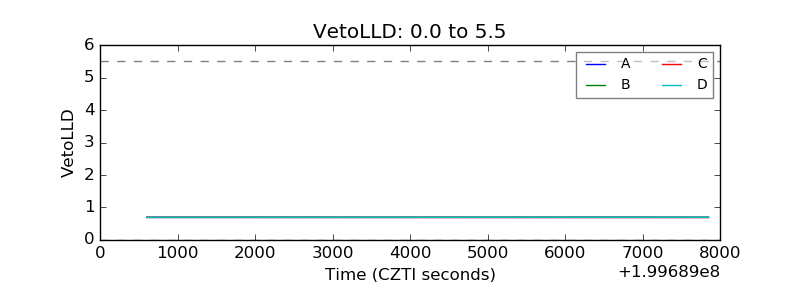 |
| Alpha Counter | 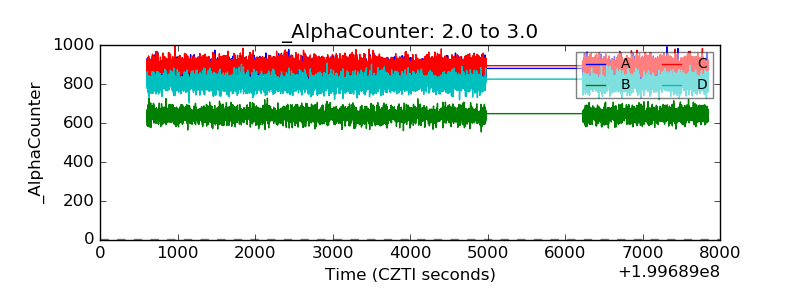 |
| _CPM_Rate | 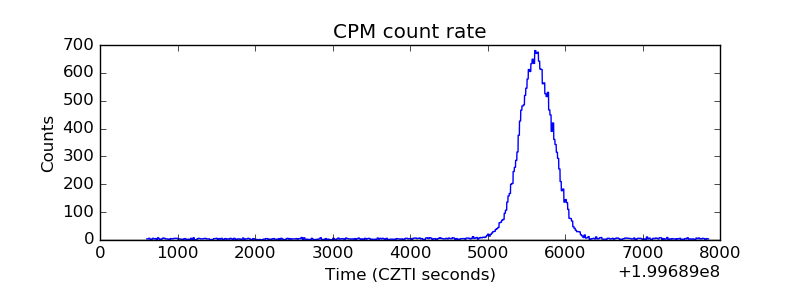 |
| CZT Counter | 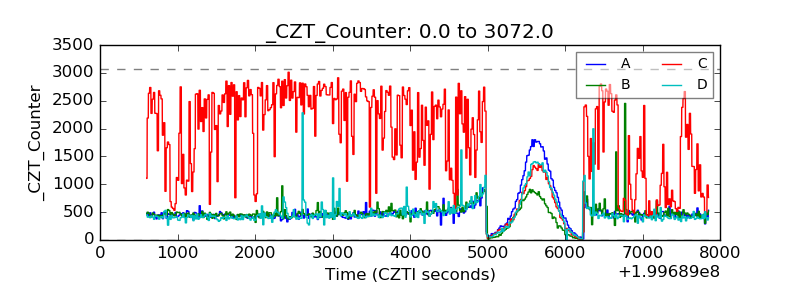 |
| +2.5 Volts monitor | 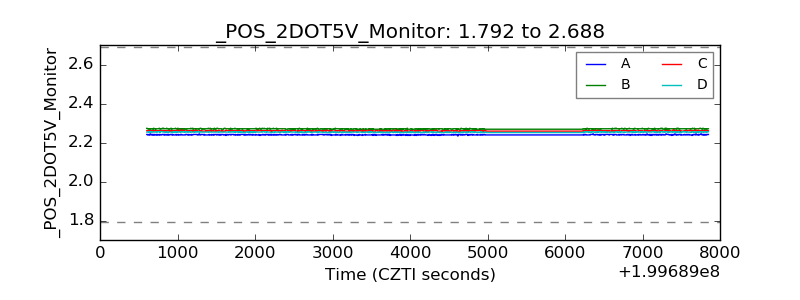 |
| +5 Volts monitor |  |
| Veto Counter | 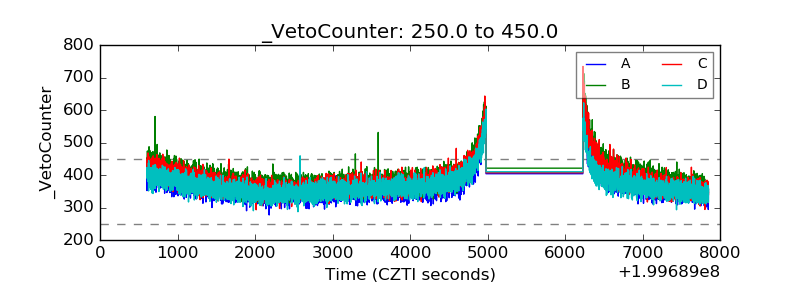 |