| Param | Original file | Final file |
|---|---|---|
| Filename | modeM0/AS1G05_127T01_9000000436_03186cztM0_level2.evt | modeM0/AS1G05_127T01_9000000436_03186cztM0_level2_quad_clean.evt |
| Size (bytes) | 426,070,080 | 72,020,160 |
| Size | 406.3 MB | 68.7 MB |
| Events in quadrant A | 2,715,910 | 448,853 |
| Events in quadrant B | 2,966,455 | 452,994 |
| Events in quadrant C | 4,102,896 | 440,235 |
| Events in quadrant D | 2,720,010 | 429,156 |
| Mode M9 | |||
|---|---|---|---|
| Quadrant | BADHDUFLAG | Total packets | Discarded packets |
| A | 0 | 11 | 0 |
| B | 0 | 11 | 0 |
| C | 0 | 11 | 0 |
| D | 0 | 11 | 0 |
| Mode SS | |||
|---|---|---|---|
| Quadrant | BADHDUFLAG | Total packets | Discarded packets |
| A | 0 | 120 | 0 |
| B | 0 | 120 | 0 |
| C | 0 | 120 | 0 |
| D | 0 | 120 | 0 |
| Mode M0 | |||
|---|---|---|---|
| Quadrant | BADHDUFLAG | Total packets | Discarded packets |
| A | 0 | 11999 | 2 |
| B | 0 | 12618 | 1 |
| C | 0 | 16101 | 1 |
| D | 0 | 12245 | 1 |
| Quadrant | Total seconds | Saturated seconds | Saturation percentage |
|---|---|---|---|
| A | 5855 | 43 | 0.734415% |
| B | 5855 | 49 | 0.836892% |
| C | 5855 | 309 | 5.277541% |
| D | 5855 | 20 | 0.341588% |
Noise dominated data is calculated using 1-second bins in cleaned event files. If a bin has >2000 counts, and if more than 50% of those come from <1% of pixels, then it is considered to be noise-dominated and hence unusable.
| Quadrant | # 1 sec bins | Bins with >0 counts | Bins with >2000 counts | High rate bins dominated by noise | Noise dominated (total time) | Noise dominated (detector-on time) | Marked lightcurve |
|---|---|---|---|---|---|---|---|
| A | 6940 | 5855 | 0 | 0 | 0.00% | 0.00% | 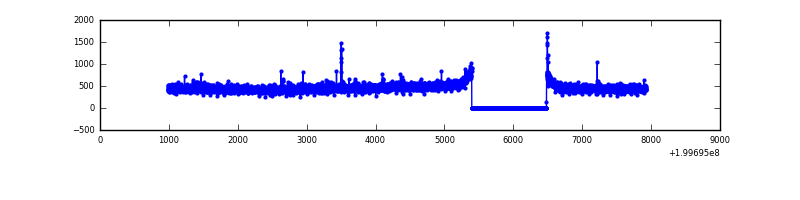 |
| B | 6940 | 5856 | 11 | 11 | 0.16% | 0.19% | 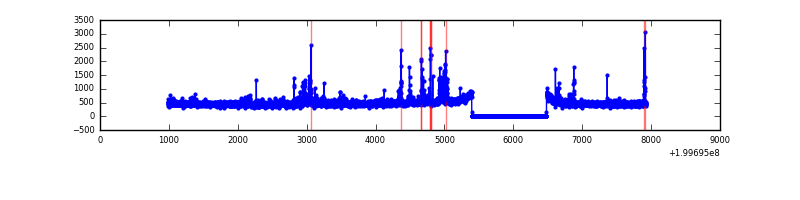 |
| C | 6940 | 5856 | 300 | 300 | 4.32% | 5.12% |  |
| D | 6940 | 5856 | 7 | 7 | 0.10% | 0.12% | 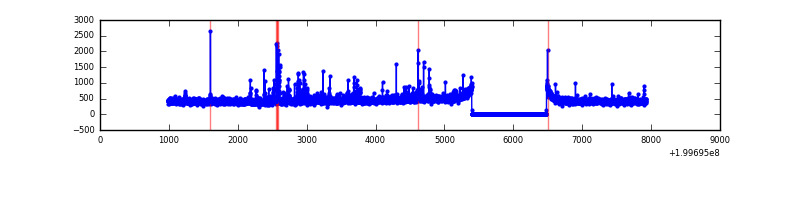 |
Top three noisy pixels from each quadrant. If the there are fewer than three noisy pixels in the level2.evt file, extra rows are filled as -1
| Pixel properties | Quadrant properties | ||||||
|---|---|---|---|---|---|---|---|
| Quadrant | DetID | PixID | Counts | Sigma | Mean | Median | Sigma |
| A | 0 | 226 | 7973 | 51.2 | 698 | 687 | 142.3 |
| A | 0 | 149 | 7801 | 50.0 | 698 | 687 | 142.3 |
| A | 12 | 194 | 7471 | 47.68 | 698 | 687 | 142.3 |
| B | 4 | 80 | 144450 | 1062.86 | 706 | 691 | 135.3 |
| B | 4 | 81 | 17237 | 122.33 | 706 | 691 | 135.3 |
| B | 15 | 85 | 17145 | 121.65 | 706 | 691 | 135.3 |
| C | 12 | 206 | 1337664 | 8666.66 | 658 | 663 | 154.3 |
| C | 6 | 80 | 104275 | 671.63 | 658 | 663 | 154.3 |
| C | 1 | 16 | 50975 | 326.13 | 658 | 663 | 154.3 |
| D | 13 | 120 | 57012 | 348.72 | 670 | 652 | 161.6 |
| D | 5 | 233 | 56425 | 345.09 | 670 | 652 | 161.6 |
| D | 13 | 223 | 32357 | 196.17 | 670 | 652 | 161.6 |
Histogram calculated using DETX and DETY for each event in the final _common_clean file
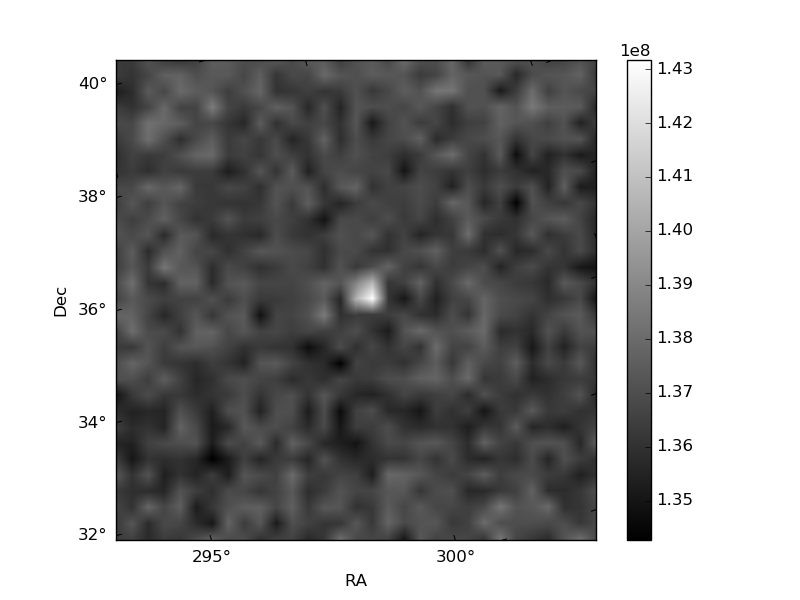
| Quadrant A | 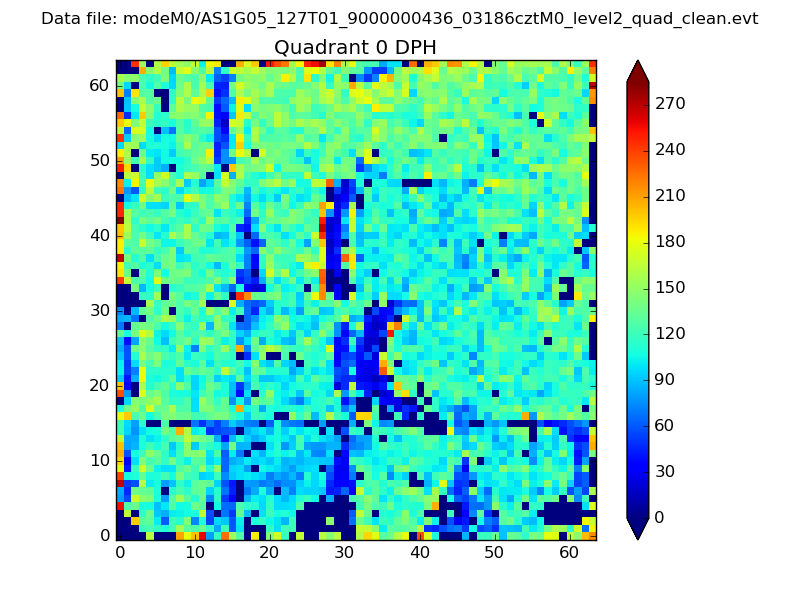 |
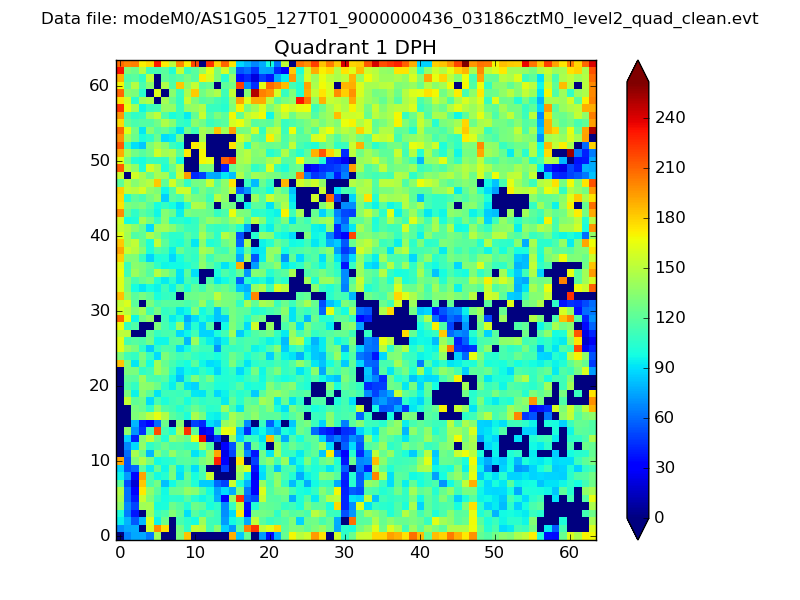 |
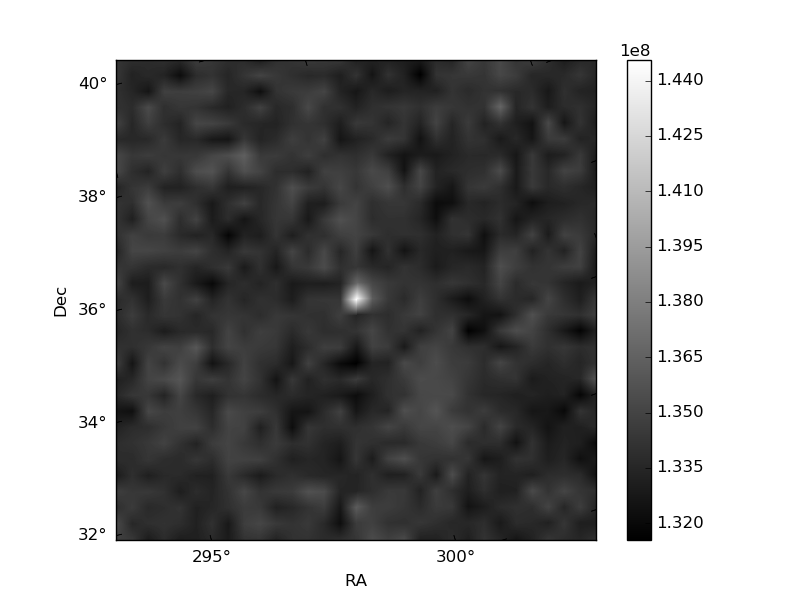
Quadrant B |
|---|---|---|---|
| Quadrant D |  |
 |
Quadrant C |
| Plot type | Count rate plots | Images |
|---|---|---|
| Comparison with Poisson distribution Blue bars denote a histogram of data divided into 1 sec bins. Red curve is a Poisson curve with rate = median count rate of data. |
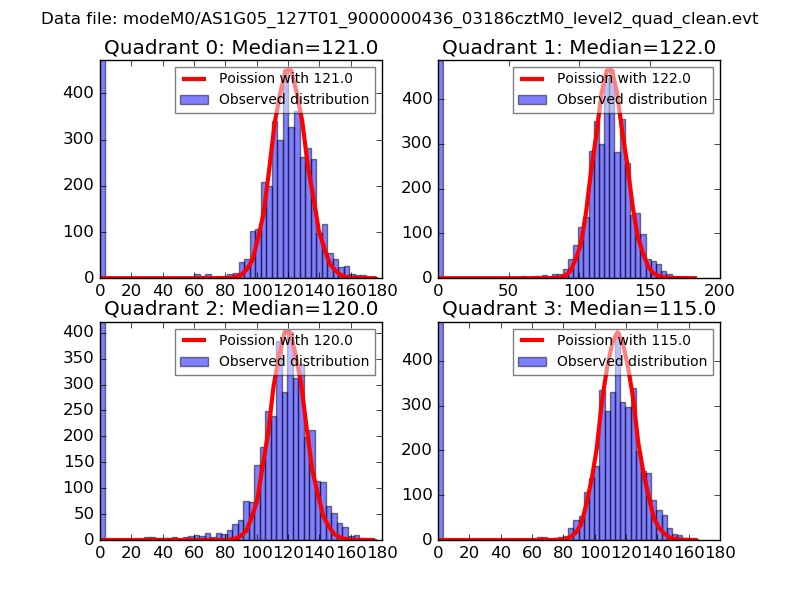 |
 |
| Quadrant-wise count rates Data is divided into 100 sec bins |
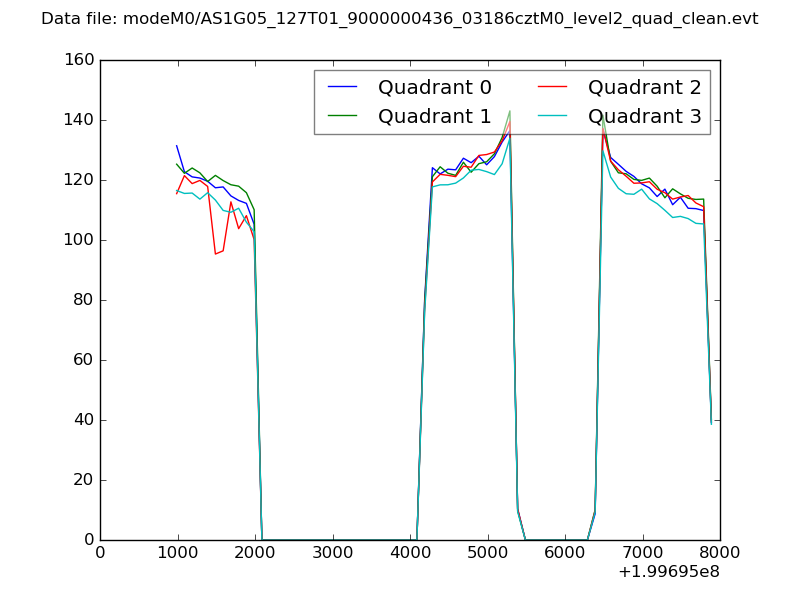 |
|
| Module-wise count rates for Quadrant A Data is divided into 100 sec bins |
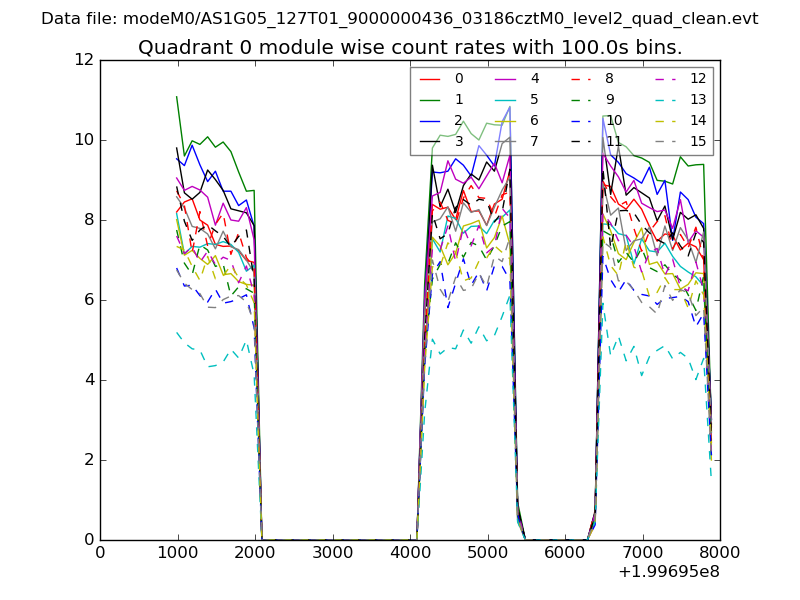 |
 |
| Module-wise count rates for Quadrant B Data is divided into 100 sec bins |
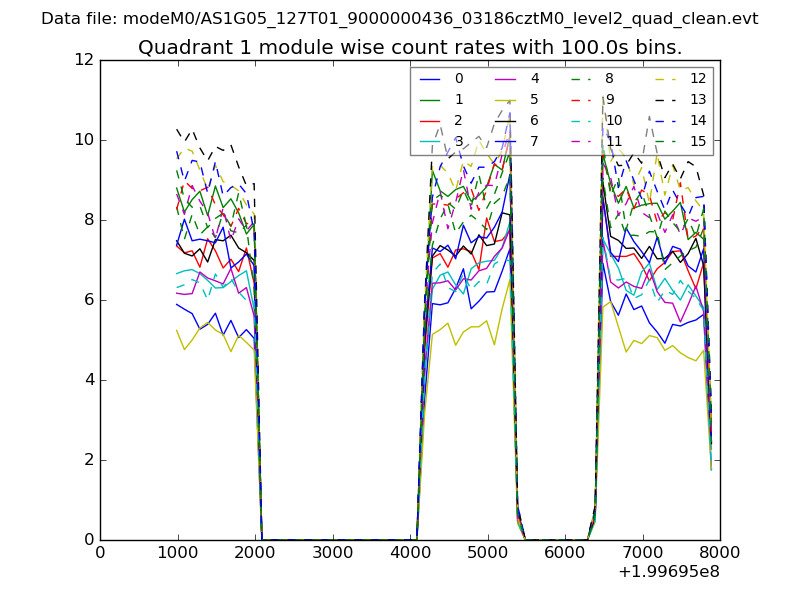 |
 |
| Module-wise count rates for Quadrant C Data is divided into 100 sec bins |
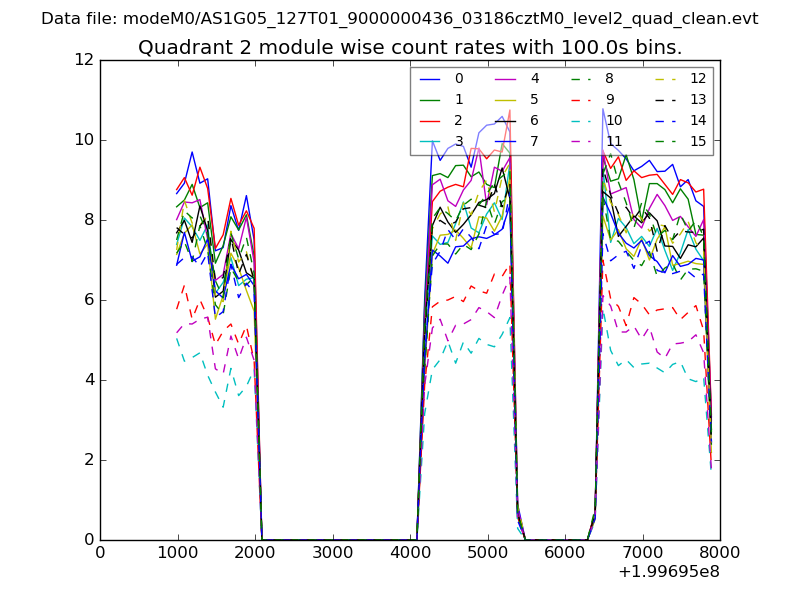 |
 |
| Module-wise count rates for Quadrant D Data is divided into 100 sec bins |
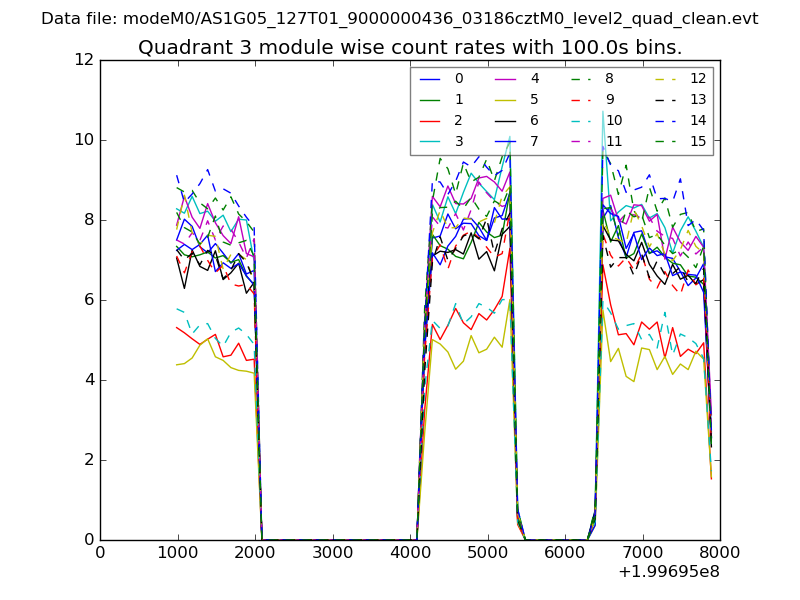 |
 |
| Parameter | Plot |
|---|---|
| CZT HV Monitor | 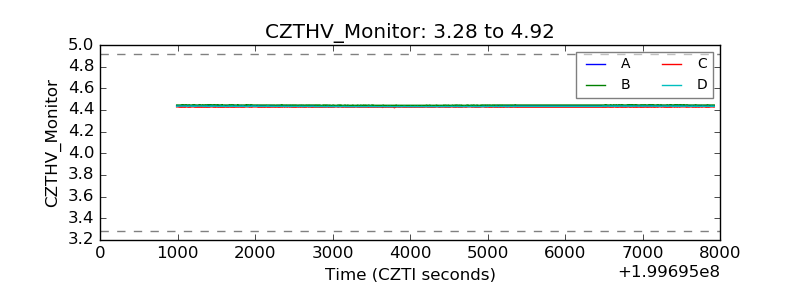 |
| D_VDD | 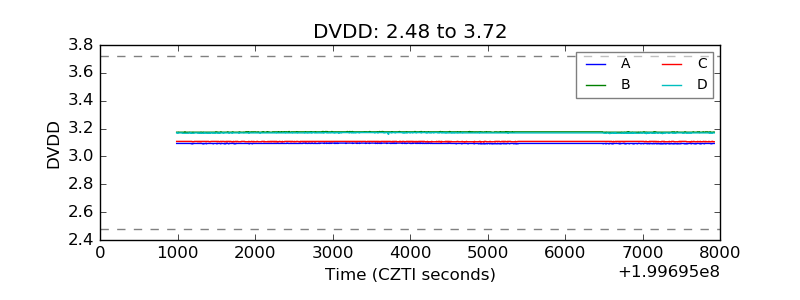 |
| Temperature 1 | 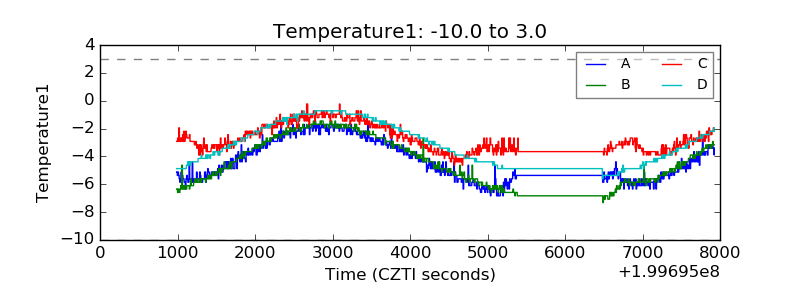 |
| Veto HV Monitor | 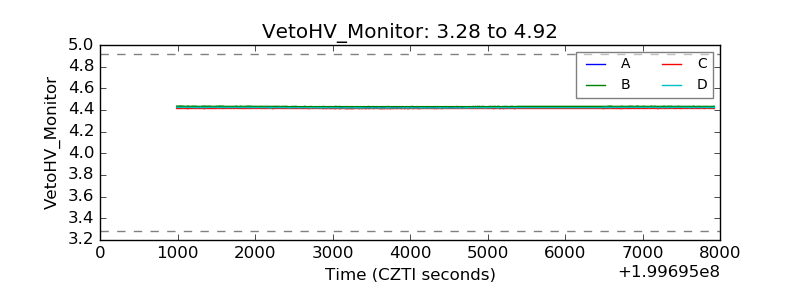 |
| Veto LLD | 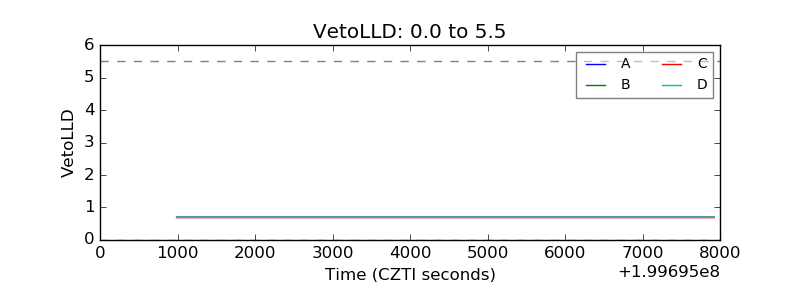 |
| Alpha Counter | 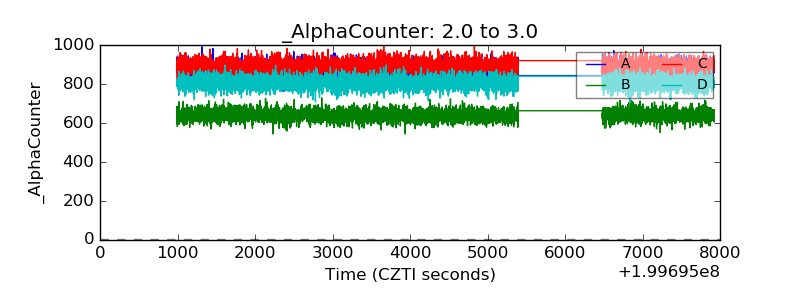 |
| _CPM_Rate | 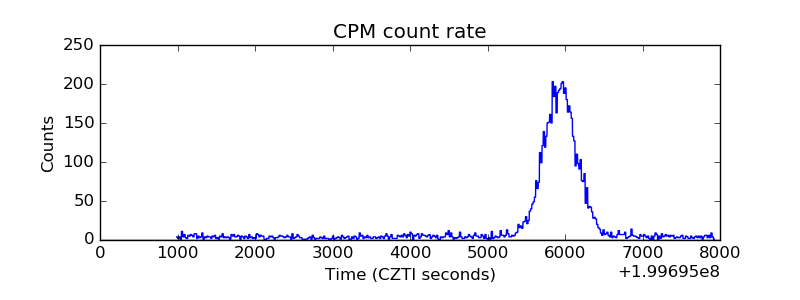 |
| CZT Counter |  |
| +2.5 Volts monitor |  |
| +5 Volts monitor |  |
| _ROLL_ROT | 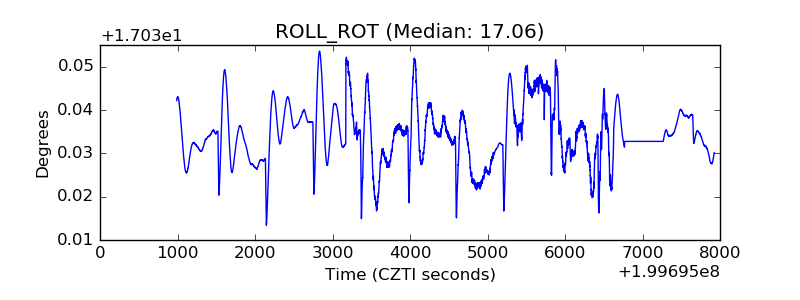 |
| _Roll_DEC | 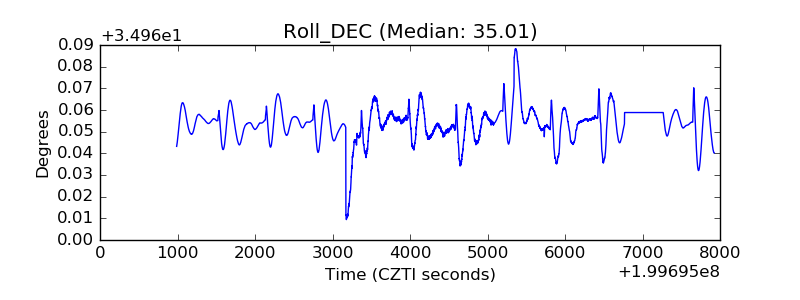 |
| _Roll_RA | 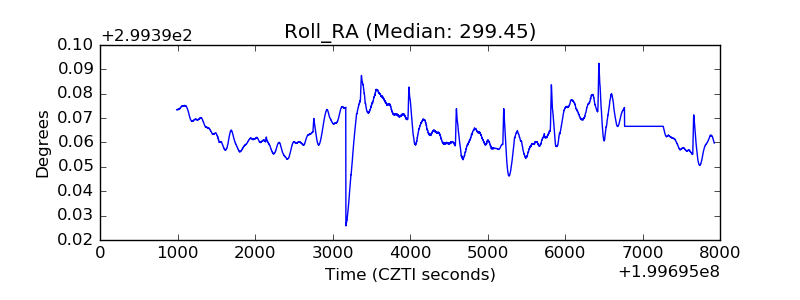 |
| Veto Counter | 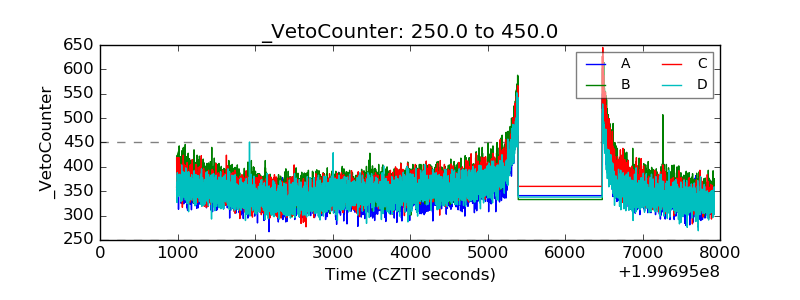 |