| Param | Original file | Final file |
|---|---|---|
| Filename | modeM0/AS1G05_127T01_9000000436_03187cztM0_level2.evt | modeM0/AS1G05_127T01_9000000436_03187cztM0_level2_quad_clean.evt |
| Size (bytes) | 459,486,720 | 71,300,160 |
| Size | 438.2 MB | 68.0 MB |
| Events in quadrant A | 2,870,703 | 439,056 |
| Events in quadrant B | 3,371,250 | 439,000 |
| Events in quadrant C | 4,329,147 | 422,937 |
| Events in quadrant D | 2,918,647 | 420,335 |
| Mode M9 | |||
|---|---|---|---|
| Quadrant | BADHDUFLAG | Total packets | Discarded packets |
| A | 0 | 6 | 0 |
| B | 0 | 6 | 0 |
| C | 0 | 6 | 0 |
| D | 0 | 6 | 0 |
| Mode SS | |||
|---|---|---|---|
| Quadrant | BADHDUFLAG | Total packets | Discarded packets |
| A | 0 | 128 | 0 |
| B | 0 | 128 | 0 |
| C | 0 | 128 | 0 |
| D | 0 | 128 | 0 |
| Mode M0 | |||
|---|---|---|---|
| Quadrant | BADHDUFLAG | Total packets | Discarded packets |
| A | 0 | 12865 | 2 |
| B | 0 | 14119 | 1 |
| C | 0 | 17215 | 1 |
| D | 0 | 13238 | 1 |
| Quadrant | Total seconds | Saturated seconds | Saturation percentage |
|---|---|---|---|
| A | 6260 | 174 | 2.779553% |
| B | 6260 | 197 | 3.146965% |
| C | 6260 | 445 | 7.108626% |
| D | 6260 | 147 | 2.348243% |
Noise dominated data is calculated using 1-second bins in cleaned event files. If a bin has >2000 counts, and if more than 50% of those come from <1% of pixels, then it is considered to be noise-dominated and hence unusable.
| Quadrant | # 1 sec bins | Bins with >0 counts | Bins with >2000 counts | High rate bins dominated by noise | Noise dominated (total time) | Noise dominated (detector-on time) | Marked lightcurve |
|---|---|---|---|---|---|---|---|
| A | 6875 | 6260 | 0 | 0 | 0.00% | 0.00% |  |
| B | 6875 | 6260 | 15 | 15 | 0.22% | 0.24% |  |
| C | 6875 | 6260 | 248 | 248 | 3.61% | 3.96% | 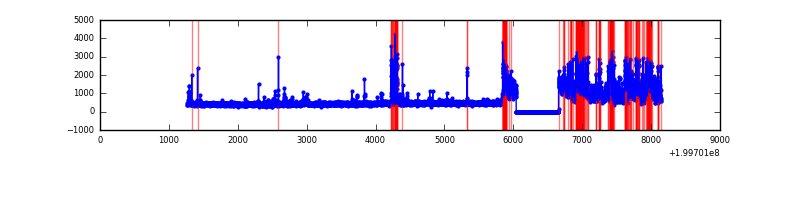 |
| D | 6875 | 6260 | 11 | 11 | 0.16% | 0.18% |  |
Top three noisy pixels from each quadrant. If the there are fewer than three noisy pixels in the level2.evt file, extra rows are filled as -1
| Pixel properties | Quadrant properties | ||||||
|---|---|---|---|---|---|---|---|
| Quadrant | DetID | PixID | Counts | Sigma | Mean | Median | Sigma |
| A | 5 | 113 | 8906 | 53.82 | 740 | 724 | 152.0 |
| A | 0 | 226 | 8215 | 49.27 | 740 | 724 | 152.0 |
| A | 12 | 194 | 8019 | 47.98 | 740 | 724 | 152.0 |
| B | 3 | 0 | 254140 | 1730.37 | 749 | 733 | 146.4 |
| B | 4 | 80 | 78569 | 531.5 | 749 | 733 | 146.4 |
| B | 2 | 249 | 49683 | 334.25 | 749 | 733 | 146.4 |
| C | 12 | 206 | 1356305 | 8402.76 | 696 | 700 | 161.3 |
| C | 1 | 192 | 143771 | 886.83 | 696 | 700 | 161.3 |
| C | 1 | 16 | 44653 | 272.44 | 696 | 700 | 161.3 |
| D | 13 | 223 | 67575 | 380.2 | 716 | 692 | 175.9 |
| D | 13 | 120 | 58652 | 329.48 | 716 | 692 | 175.9 |
| D | 5 | 233 | 45322 | 253.7 | 716 | 692 | 175.9 |
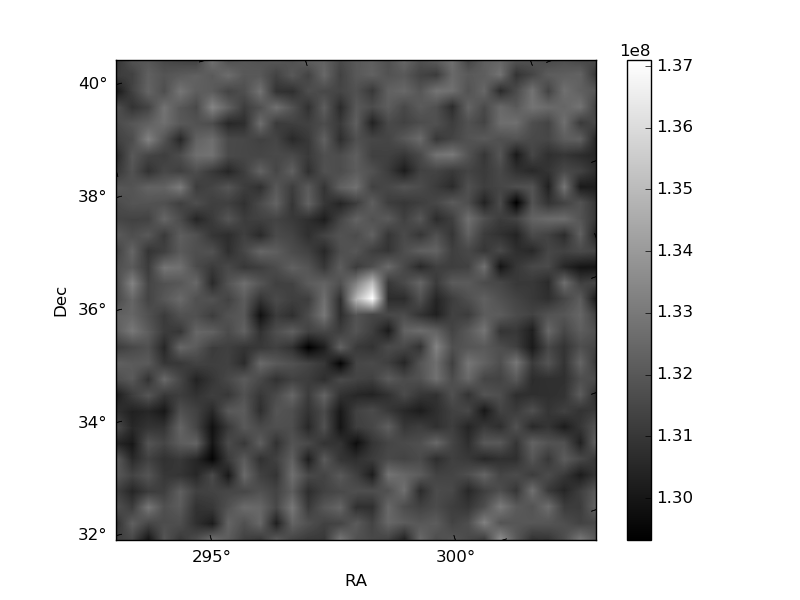
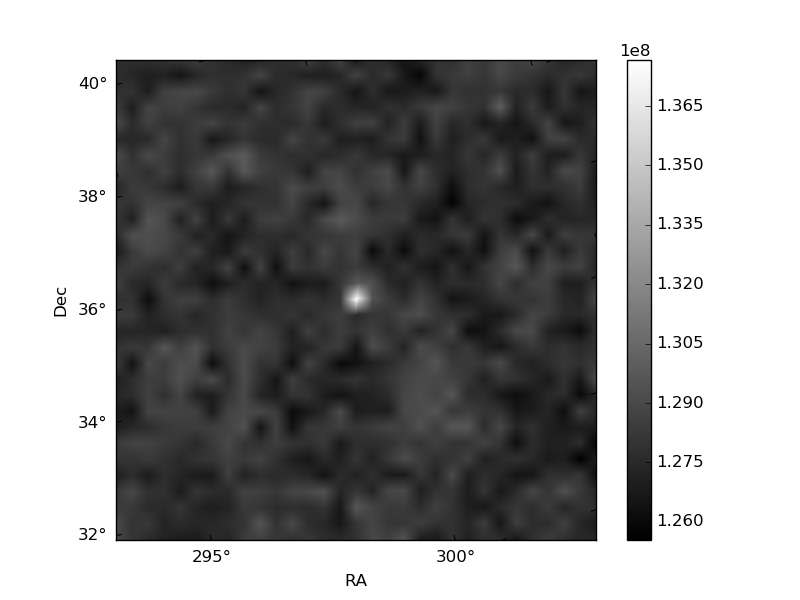
Histogram calculated using DETX and DETY for each event in the final _common_clean file
| Quadrant A | 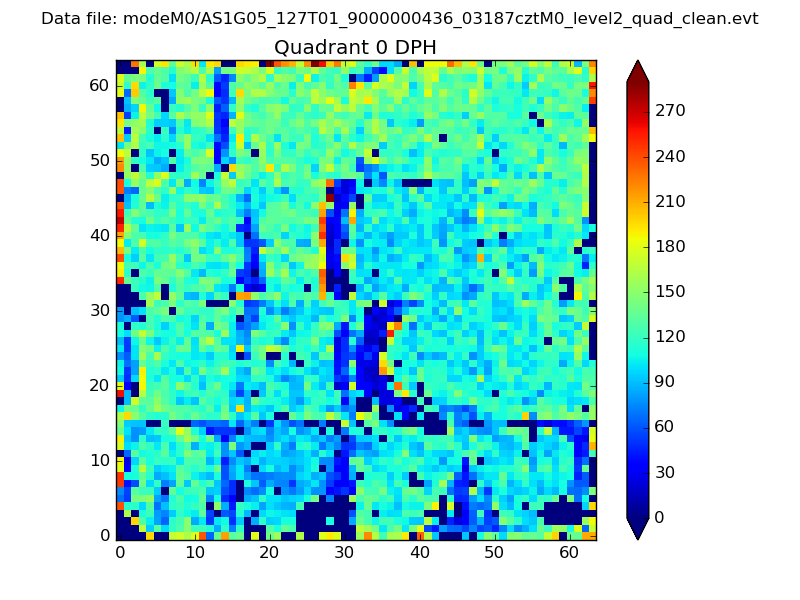 |
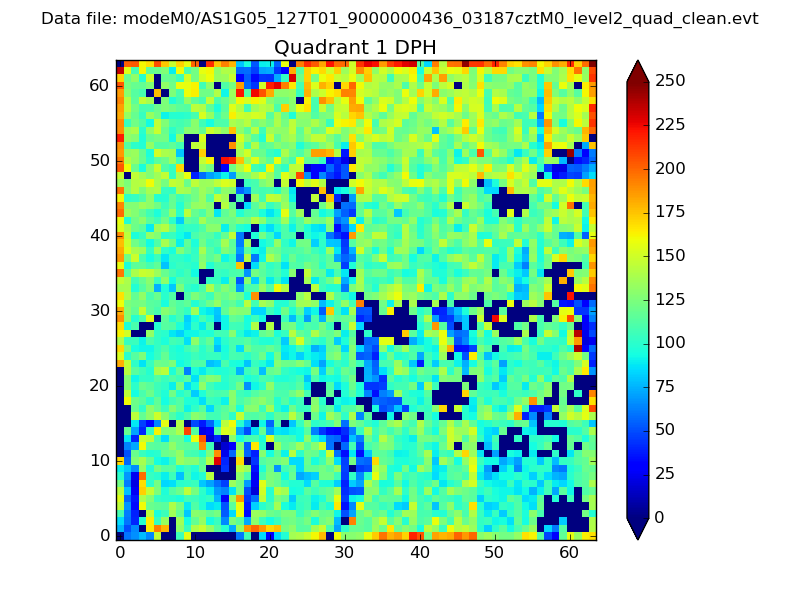 |
Quadrant B |
|---|---|---|---|
| Quadrant D | 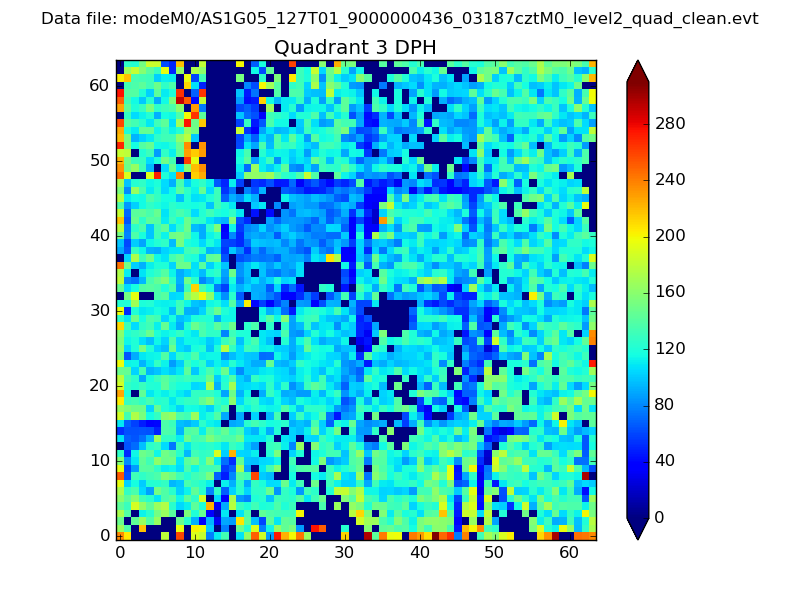 |
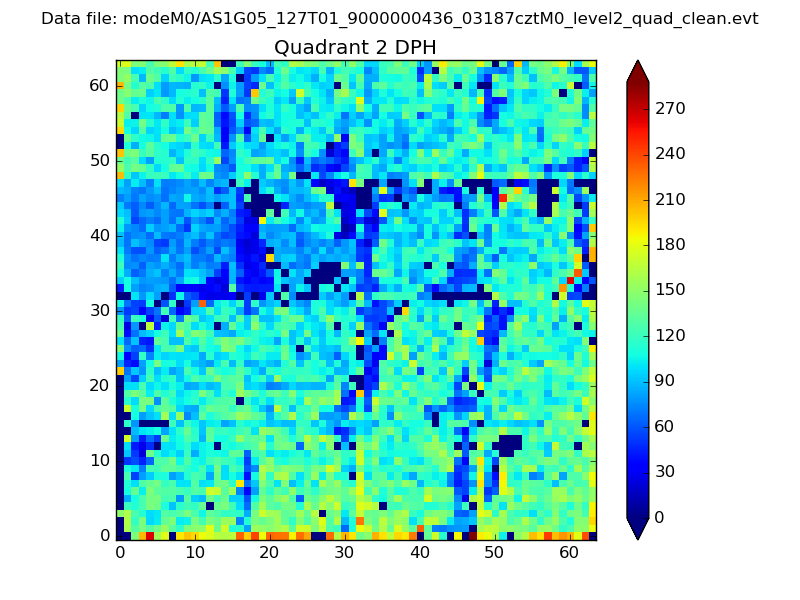 |
Quadrant C |
| Plot type | Count rate plots | Images |
|---|---|---|
| Comparison with Poisson distribution Blue bars denote a histogram of data divided into 1 sec bins. Red curve is a Poisson curve with rate = median count rate of data. |
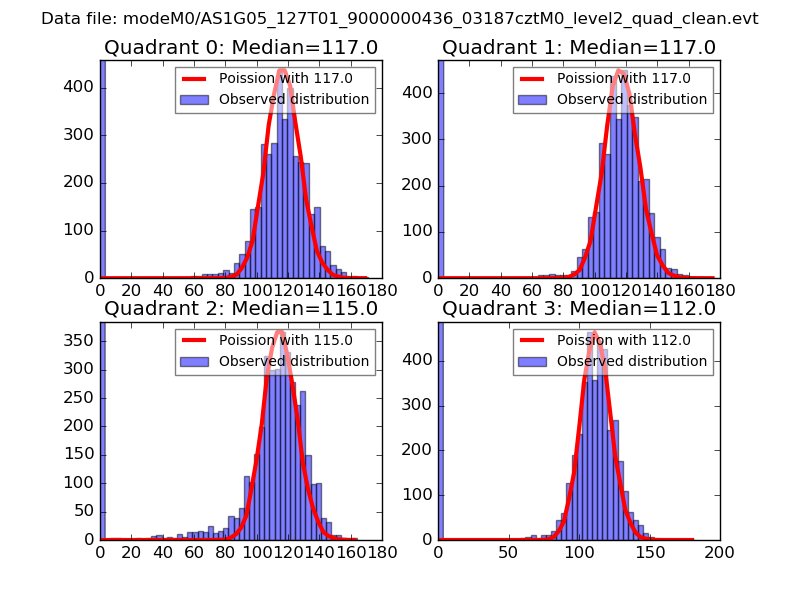 |
 |
| Quadrant-wise count rates Data is divided into 100 sec bins |
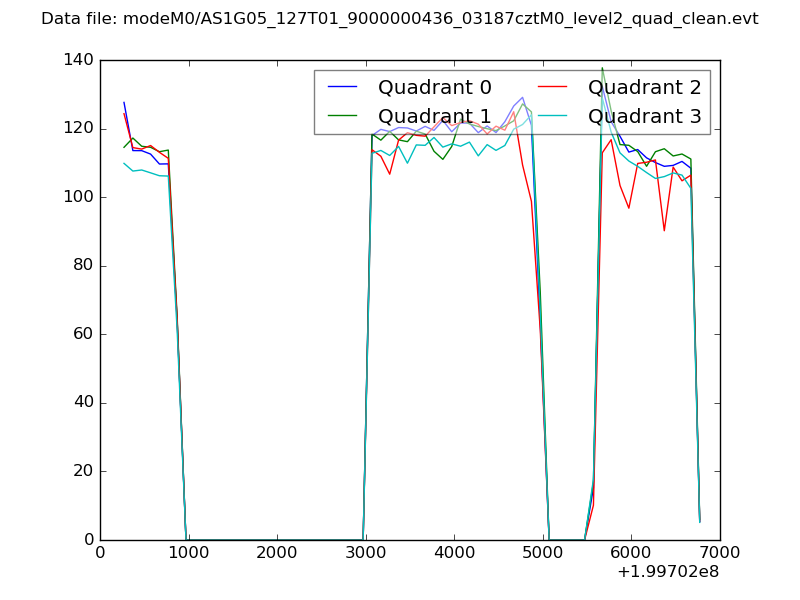 |
|
| Module-wise count rates for Quadrant A Data is divided into 100 sec bins |
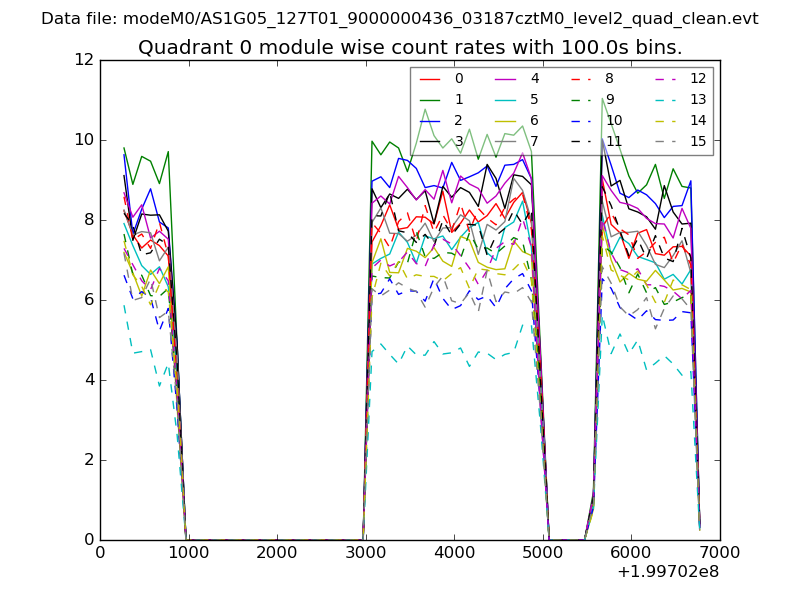 |
 |
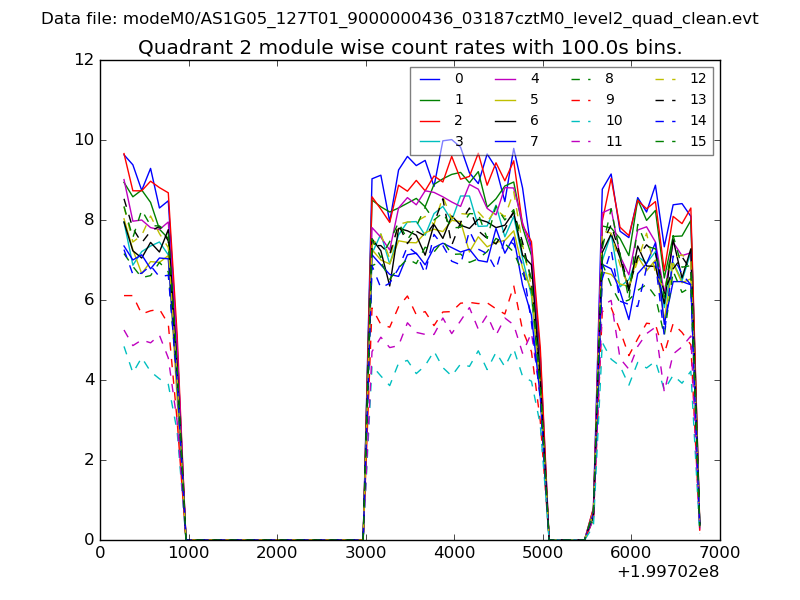
| Module-wise count rates for Quadrant B Data is divided into 100 sec bins |
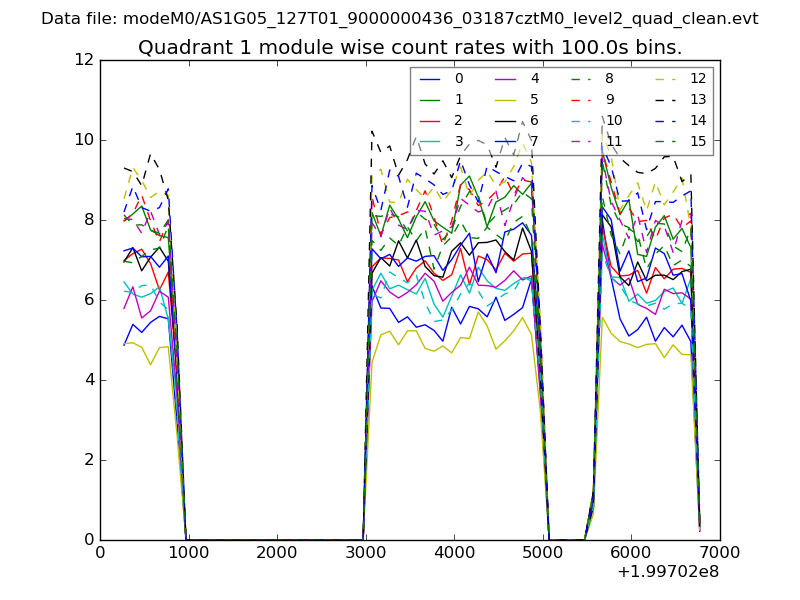 |
 |
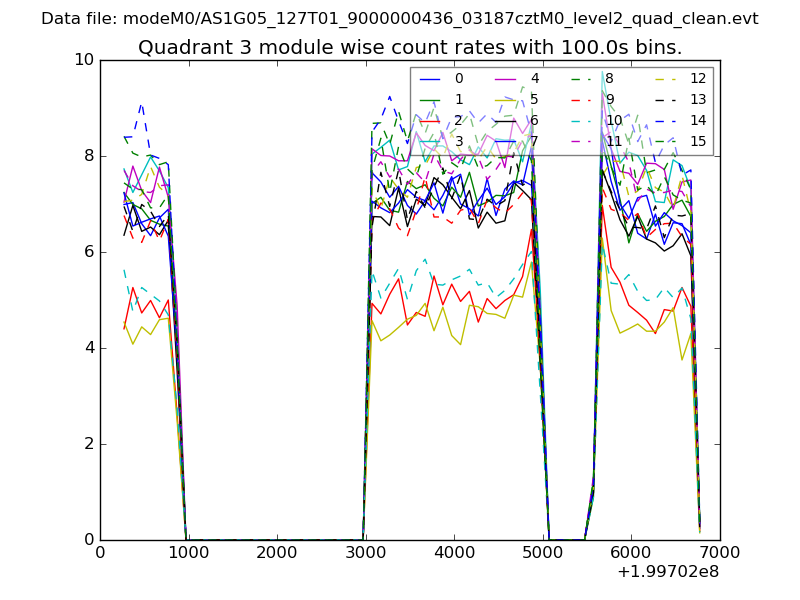
| Module-wise count rates for Quadrant C Data is divided into 100 sec bins |
 |
 |
| Module-wise count rates for Quadrant D Data is divided into 100 sec bins |
 |
 |
| Parameter | Plot |
|---|---|
| CZT HV Monitor | 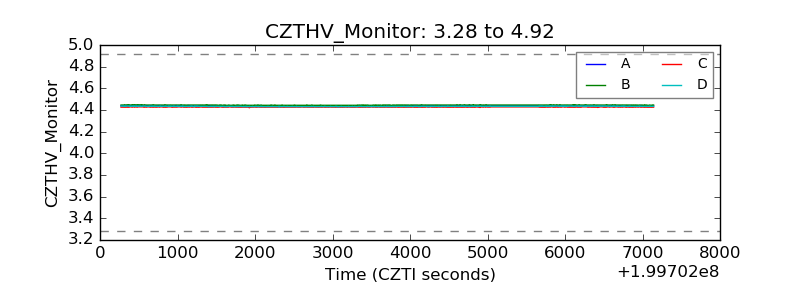 |
| D_VDD | 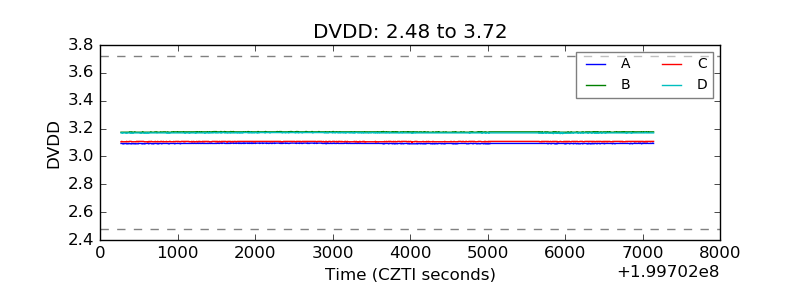 |
| Temperature 1 | 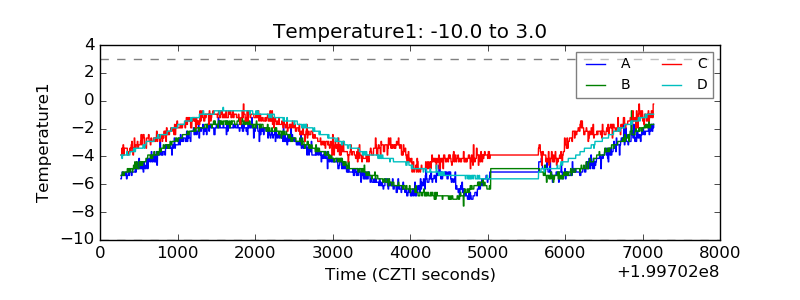 |
| Veto HV Monitor | 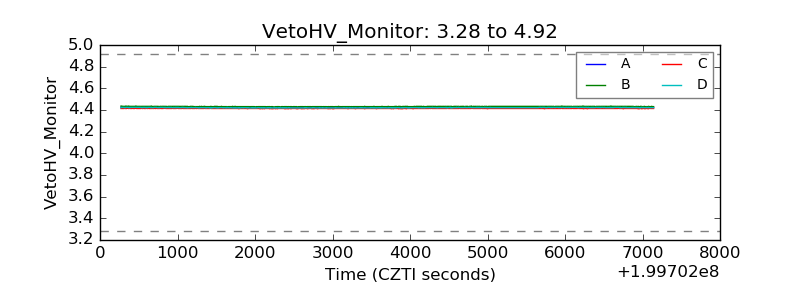 |
| Veto LLD | 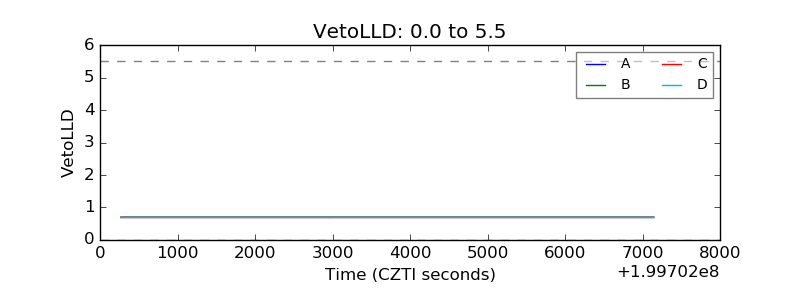 |
| Alpha Counter | 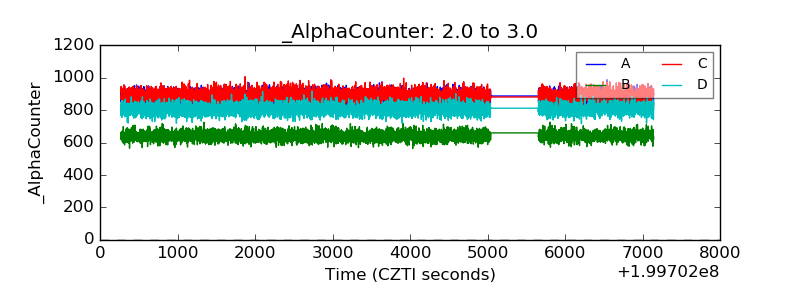 |
| _CPM_Rate | 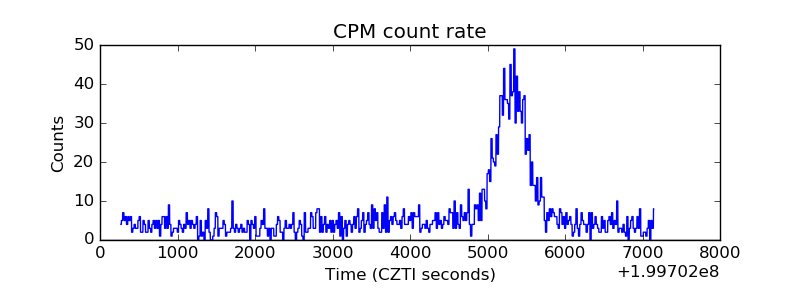 |
| CZT Counter | 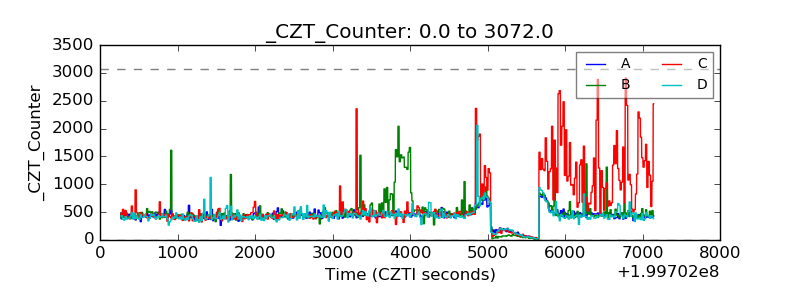 |
| +2.5 Volts monitor | 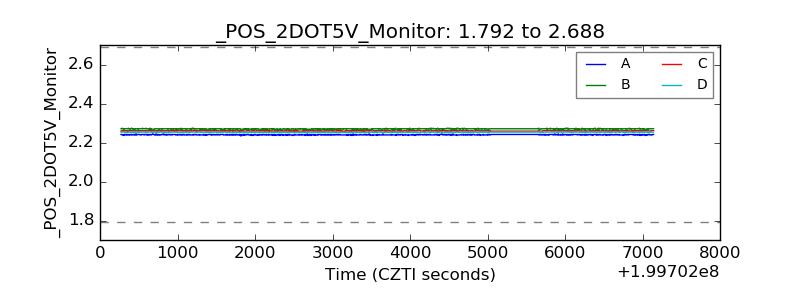 |
| +5 Volts monitor |  |
| _ROLL_ROT | 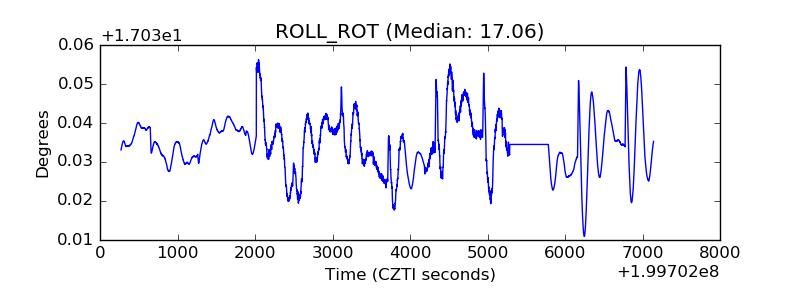 |
| _Roll_DEC | 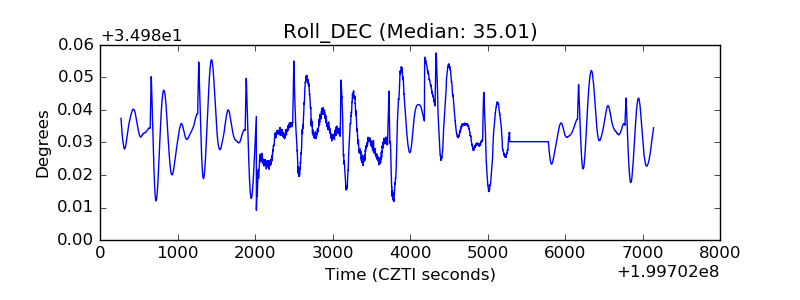 |
| _Roll_RA | 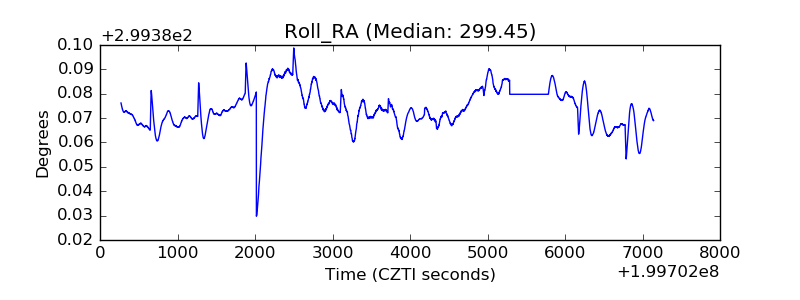 |
| Veto Counter | 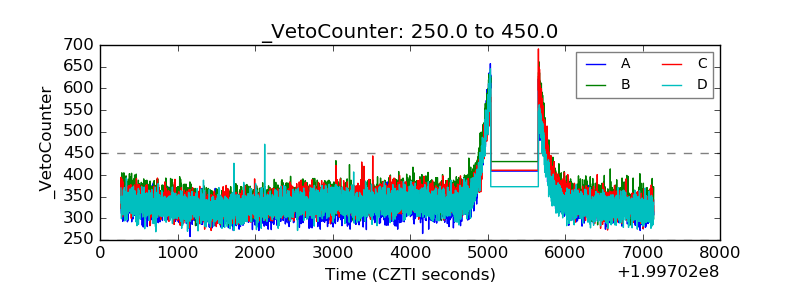 |