| Param | Original file | Final file |
|---|---|---|
| Filename | modeM0/AS1G05_127T01_9000000436_03188cztM0_level2.evt | modeM0/AS1G05_127T01_9000000436_03188cztM0_level2_quad_clean.evt |
| Size (bytes) | 752,860,800 | 85,043,520 |
| Size | 718.0 MB | 81.1 MB |
| Events in quadrant A | 3,635,043 | 527,555 |
| Events in quadrant B | 3,939,248 | 532,551 |
| Events in quadrant C | 10,908,945 | 465,111 |
| Events in quadrant D | 3,790,970 | 507,873 |
| Mode M9 | |||
|---|---|---|---|
| Quadrant | BADHDUFLAG | Total packets | Discarded packets |
| A | 0 | 1 | 0 |
| B | 0 | 1 | 0 |
| C | 0 | 1 | 0 |
| D | 0 | 1 | 0 |
| Mode SS | |||
|---|---|---|---|
| Quadrant | BADHDUFLAG | Total packets | Discarded packets |
| A | 0 | 158 | 0 |
| B | 0 | 158 | 0 |
| C | 0 | 158 | 0 |
| D | 0 | 158 | 0 |
| Mode M0 | |||
|---|---|---|---|
| Quadrant | BADHDUFLAG | Total packets | Discarded packets |
| A | 0 | 16135 | 2 |
| B | 0 | 16746 | 1 |
| C | 0 | 37891 | 1 |
| D | 0 | 16825 | 1 |
| Quadrant | Total seconds | Saturated seconds | Saturation percentage |
|---|---|---|---|
| A | 7782 | 260 | 3.341043% |
| B | 7782 | 252 | 3.238242% |
| C | 7782 | 1825 | 23.451555% |
| D | 7782 | 231 | 2.968389% |
Noise dominated data is calculated using 1-second bins in cleaned event files. If a bin has >2000 counts, and if more than 50% of those come from <1% of pixels, then it is considered to be noise-dominated and hence unusable.
| Quadrant | # 1 sec bins | Bins with >0 counts | Bins with >2000 counts | High rate bins dominated by noise | Noise dominated (total time) | Noise dominated (detector-on time) | Marked lightcurve |
|---|---|---|---|---|---|---|---|
| A | 7912 | 7782 | 5 | 5 | 0.06% | 0.06% | 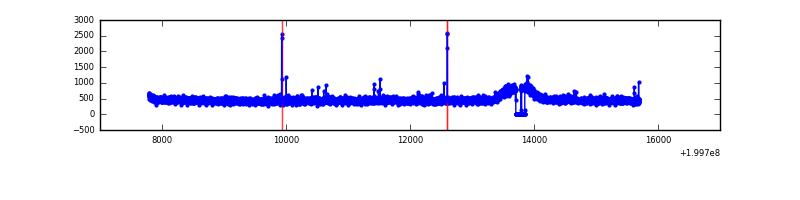 |
| B | 7912 | 7783 | 11 | 11 | 0.14% | 0.14% | 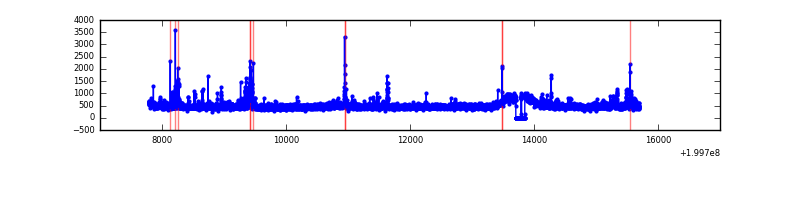 |
| C | 7912 | 7782 | 1486 | 1486 | 18.78% | 19.10% | 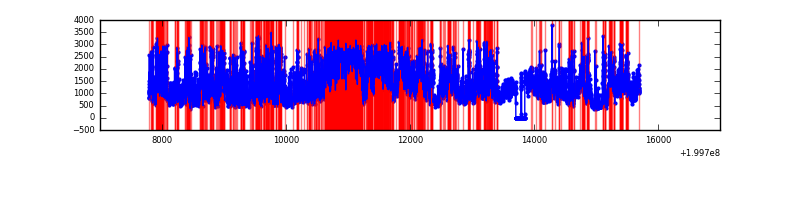 |
| D | 7912 | 7782 | 33 | 33 | 0.42% | 0.42% | 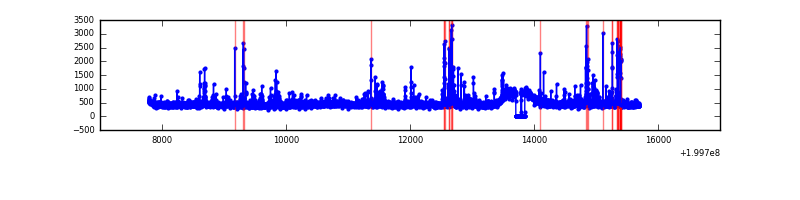 |
Top three noisy pixels from each quadrant. If the there are fewer than three noisy pixels in the level2.evt file, extra rows are filled as -1
| Pixel properties | Quadrant properties | ||||||
|---|---|---|---|---|---|---|---|
| Quadrant | DetID | PixID | Counts | Sigma | Mean | Median | Sigma |
| A | 5 | 113 | 46236 | 236.34 | 928 | 907 | 191.8 |
| A | 0 | 226 | 10322 | 49.09 | 928 | 907 | 191.8 |
| A | 12 | 194 | 10117 | 48.02 | 928 | 907 | 191.8 |
| B | 4 | 80 | 132002 | 715.06 | 941 | 918 | 183.3 |
| B | 2 | 249 | 56472 | 303.05 | 941 | 918 | 183.3 |
| B | 4 | 200 | 26910 | 141.79 | 941 | 918 | 183.3 |
| C | 12 | 206 | 7475978 | 38601.76 | 831 | 834 | 193.6 |
| C | 1 | 192 | 63592 | 324.08 | 831 | 834 | 193.6 |
| C | 6 | 80 | 56301 | 286.43 | 831 | 834 | 193.6 |
| D | 13 | 223 | 128728 | 582.71 | 897 | 867 | 219.4 |
| D | 5 | 233 | 96317 | 435.0 | 897 | 867 | 219.4 |
| D | 13 | 120 | 72352 | 325.78 | 897 | 867 | 219.4 |
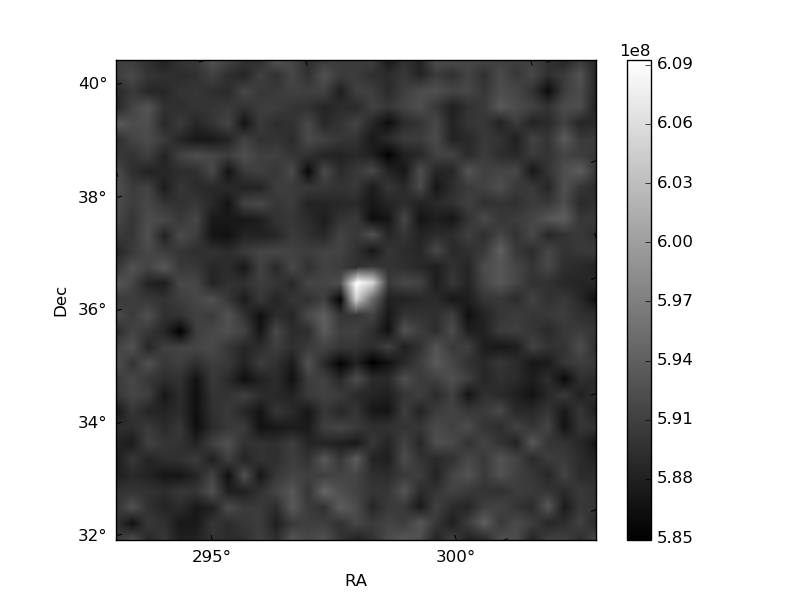
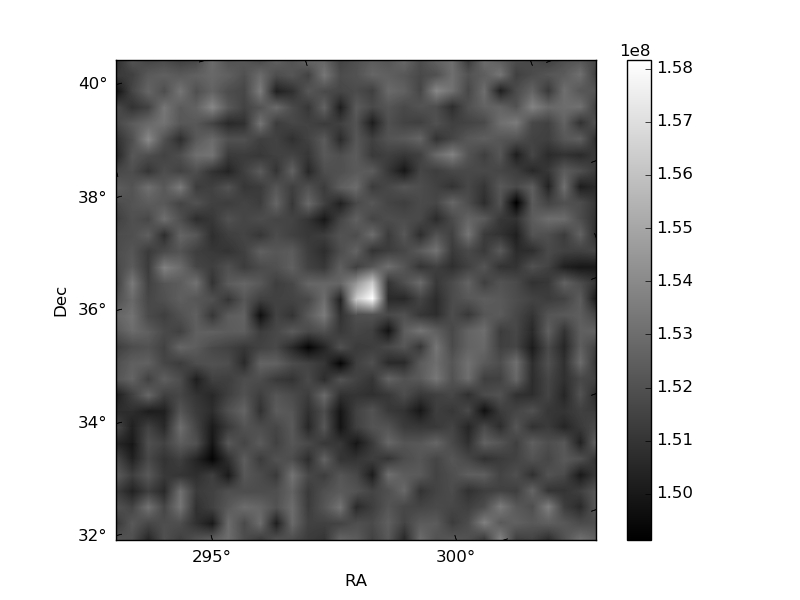
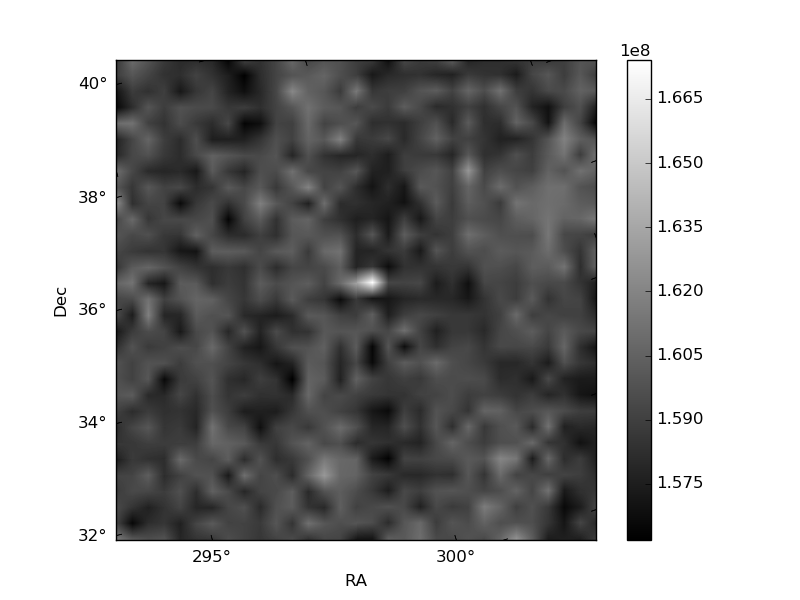
Histogram calculated using DETX and DETY for each event in the final _common_clean file
| Quadrant A | 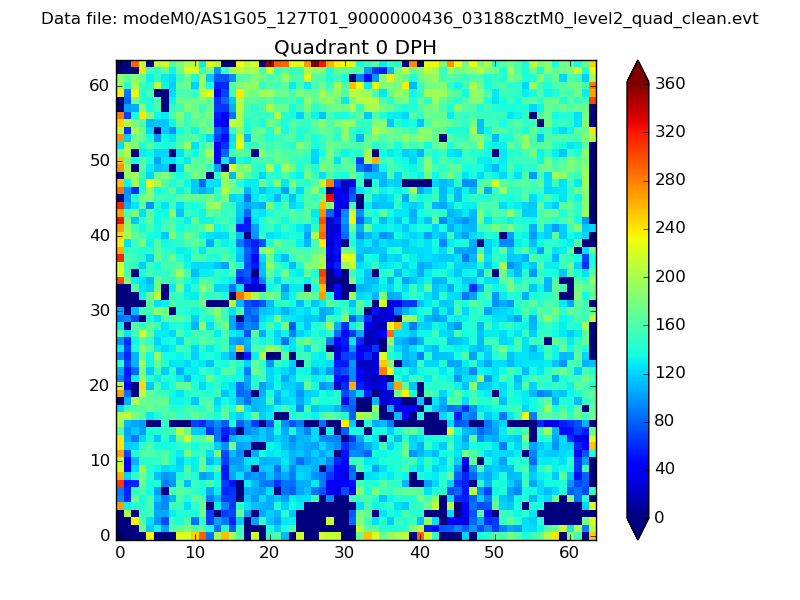 |
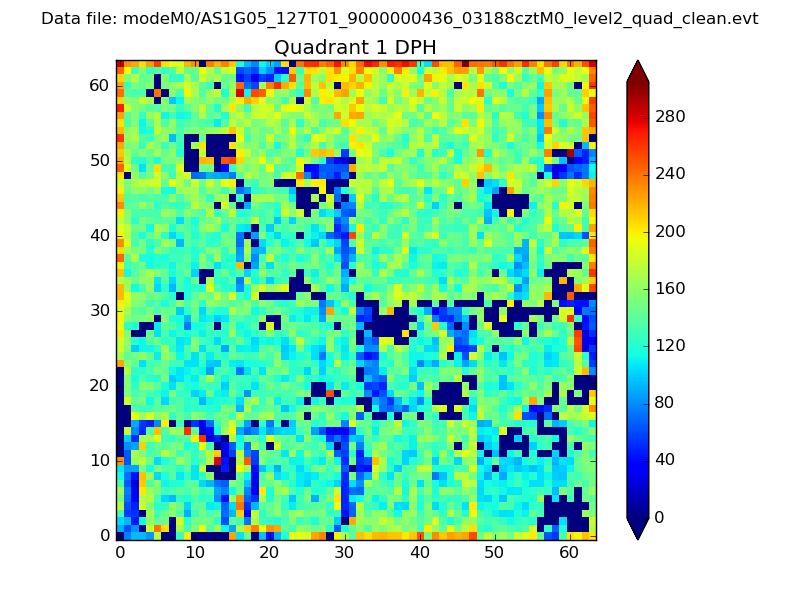 |
Quadrant B |
|---|---|---|---|
| Quadrant D | 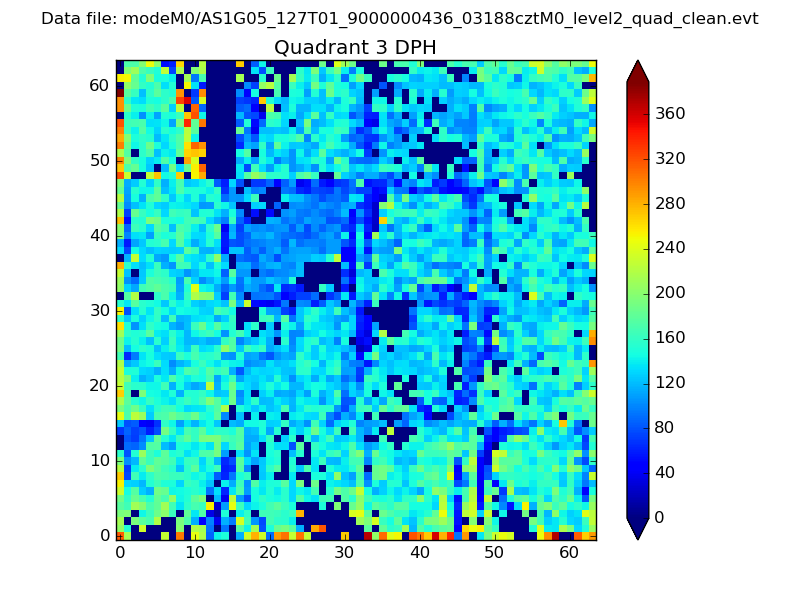 |
 |
Quadrant C |
| Plot type | Count rate plots | Images |
|---|---|---|
| Comparison with Poisson distribution Blue bars denote a histogram of data divided into 1 sec bins. Red curve is a Poisson curve with rate = median count rate of data. |
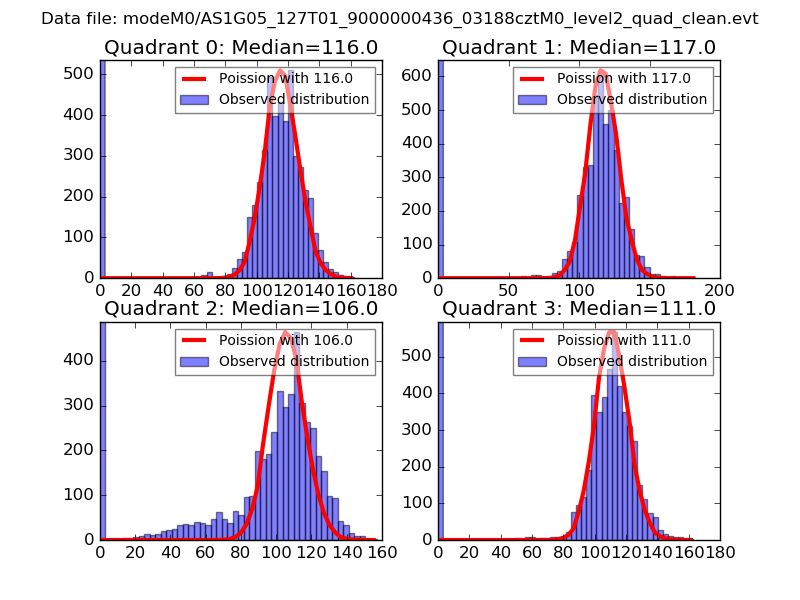 |
 |
| Quadrant-wise count rates Data is divided into 100 sec bins |
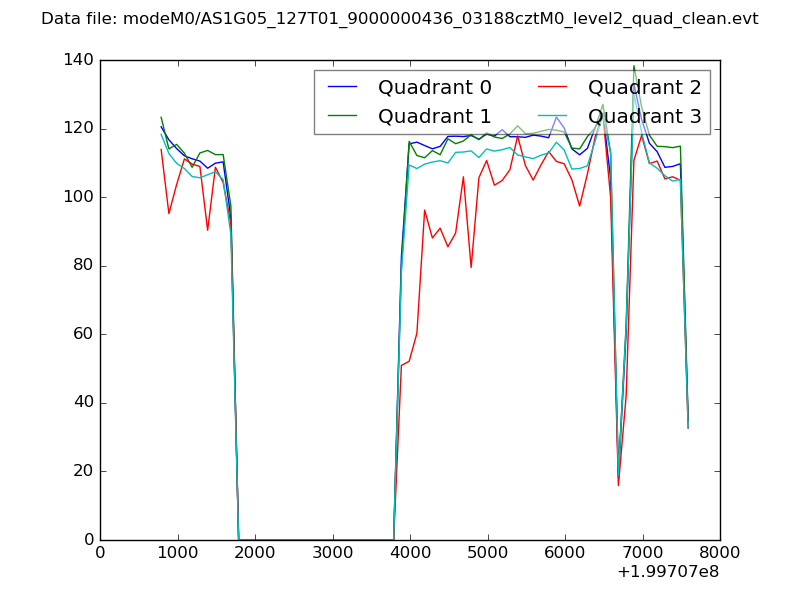 |
|
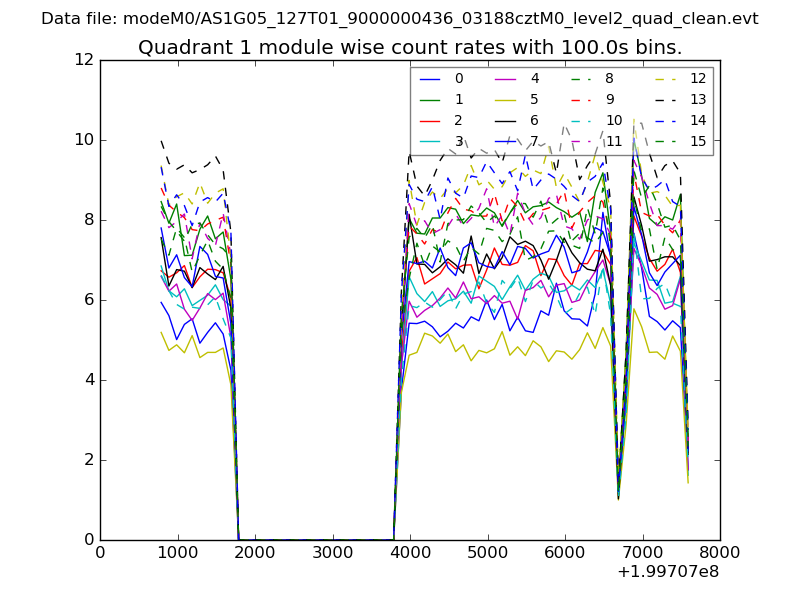
| Module-wise count rates for Quadrant A Data is divided into 100 sec bins |
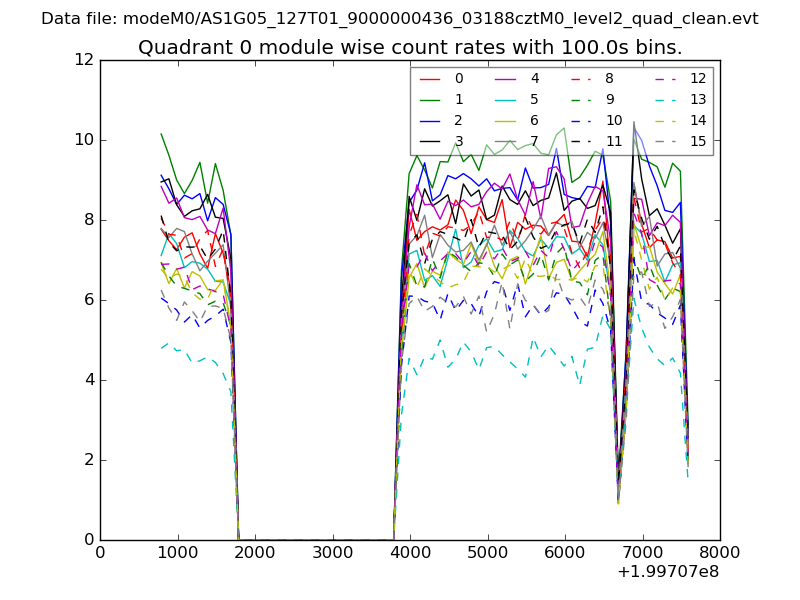 |
 |
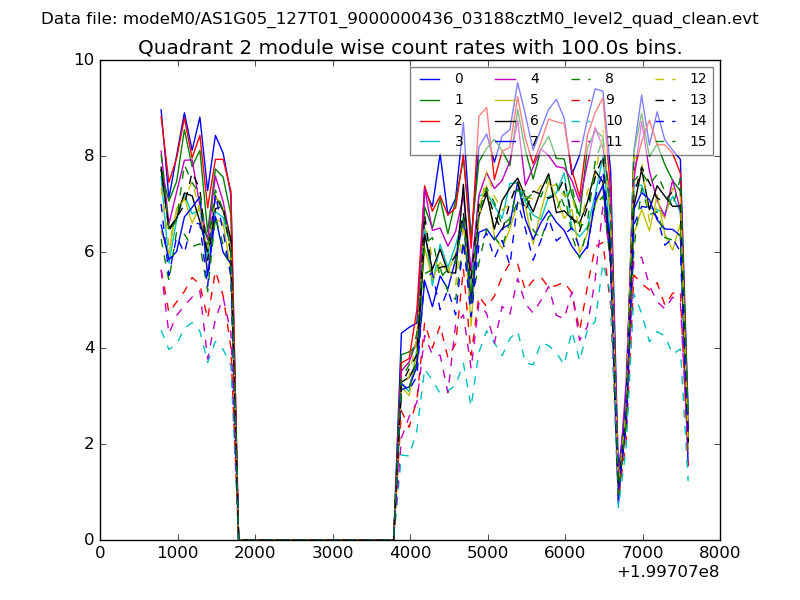
| Module-wise count rates for Quadrant B Data is divided into 100 sec bins |
 |
 |
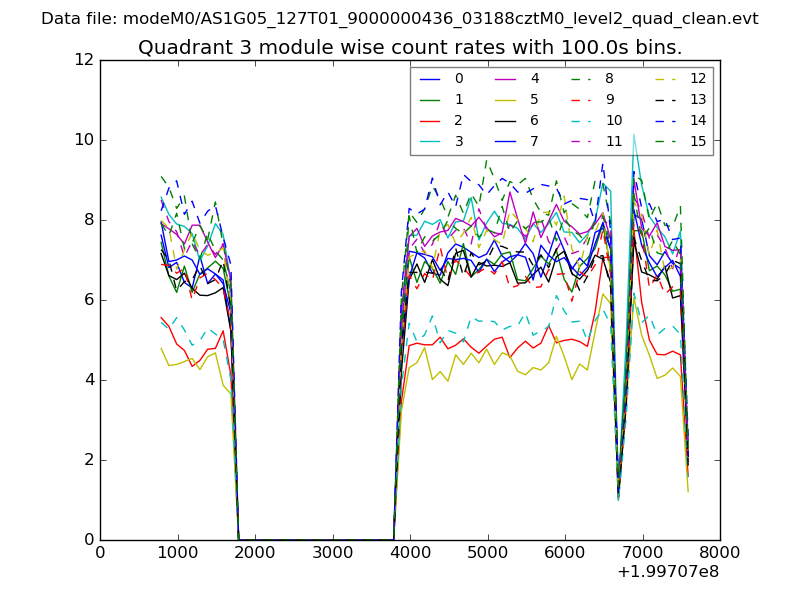
| Module-wise count rates for Quadrant C Data is divided into 100 sec bins |
 |
 |
| Module-wise count rates for Quadrant D Data is divided into 100 sec bins |
 |
 |
| Parameter | Plot |
|---|---|
| CZT HV Monitor | 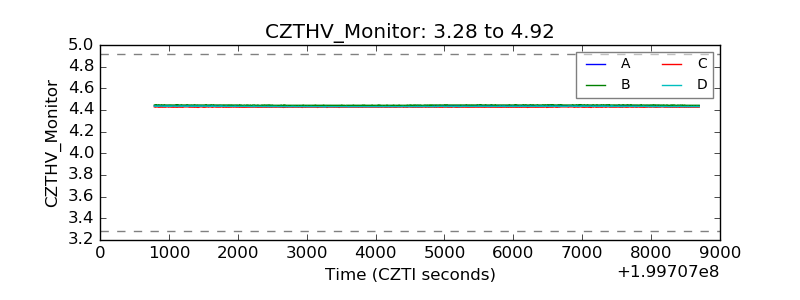 |
| D_VDD |  |
| Temperature 1 | 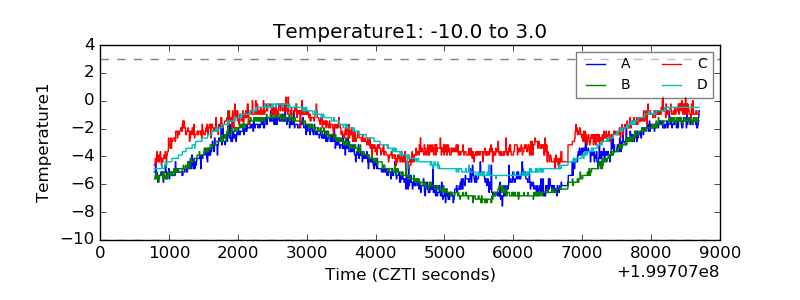 |
| Veto HV Monitor | 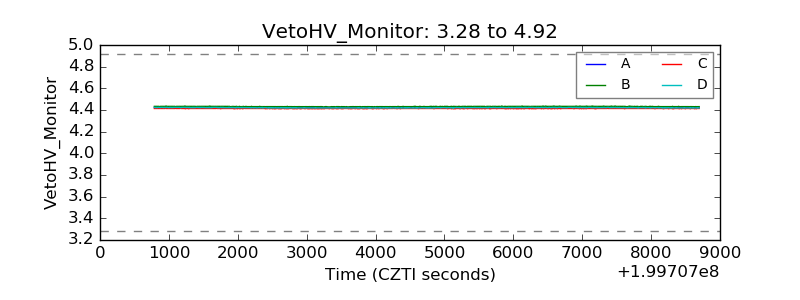 |
| Veto LLD | 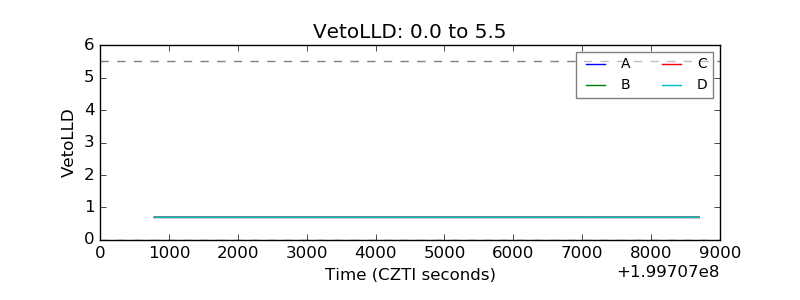 |
| Alpha Counter | 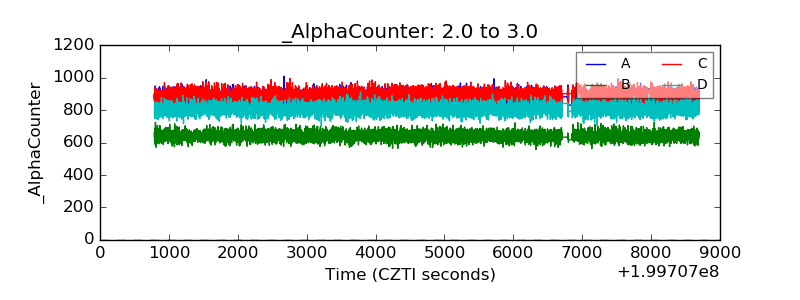 |
| _CPM_Rate | 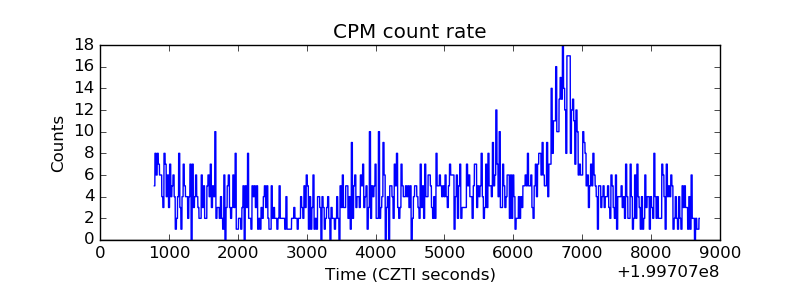 |
| CZT Counter |  |
| +2.5 Volts monitor |  |
| +5 Volts monitor |  |
| _ROLL_ROT | 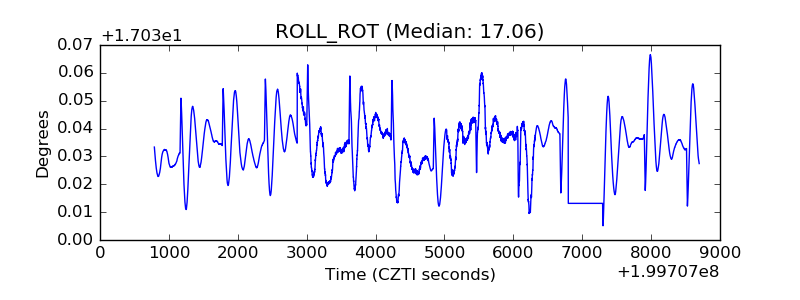 |
| _Roll_DEC | 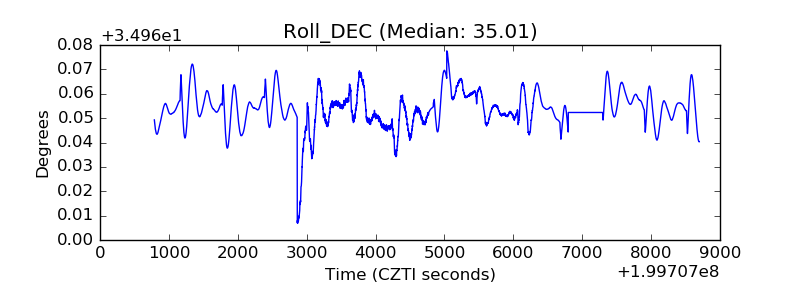 |
| _Roll_RA | 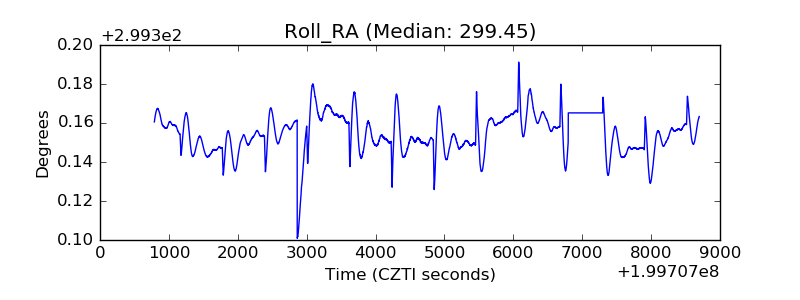 |
| Veto Counter | 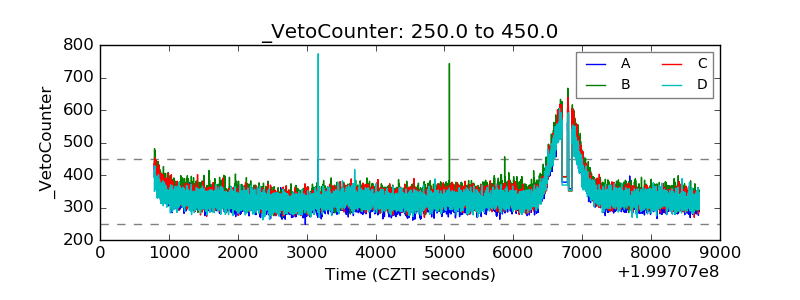 |