| Param | Original file | Final file |
|---|---|---|
| Filename | modeM0/AS1G05_127T01_9000000436_03189cztM0_level2.evt | modeM0/AS1G05_127T01_9000000436_03189cztM0_level2_quad_clean.evt |
| Size (bytes) | 621,420,480 | 78,652,800 |
| Size | 592.6 MB | 75.0 MB |
| Events in quadrant A | 3,587,757 | 470,374 |
| Events in quadrant B | 3,778,073 | 473,061 |
| Events in quadrant C | 7,085,379 | 459,035 |
| Events in quadrant D | 3,853,736 | 450,048 |
| Mode SS | |||
|---|---|---|---|
| Quadrant | BADHDUFLAG | Total packets | Discarded packets |
| A | 0 | 152 | 0 |
| B | 0 | 152 | 0 |
| C | 0 | 152 | 0 |
| D | 0 | 152 | 0 |
| Mode M0 | |||
|---|---|---|---|
| Quadrant | BADHDUFLAG | Total packets | Discarded packets |
| A | 0 | 15832 | 1 |
| B | 0 | 16161 | 0 |
| C | 0 | 26240 | 0 |
| D | 0 | 16923 | 0 |
| Quadrant | Total seconds | Saturated seconds | Saturation percentage |
|---|---|---|---|
| A | 7599 | 232 | 3.053033% |
| B | 7599 | 231 | 3.039874% |
| C | 7599 | 567 | 7.461508% |
| D | 7599 | 260 | 3.421503% |
Noise dominated data is calculated using 1-second bins in cleaned event files. If a bin has >2000 counts, and if more than 50% of those come from <1% of pixels, then it is considered to be noise-dominated and hence unusable.
| Quadrant | # 1 sec bins | Bins with >0 counts | Bins with >2000 counts | High rate bins dominated by noise | Noise dominated (total time) | Noise dominated (detector-on time) | Marked lightcurve |
|---|---|---|---|---|---|---|---|
| A | 7599 | 7599 | 0 | 0 | 0.00% | 0.00% |  |
| B | 7599 | 7599 | 9 | 9 | 0.12% | 0.12% |  |
| C | 7599 | 7599 | 311 | 311 | 4.09% | 4.09% |  |
| D | 7599 | 7599 | 72 | 72 | 0.95% | 0.95% |  |
Top three noisy pixels from each quadrant. If the there are fewer than three noisy pixels in the level2.evt file, extra rows are filled as -1
| Pixel properties | Quadrant properties | ||||||
|---|---|---|---|---|---|---|---|
| Quadrant | DetID | PixID | Counts | Sigma | Mean | Median | Sigma |
| A | 0 | 149 | 32241 | 166.41 | 913 | 893 | 188.4 |
| A | 5 | 113 | 22267 | 113.46 | 913 | 893 | 188.4 |
| A | 0 | 226 | 12498 | 61.6 | 913 | 893 | 188.4 |
| B | 4 | 80 | 121528 | 661.86 | 924 | 902 | 182.3 |
| B | 4 | 200 | 23370 | 123.28 | 924 | 902 | 182.3 |
| B | 0 | 231 | 17930 | 93.43 | 924 | 902 | 182.3 |
| C | 12 | 206 | 3326668 | 16340.37 | 867 | 870 | 203.5 |
| C | 14 | 223 | 187893 | 918.88 | 867 | 870 | 203.5 |
| C | 6 | 80 | 68841 | 333.96 | 867 | 870 | 203.5 |
| D | 5 | 233 | 249608 | 1160.87 | 880 | 853 | 214.3 |
| D | 13 | 223 | 112126 | 519.28 | 880 | 853 | 214.3 |
| D | 13 | 120 | 66184 | 304.88 | 880 | 853 | 214.3 |
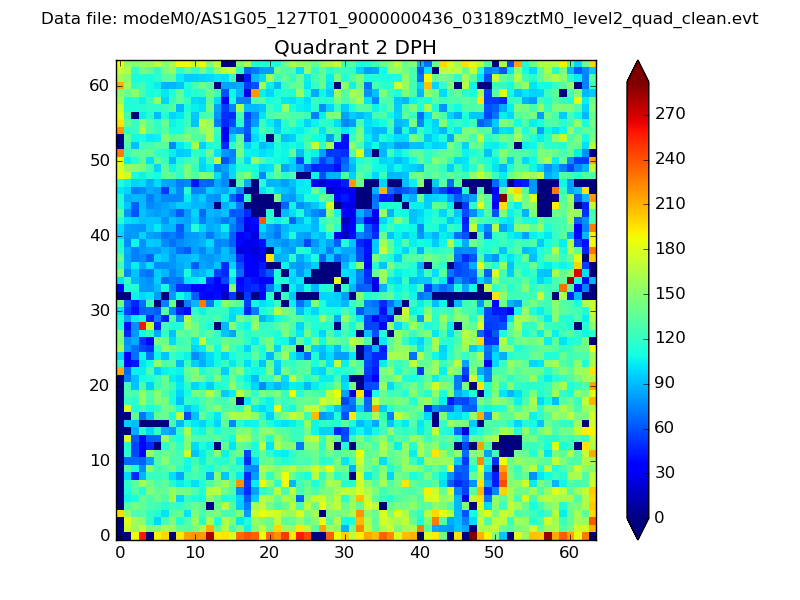
Histogram calculated using DETX and DETY for each event in the final _common_clean file
| Quadrant A | 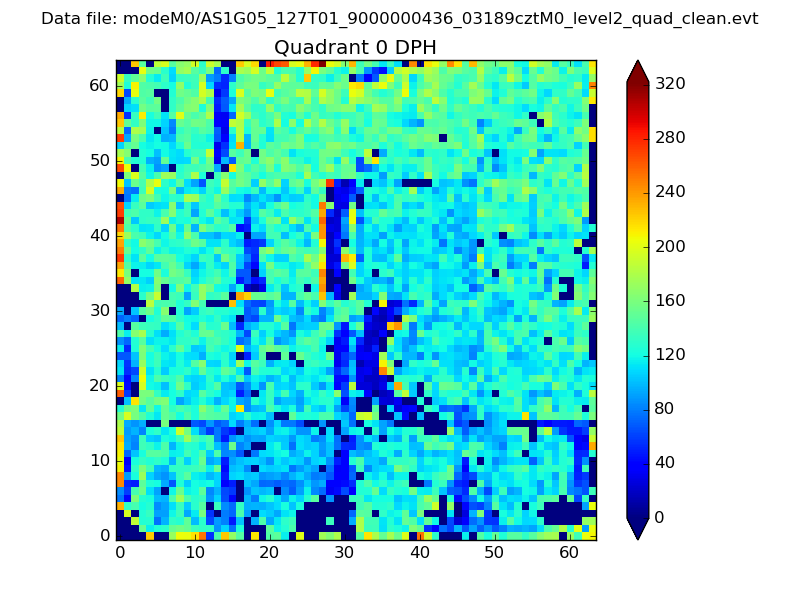 |
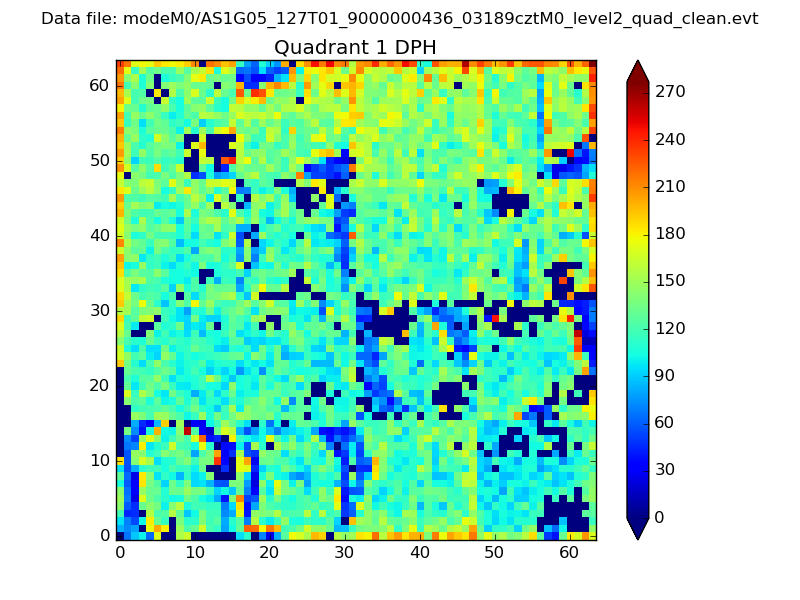 |
Quadrant B |
|---|---|---|---|
| Quadrant D | 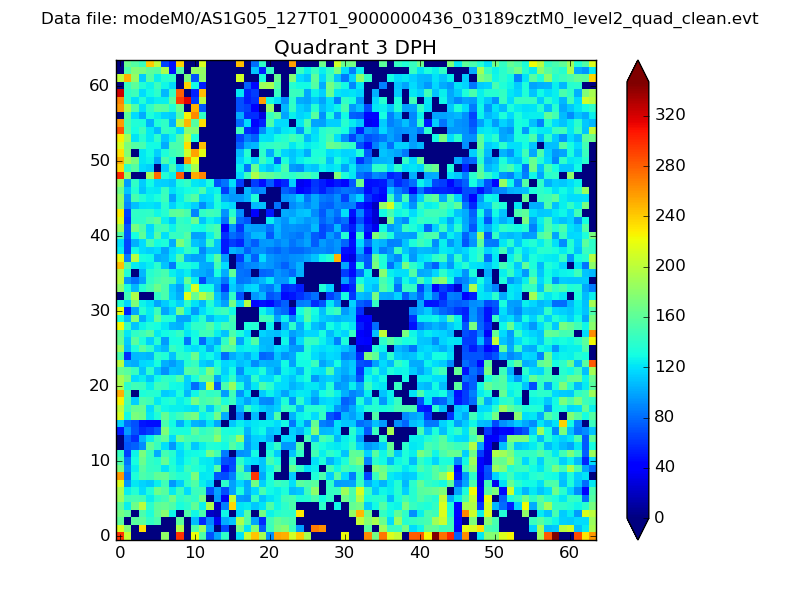 |
 |
Quadrant C |
| Plot type | Count rate plots | Images |
|---|---|---|
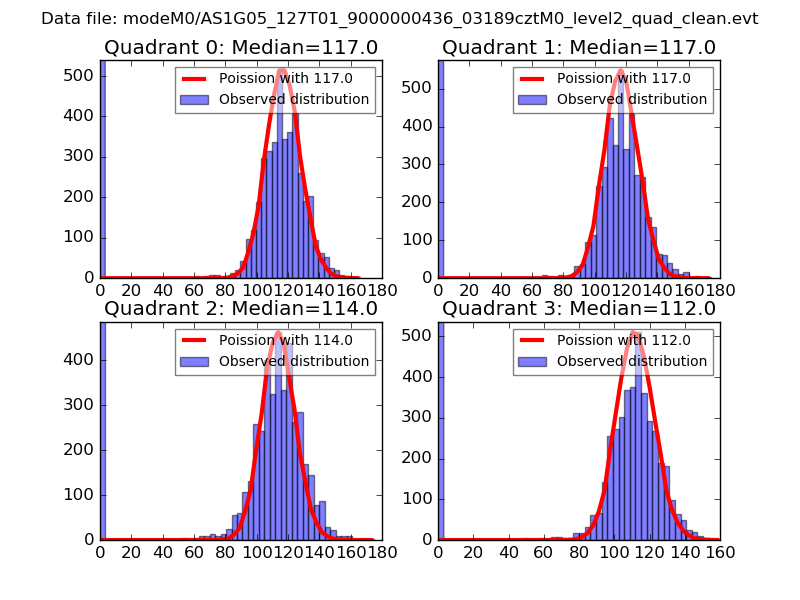
| Comparison with Poisson distribution Blue bars denote a histogram of data divided into 1 sec bins. Red curve is a Poisson curve with rate = median count rate of data. |
 |
 |
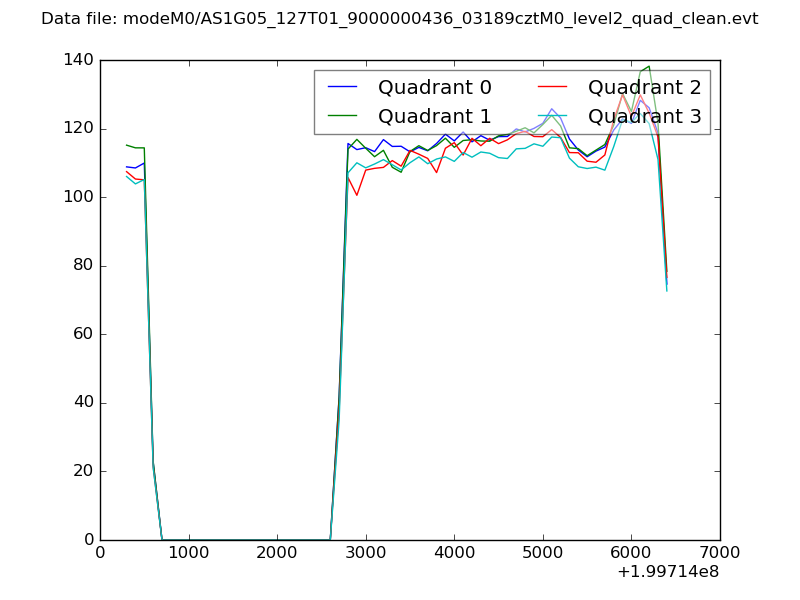
| Quadrant-wise count rates Data is divided into 100 sec bins |
 |
|
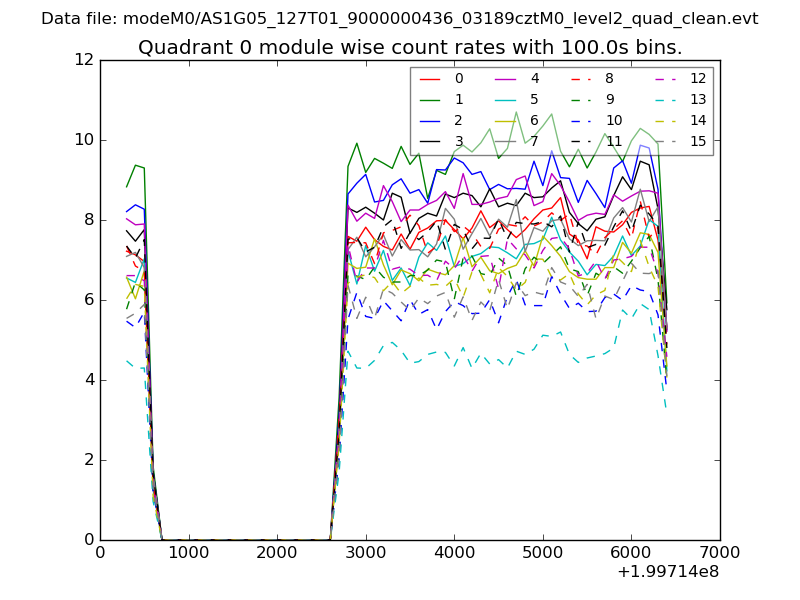
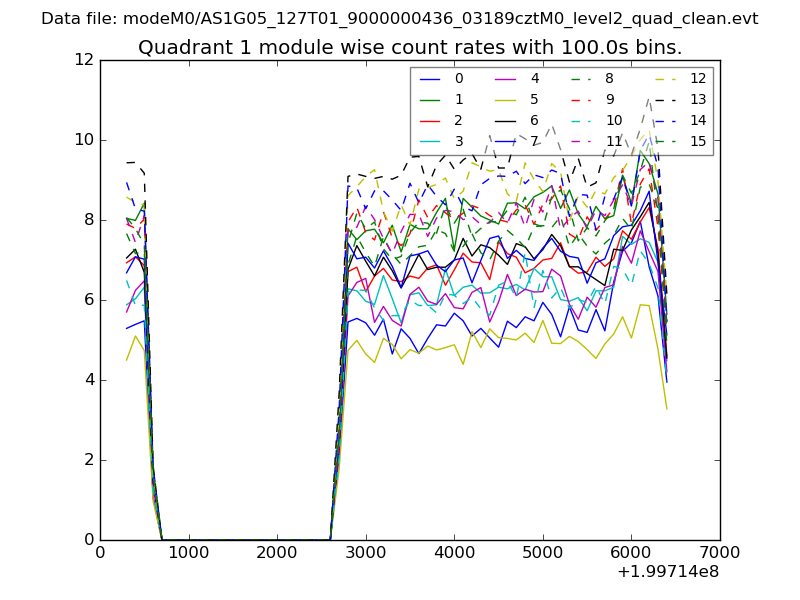
| Module-wise count rates for Quadrant A Data is divided into 100 sec bins |
 |
 |
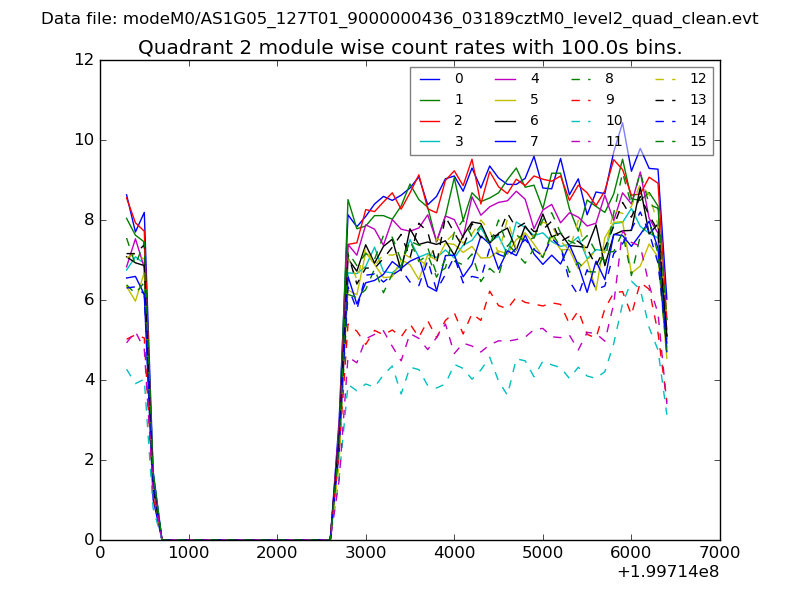
| Module-wise count rates for Quadrant B Data is divided into 100 sec bins |
 |
 |
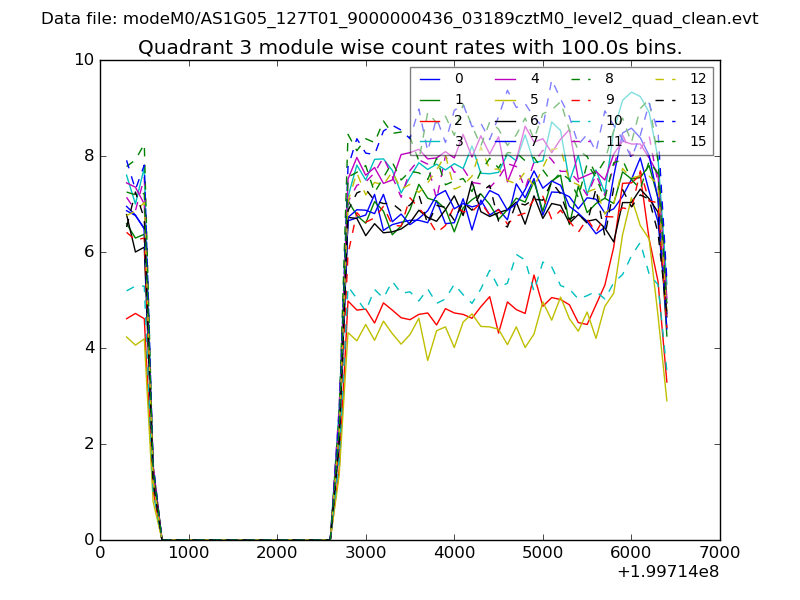
| Module-wise count rates for Quadrant C Data is divided into 100 sec bins |
 |
 |
| Module-wise count rates for Quadrant D Data is divided into 100 sec bins |
 |
 |
| Parameter | Plot |
|---|---|
| CZT HV Monitor | 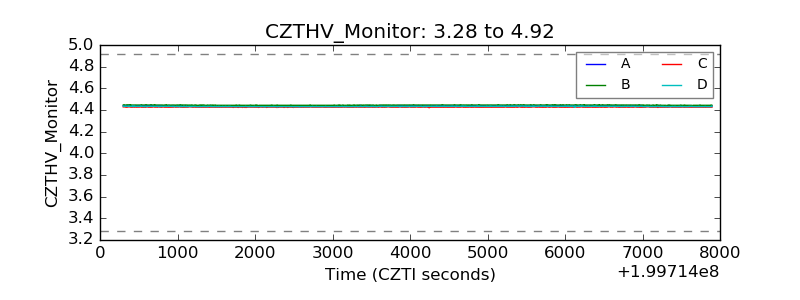 |
| D_VDD | 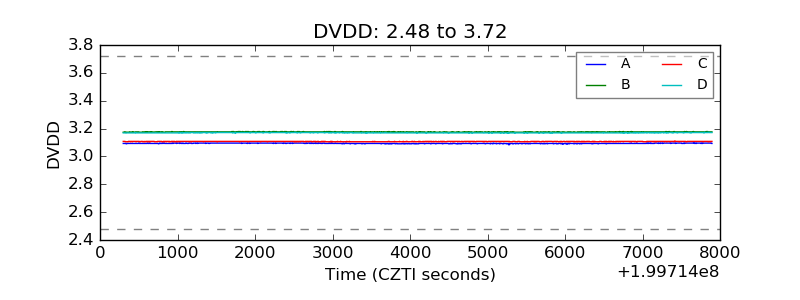 |
| Temperature 1 | 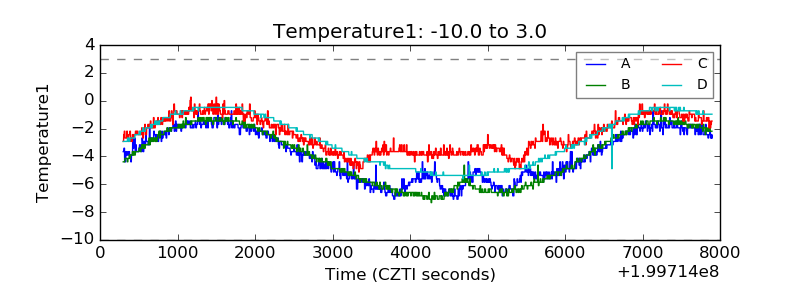 |
| Veto HV Monitor | 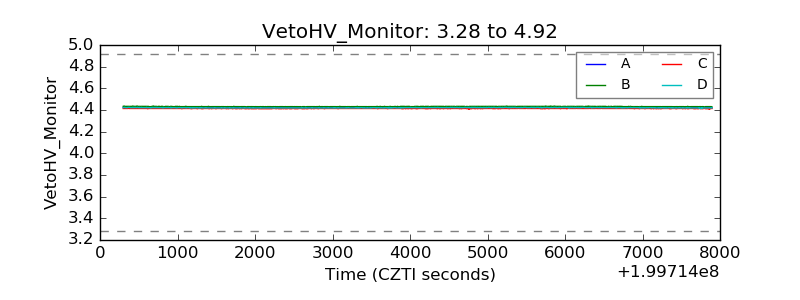 |
| Veto LLD |  |
| Alpha Counter | 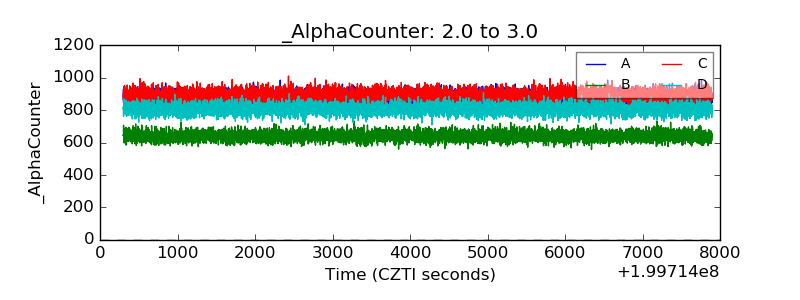 |
| _CPM_Rate | 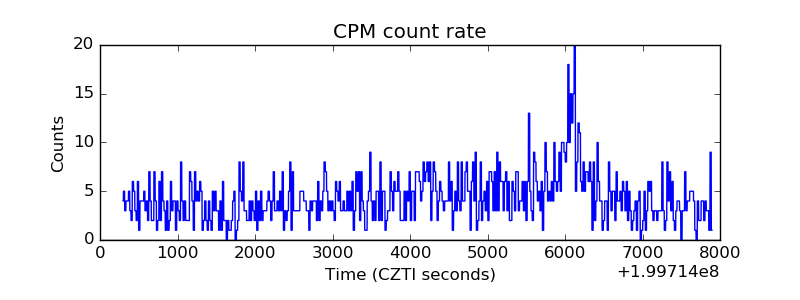 |
| CZT Counter | 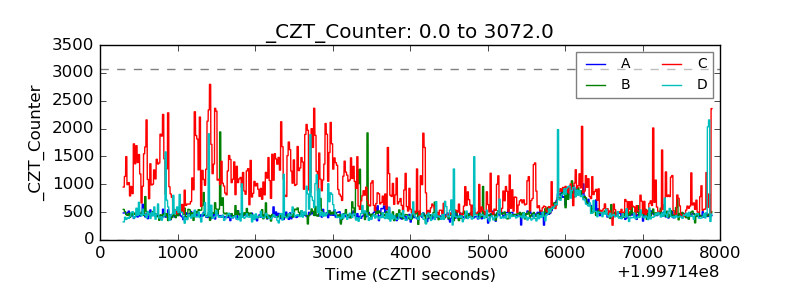 |
| +2.5 Volts monitor |  |
| +5 Volts monitor |  |
| _ROLL_ROT | 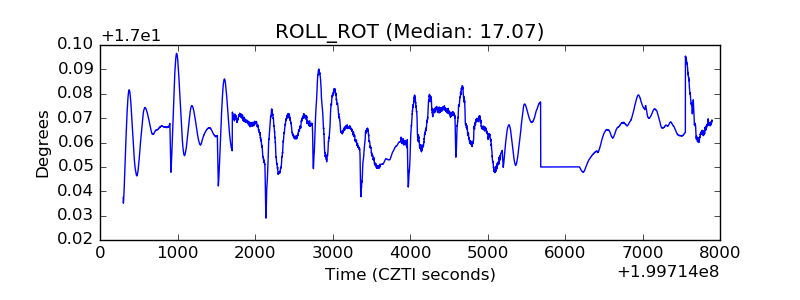 |
| _Roll_DEC | 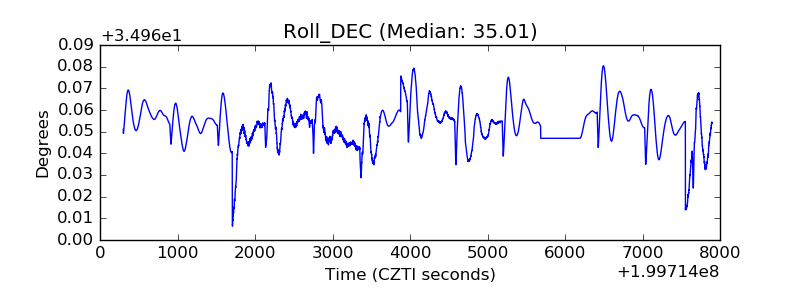 |
| _Roll_RA | 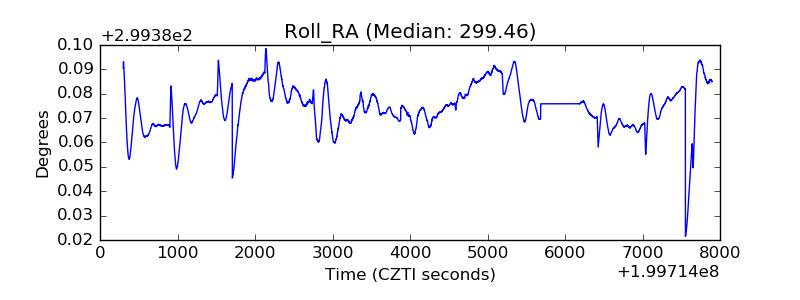 |
| Veto Counter | 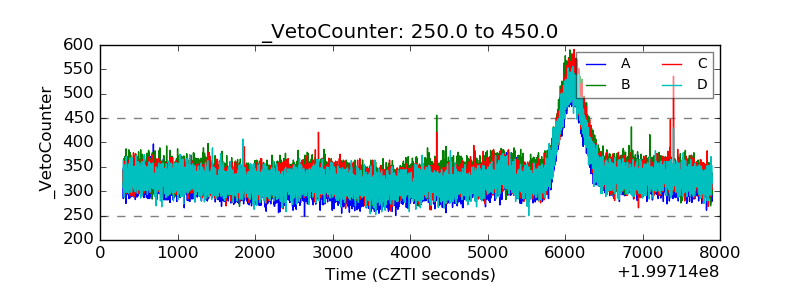 |