| Param | Original file | Final file |
|---|---|---|
| Filename | modeM0/AS1G05_127T01_9000000436_03190cztM0_level2.evt | modeM0/AS1G05_127T01_9000000436_03190cztM0_level2_quad_clean.evt |
| Size (bytes) | 615,919,680 | 75,614,400 |
| Size | 587.4 MB | 72.1 MB |
| Events in quadrant A | 3,560,715 | 448,126 |
| Events in quadrant B | 3,790,154 | 447,374 |
| Events in quadrant C | 6,926,389 | 432,890 |
| Events in quadrant D | 3,852,860 | 424,084 |
| Mode M9 | |||
|---|---|---|---|
| Quadrant | BADHDUFLAG | Total packets | Discarded packets |
| A | 0 | 3 | 0 |
| B | 0 | 3 | 0 |
| C | 0 | 3 | 0 |
| D | 0 | 3 | 0 |
| Mode SS | |||
|---|---|---|---|
| Quadrant | BADHDUFLAG | Total packets | Discarded packets |
| A | 0 | 156 | 0 |
| B | 0 | 156 | 0 |
| C | 0 | 156 | 0 |
| D | 0 | 156 | 0 |
| Mode M0 | |||
|---|---|---|---|
| Quadrant | BADHDUFLAG | Total packets | Discarded packets |
| A | 0 | 15868 | 2 |
| B | 0 | 16283 | 1 |
| C | 0 | 25829 | 1 |
| D | 0 | 16897 | 1 |
| Quadrant | Total seconds | Saturated seconds | Saturation percentage |
|---|---|---|---|
| A | 7721 | 116 | 1.502396% |
| B | 7721 | 130 | 1.683720% |
| C | 7721 | 638 | 8.263178% |
| D | 7721 | 179 | 2.318353% |
Noise dominated data is calculated using 1-second bins in cleaned event files. If a bin has >2000 counts, and if more than 50% of those come from <1% of pixels, then it is considered to be noise-dominated and hence unusable.
| Quadrant | # 1 sec bins | Bins with >0 counts | Bins with >2000 counts | High rate bins dominated by noise | Noise dominated (total time) | Noise dominated (detector-on time) | Marked lightcurve |
|---|---|---|---|---|---|---|---|
| A | 8016 | 7721 | 0 | 0 | 0.00% | 0.00% | 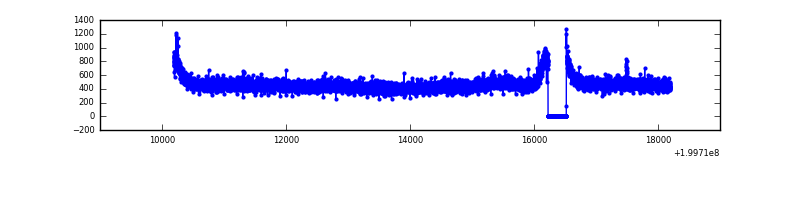 |
| B | 8016 | 7721 | 12 | 12 | 0.15% | 0.16% | 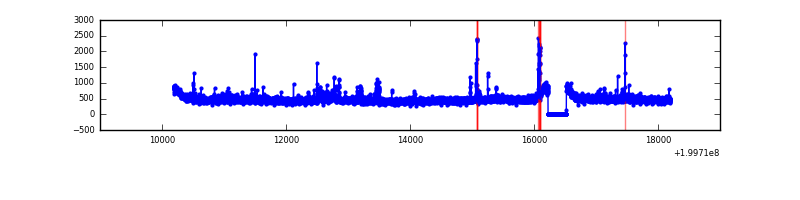 |
| C | 8016 | 7721 | 448 | 448 | 5.59% | 5.80% | 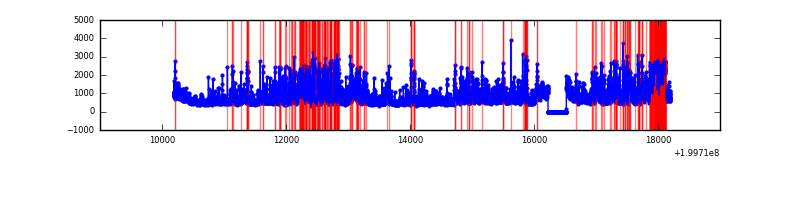 |
| D | 8016 | 7721 | 85 | 85 | 1.06% | 1.10% | 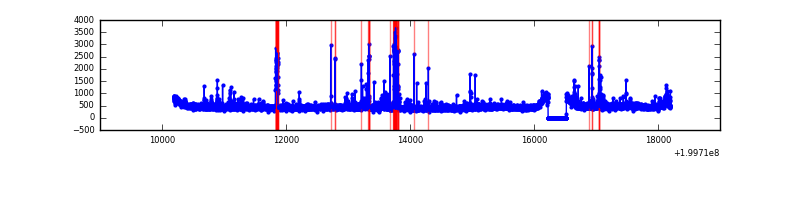 |
Top three noisy pixels from each quadrant. If the there are fewer than three noisy pixels in the level2.evt file, extra rows are filled as -1
| Pixel properties | Quadrant properties | ||||||
|---|---|---|---|---|---|---|---|
| Quadrant | DetID | PixID | Counts | Sigma | Mean | Median | Sigma |
| A | 0 | 226 | 10280 | 49.3 | 918 | 897 | 190.3 |
| A | 12 | 194 | 9957 | 47.6 | 918 | 897 | 190.3 |
| A | 5 | 113 | 9319 | 44.25 | 918 | 897 | 190.3 |
| B | 4 | 80 | 78961 | 434.49 | 928 | 911 | 179.6 |
| B | 4 | 81 | 45161 | 246.33 | 928 | 911 | 179.6 |
| B | 15 | 85 | 27155 | 146.1 | 928 | 911 | 179.6 |
| C | 12 | 206 | 3252622 | 16115.37 | 861 | 865 | 201.8 |
| C | 14 | 223 | 138726 | 683.22 | 861 | 865 | 201.8 |
| C | 1 | 192 | 49754 | 242.29 | 861 | 865 | 201.8 |
| D | 13 | 223 | 203041 | 935.98 | 884 | 854 | 216.0 |
| D | 5 | 233 | 141961 | 653.22 | 884 | 854 | 216.0 |
| D | 13 | 120 | 42102 | 190.95 | 884 | 854 | 216.0 |
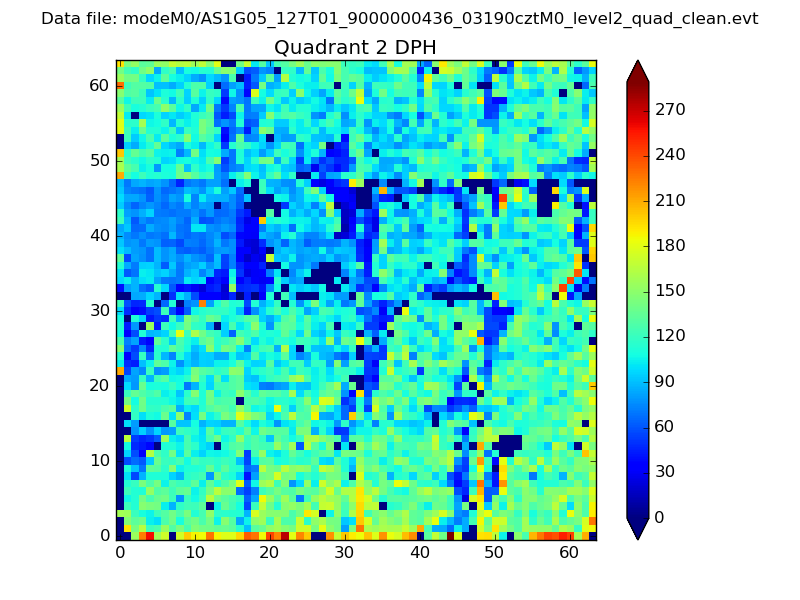
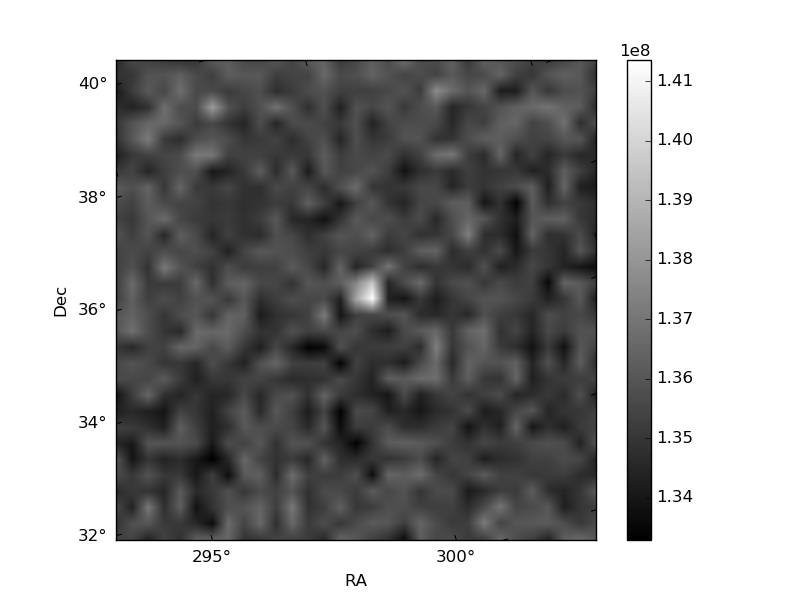
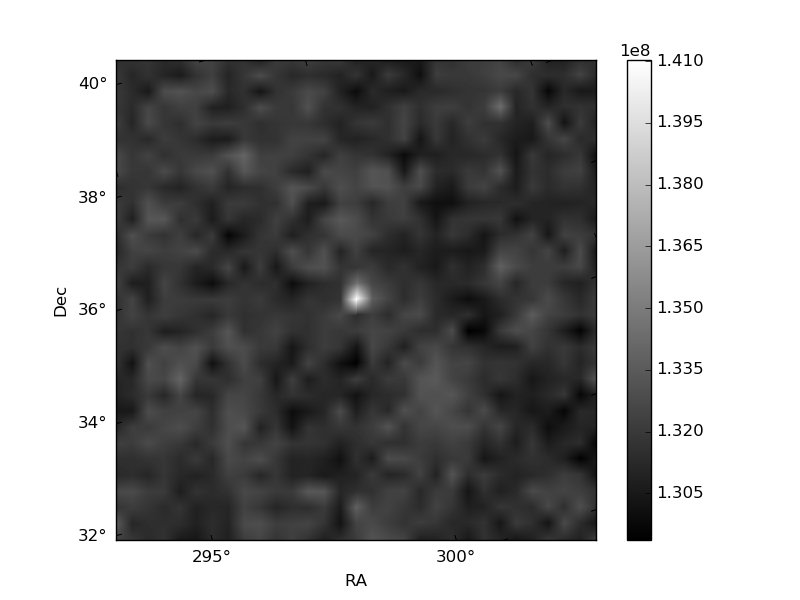
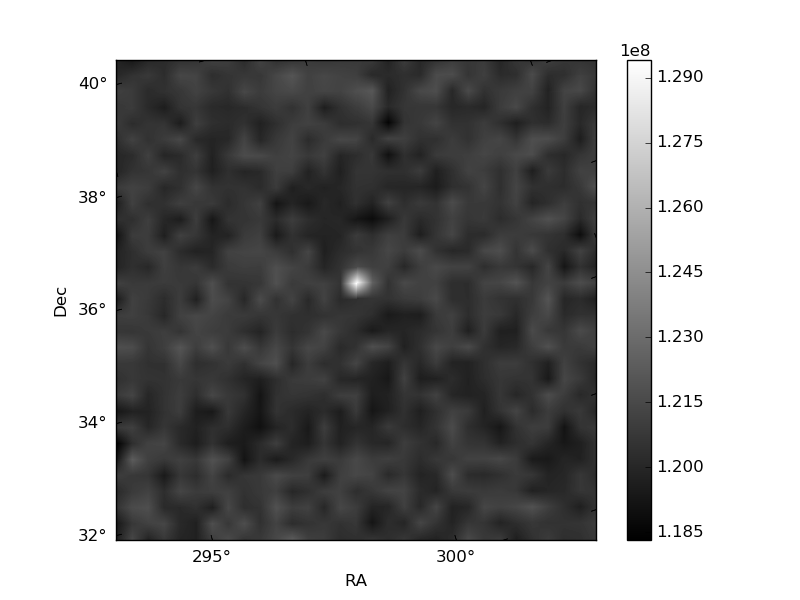
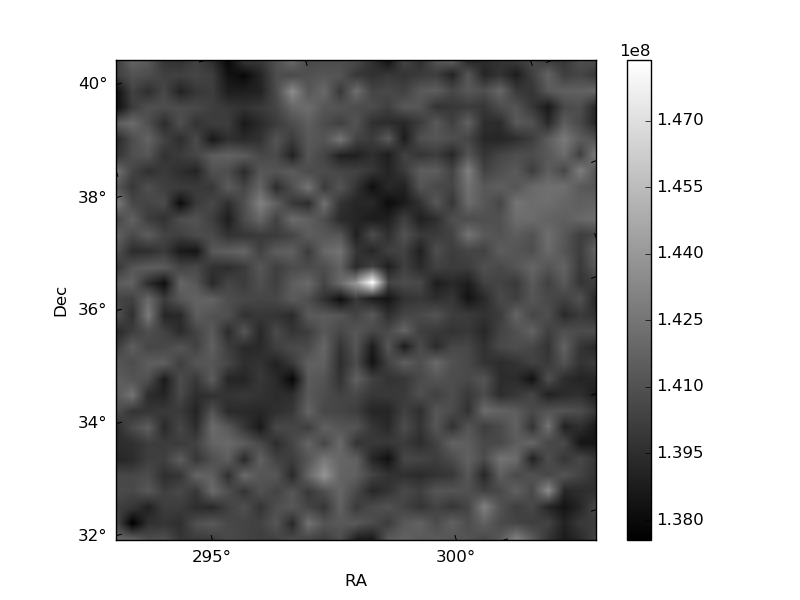
Histogram calculated using DETX and DETY for each event in the final _common_clean file
| Quadrant A | 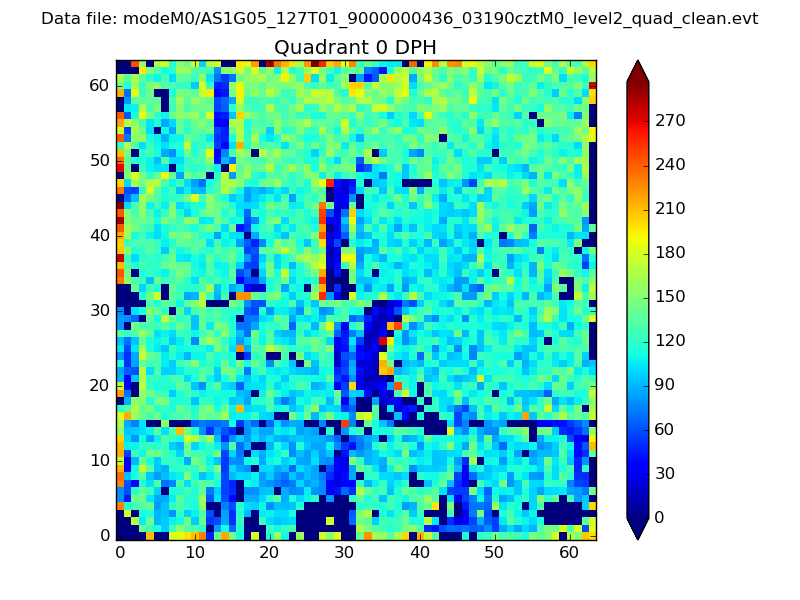 |
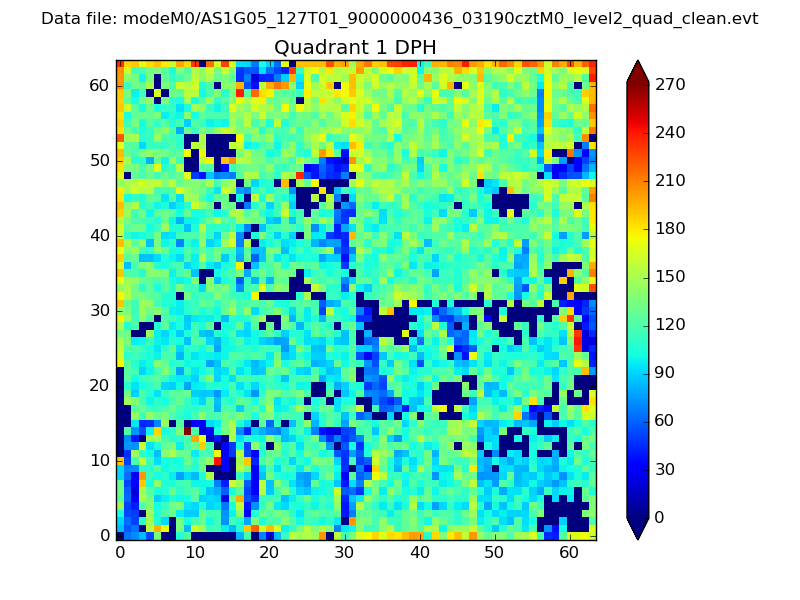 |
Quadrant B |
|---|---|---|---|
| Quadrant D | 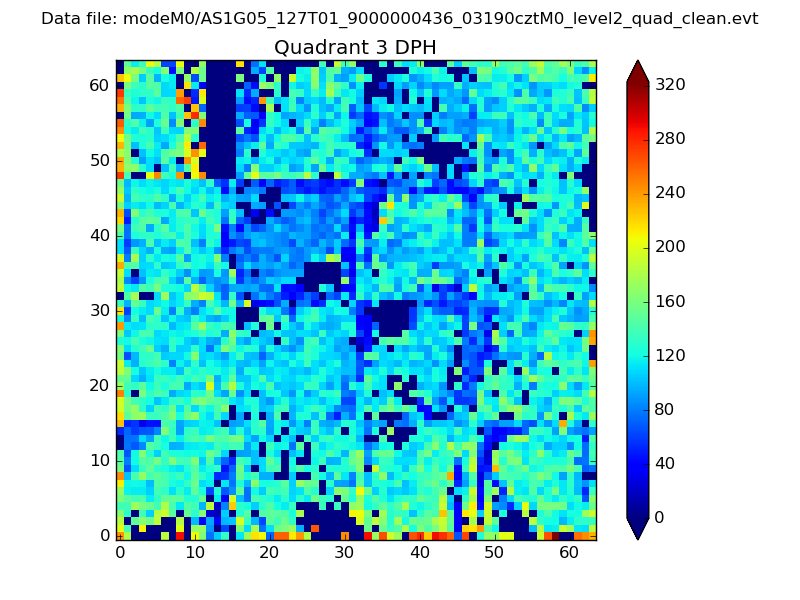 |
 |
Quadrant C |
| Plot type | Count rate plots | Images |
|---|---|---|
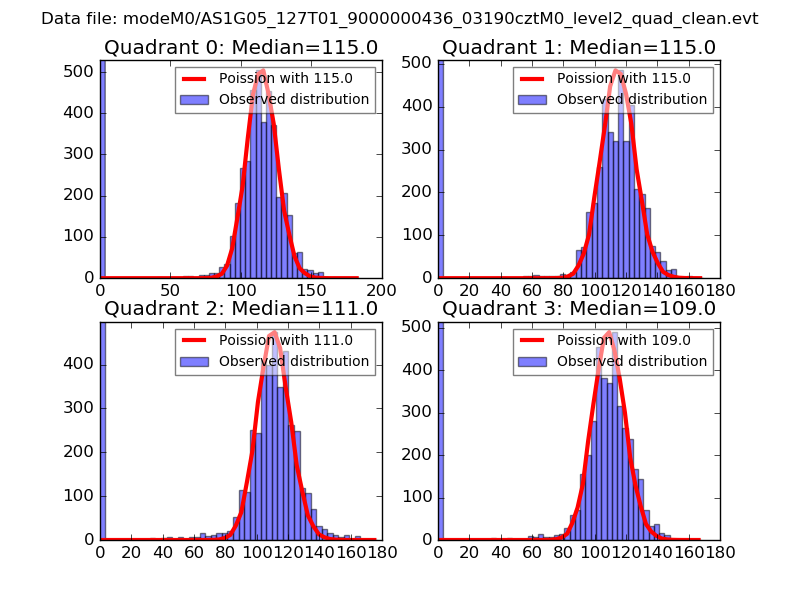
| Comparison with Poisson distribution Blue bars denote a histogram of data divided into 1 sec bins. Red curve is a Poisson curve with rate = median count rate of data. |
 |
 |
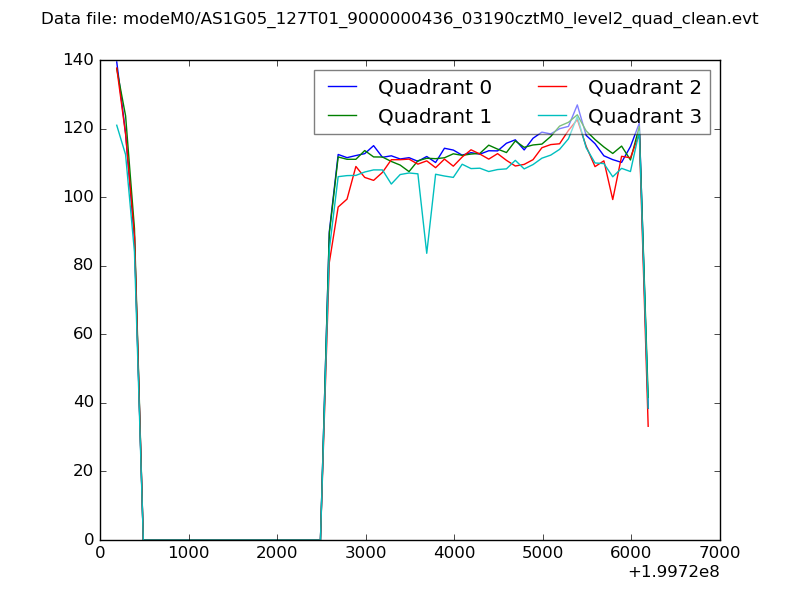
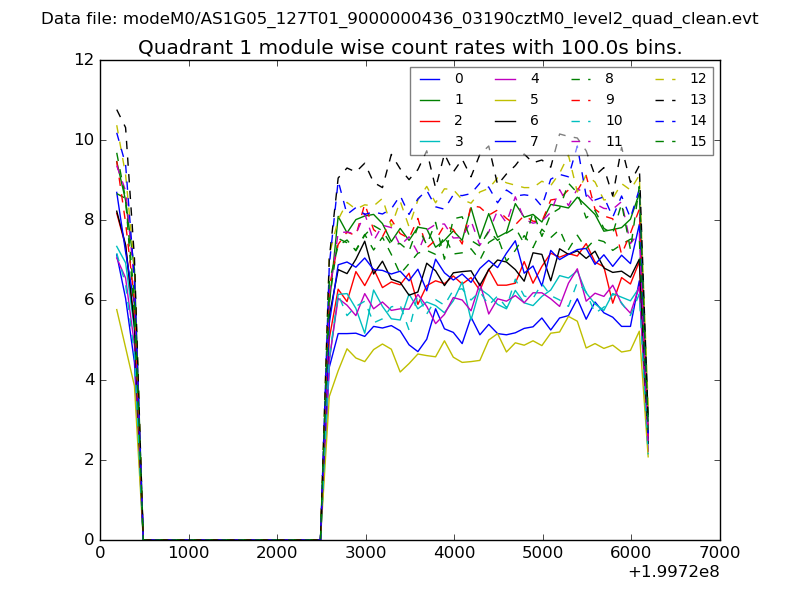
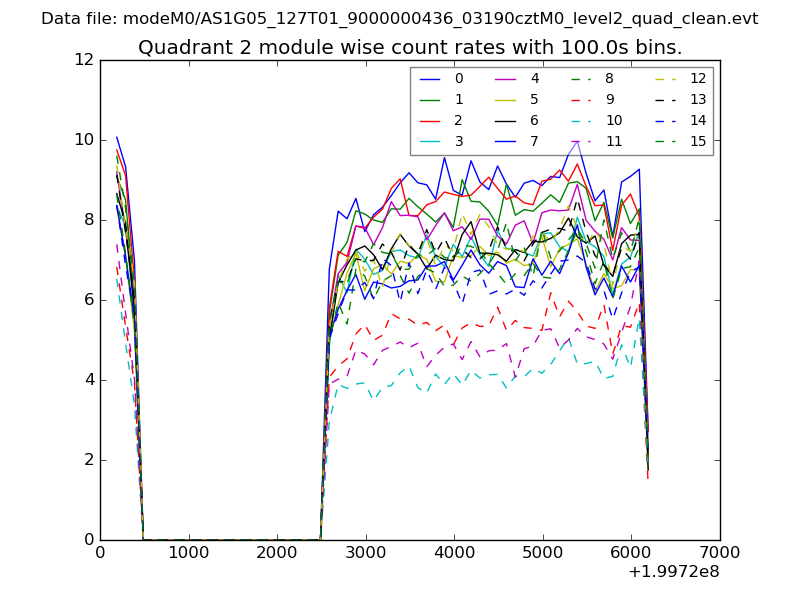
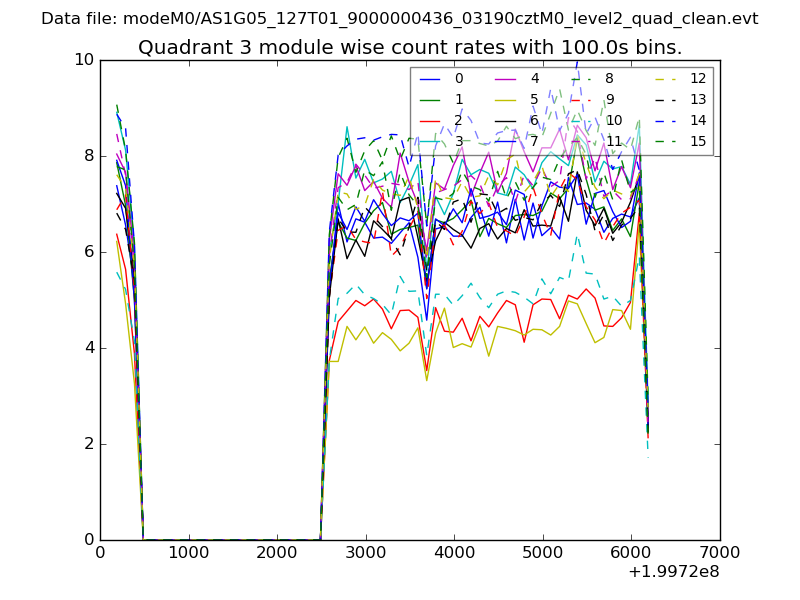
| Quadrant-wise count rates Data is divided into 100 sec bins |
 |
|
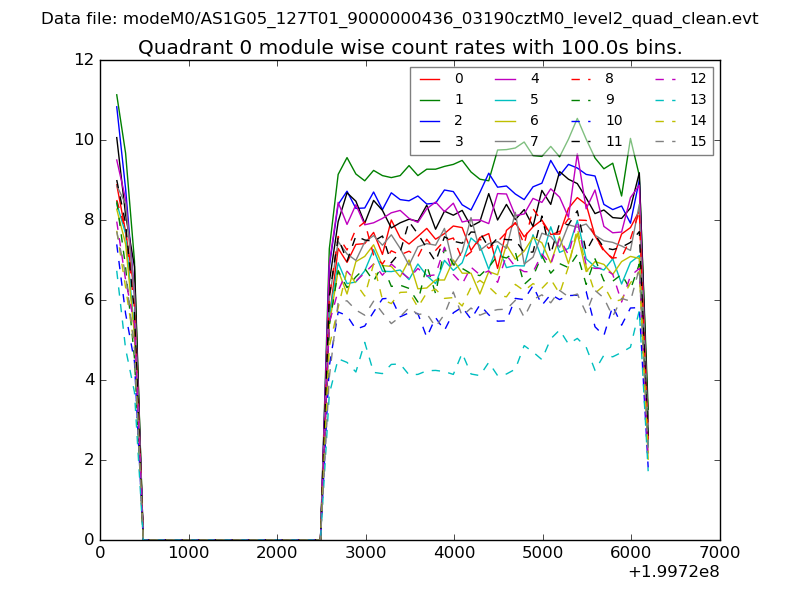
| Module-wise count rates for Quadrant A Data is divided into 100 sec bins |
 |
 |
| Module-wise count rates for Quadrant B Data is divided into 100 sec bins |
 |
 |
| Module-wise count rates for Quadrant C Data is divided into 100 sec bins |
 |
 |
| Module-wise count rates for Quadrant D Data is divided into 100 sec bins |
 |
 |
| Parameter | Plot |
|---|---|
| CZT HV Monitor | 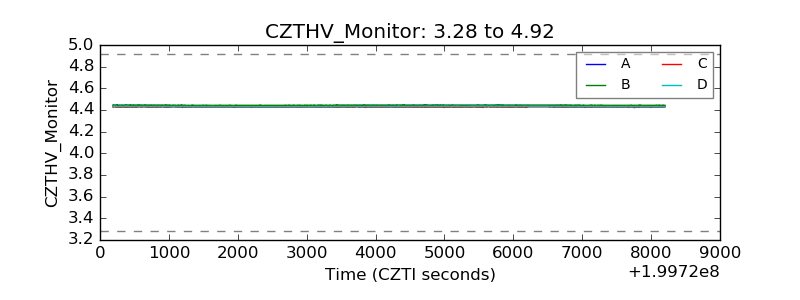 |
| D_VDD | 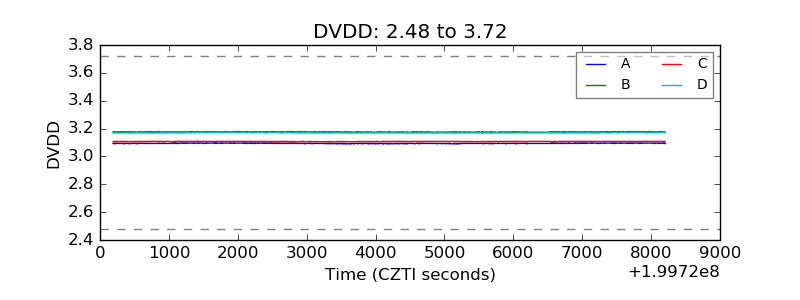 |
| Temperature 1 | 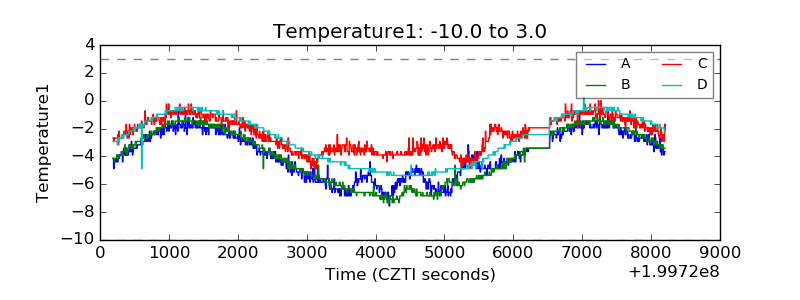 |
| Veto HV Monitor | 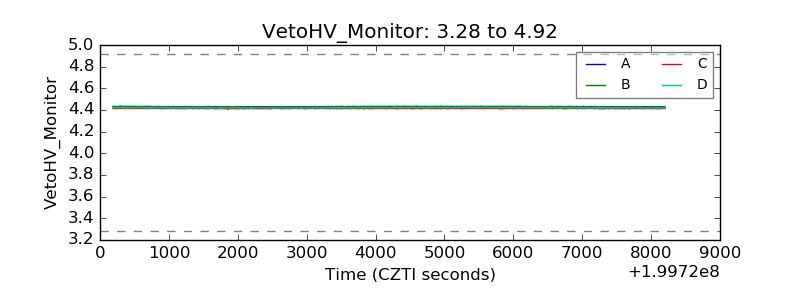 |
| Veto LLD | 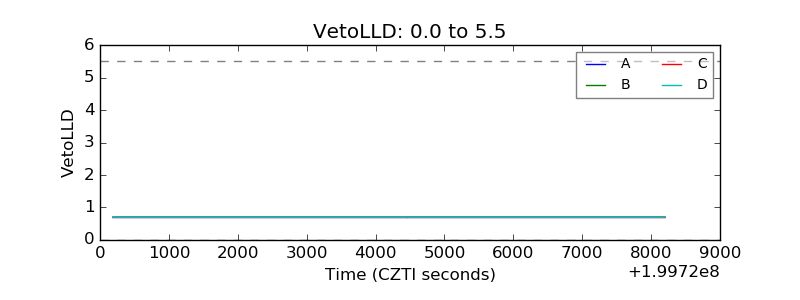 |
| Alpha Counter | 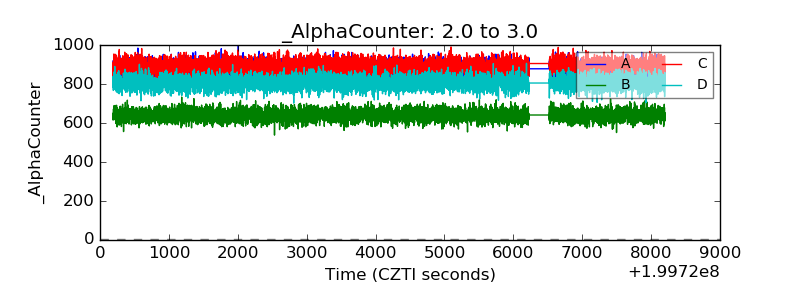 |
| _CPM_Rate | 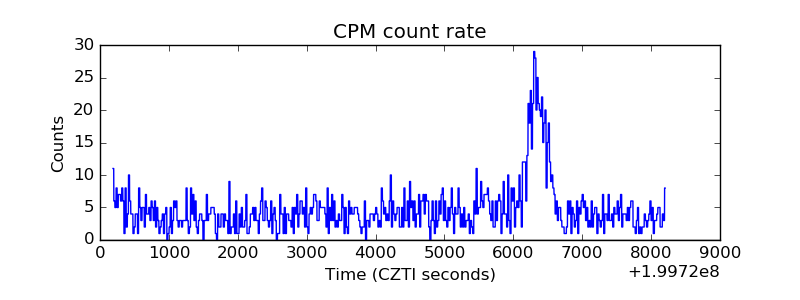 |
| CZT Counter | 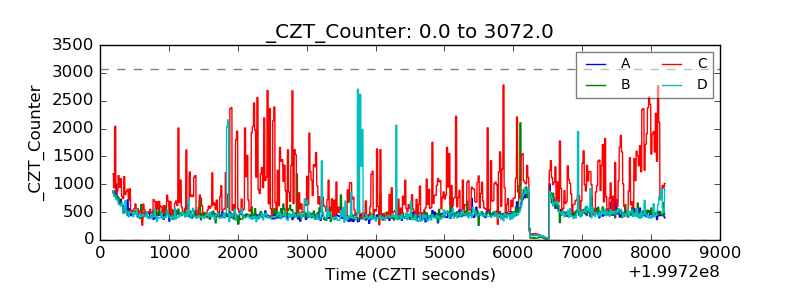 |
| +2.5 Volts monitor |  |
| +5 Volts monitor |  |
| _ROLL_ROT | 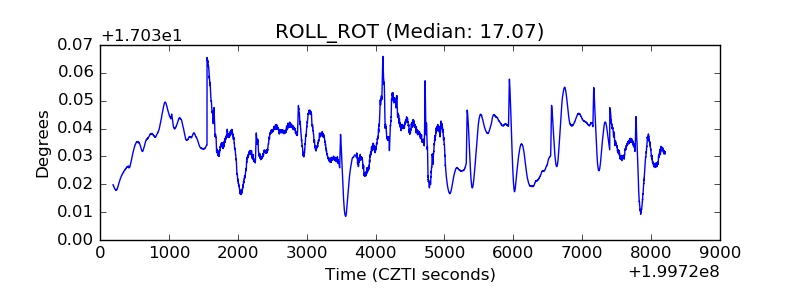 |
| _Roll_DEC | 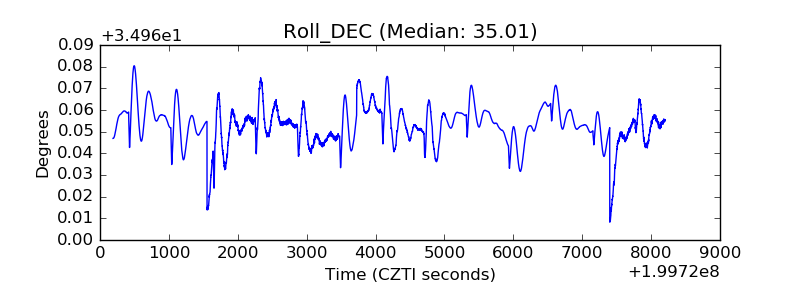 |
| _Roll_RA | 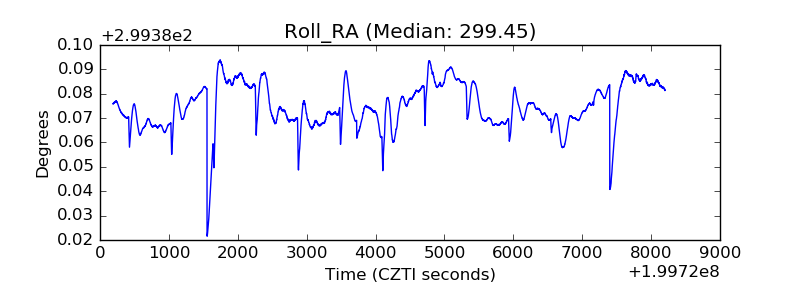 |
| Veto Counter | 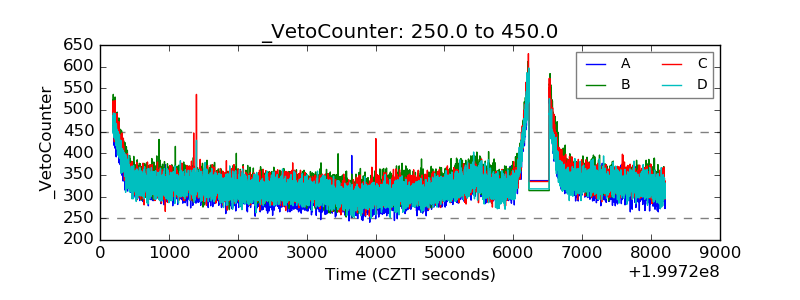 |