| Param | Original file | Final file |
|---|---|---|
| Filename | modeM0/AS1G05_127T01_9000000436_03194cztM0_level2.evt | modeM0/AS1G05_127T01_9000000436_03194cztM0_level2_quad_clean.evt |
| Size (bytes) | 728,922,240 | 86,639,040 |
| Size | 695.2 MB | 82.6 MB |
| Events in quadrant A | 3,032,140 | 575,198 |
| Events in quadrant B | 3,368,817 | 575,170 |
| Events in quadrant C | 11,712,902 | 464,823 |
| Events in quadrant D | 3,516,965 | 548,971 |
| Mode M9 | |||
|---|---|---|---|
| Quadrant | BADHDUFLAG | Total packets | Discarded packets |
| A | 0 | 10 | 0 |
| B | 0 | 10 | 0 |
| C | 0 | 10 | 0 |
| D | 0 | 10 | 0 |
| Mode SS | |||
|---|---|---|---|
| Quadrant | BADHDUFLAG | Total packets | Discarded packets |
| A | 0 | 132 | 0 |
| B | 0 | 132 | 0 |
| C | 0 | 132 | 0 |
| D | 0 | 132 | 0 |
| Mode M0 | |||
|---|---|---|---|
| Quadrant | BADHDUFLAG | Total packets | Discarded packets |
| A | 0 | 13548 | 2 |
| B | 0 | 14578 | 1 |
| C | 0 | 39339 | 1 |
| D | 0 | 15120 | 1 |
| Quadrant | Total seconds | Saturated seconds | Saturation percentage |
|---|---|---|---|
| A | 6582 | 17 | 0.258280% |
| B | 6582 | 75 | 1.139471% |
| C | 6582 | 2828 | 42.965664% |
| D | 6582 | 81 | 1.230629% |
Noise dominated data is calculated using 1-second bins in cleaned event files. If a bin has >2000 counts, and if more than 50% of those come from <1% of pixels, then it is considered to be noise-dominated and hence unusable.
| Quadrant | # 1 sec bins | Bins with >0 counts | Bins with >2000 counts | High rate bins dominated by noise | Noise dominated (total time) | Noise dominated (detector-on time) | Marked lightcurve |
|---|---|---|---|---|---|---|---|
| A | 7592 | 6583 | 5 | 5 | 0.07% | 0.08% | 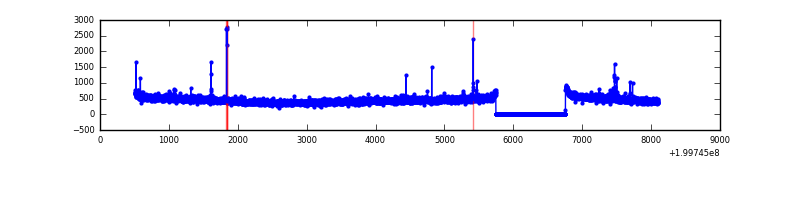 |
| B | 7592 | 6582 | 15 | 15 | 0.20% | 0.23% | 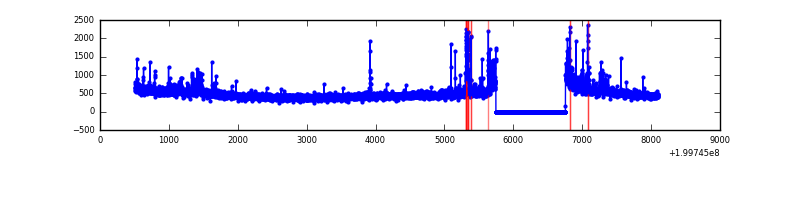 |
| C | 7591 | 6581 | 2844 | 2844 | 37.47% | 43.22% | 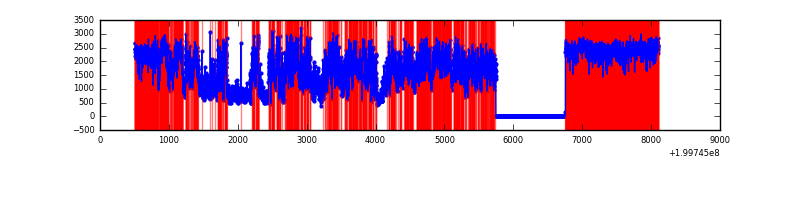 |
| D | 7592 | 6583 | 76 | 76 | 1.00% | 1.15% | 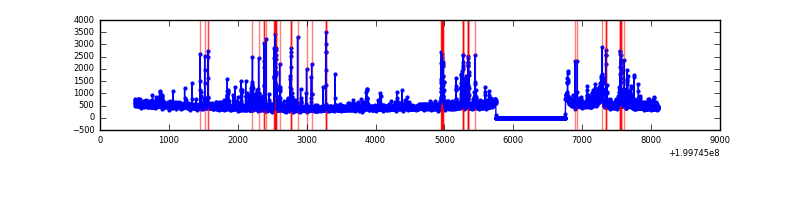 |
Top three noisy pixels from each quadrant. If the there are fewer than three noisy pixels in the level2.evt file, extra rows are filled as -1
| Pixel properties | Quadrant properties | ||||||
|---|---|---|---|---|---|---|---|
| Quadrant | DetID | PixID | Counts | Sigma | Mean | Median | Sigma |
| A | 0 | 118 | 33393 | 206.62 | 774 | 759 | 157.9 |
| A | 0 | 226 | 11759 | 69.65 | 774 | 759 | 157.9 |
| A | 12 | 194 | 8142 | 46.74 | 774 | 759 | 157.9 |
| B | 4 | 80 | 233392 | 1538.97 | 786 | 768 | 151.2 |
| B | 15 | 54 | 16678 | 105.26 | 786 | 768 | 151.2 |
| B | 0 | 231 | 12065 | 74.74 | 786 | 768 | 151.2 |
| C | 12 | 206 | 8714975 | 59058.8 | 637 | 643 | 147.6 |
| C | 1 | 192 | 406222 | 2748.69 | 637 | 643 | 147.6 |
| C | 6 | 80 | 49074 | 328.23 | 637 | 643 | 147.6 |
| D | 13 | 223 | 162348 | 889.59 | 747 | 726 | 181.7 |
| D | 12 | 233 | 145542 | 797.09 | 747 | 726 | 181.7 |
| D | 5 | 233 | 97177 | 530.88 | 747 | 726 | 181.7 |
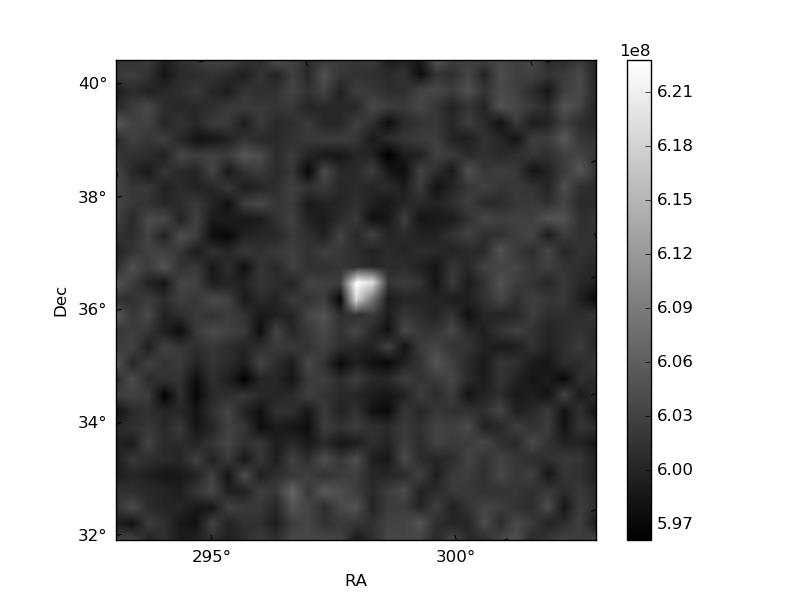
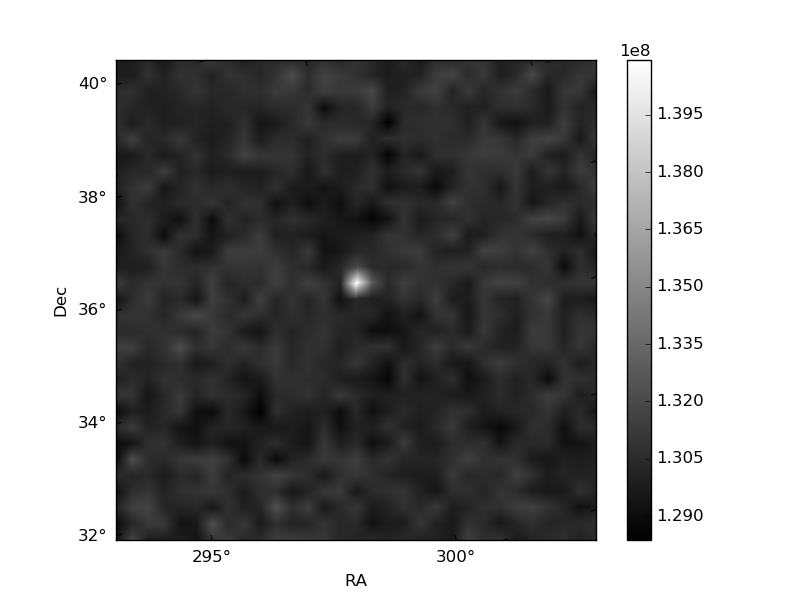
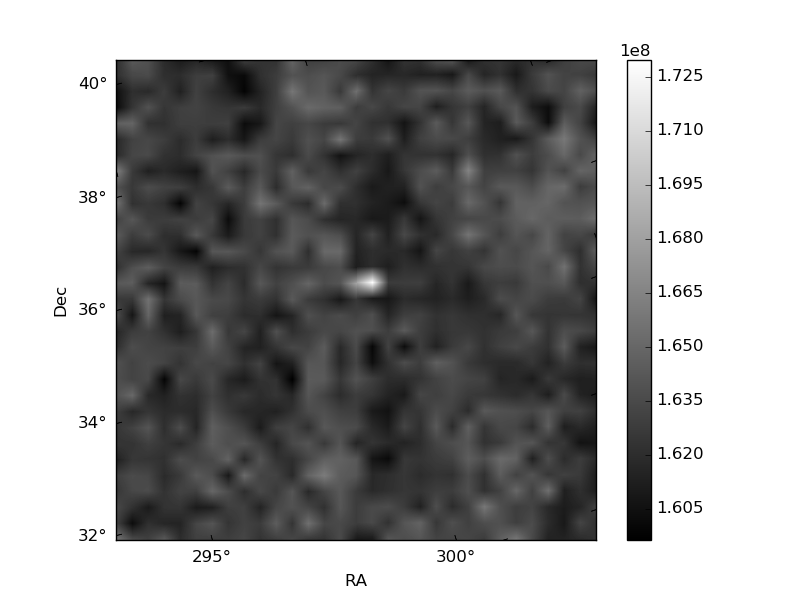
Histogram calculated using DETX and DETY for each event in the final _common_clean file
| Quadrant A | 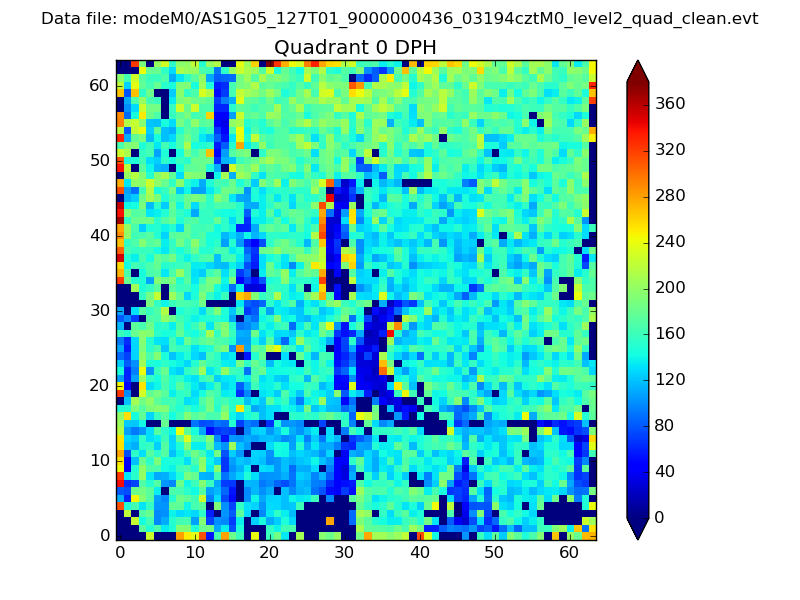 |
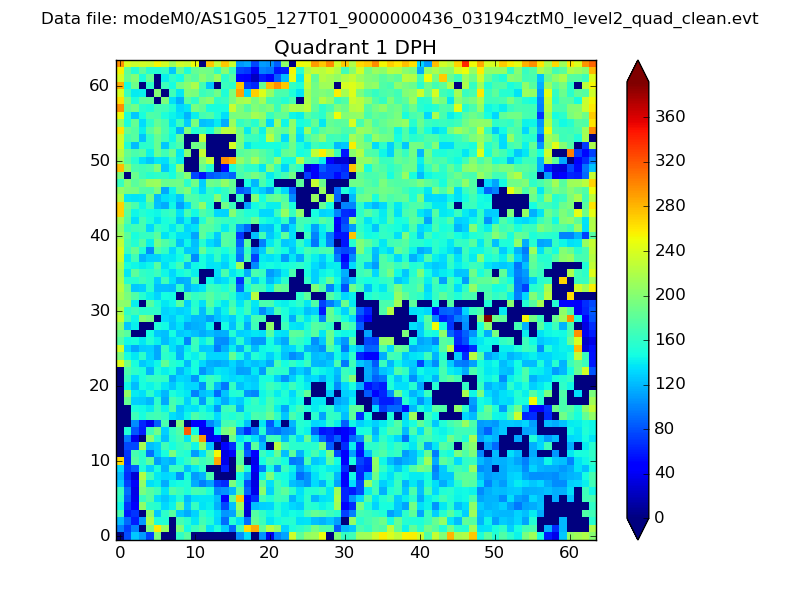 |
Quadrant B |
|---|---|---|---|
| Quadrant D | 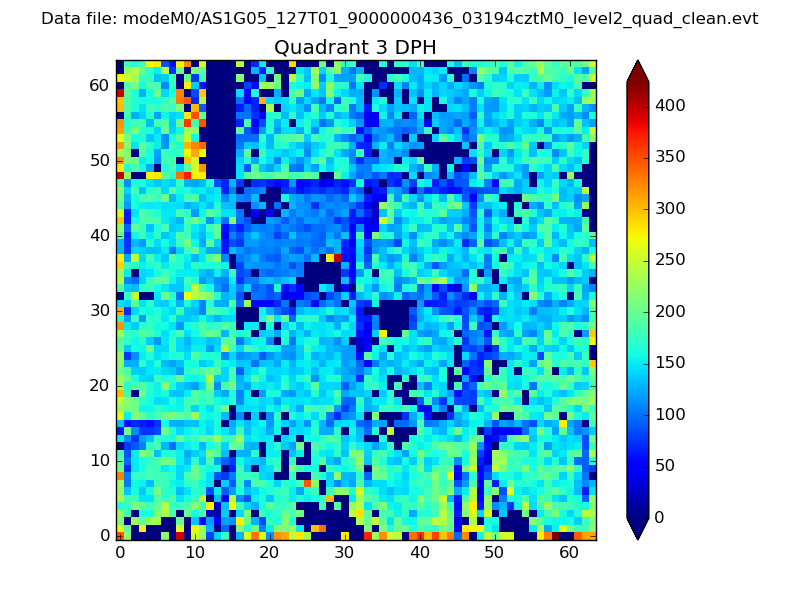 |
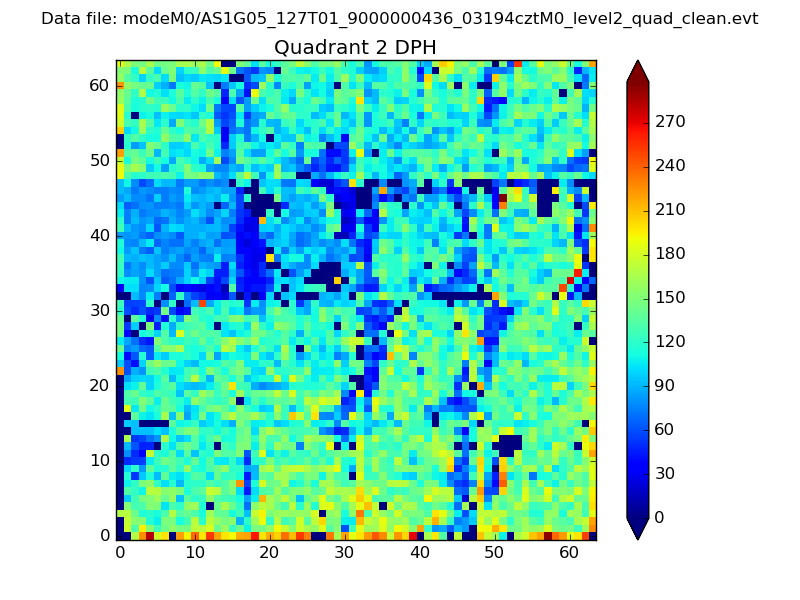 |
Quadrant C |
| Plot type | Count rate plots | Images |
|---|---|---|
| Comparison with Poisson distribution Blue bars denote a histogram of data divided into 1 sec bins. Red curve is a Poisson curve with rate = median count rate of data. |
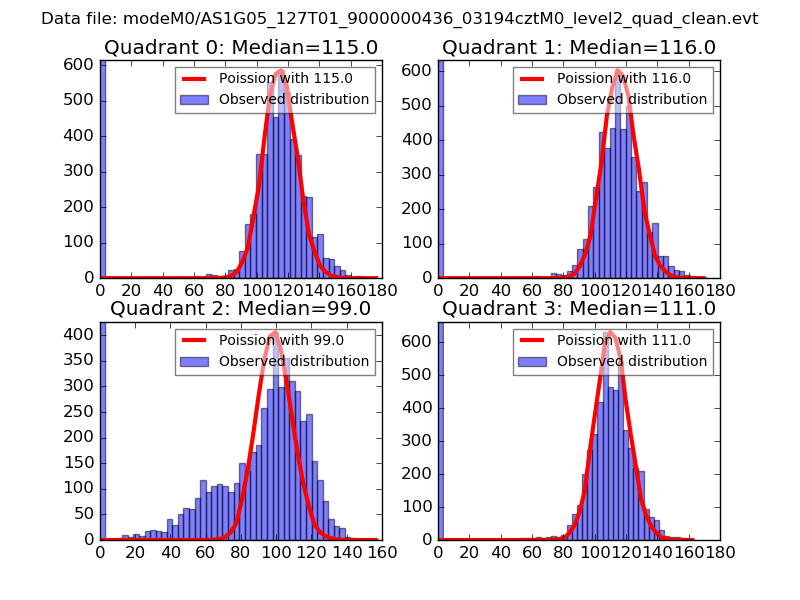 |
 |
| Quadrant-wise count rates Data is divided into 100 sec bins |
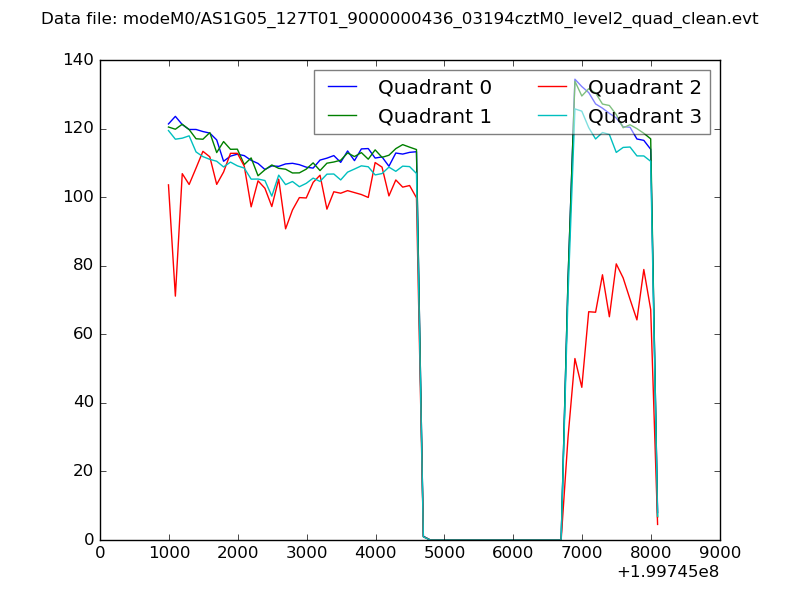 |
|
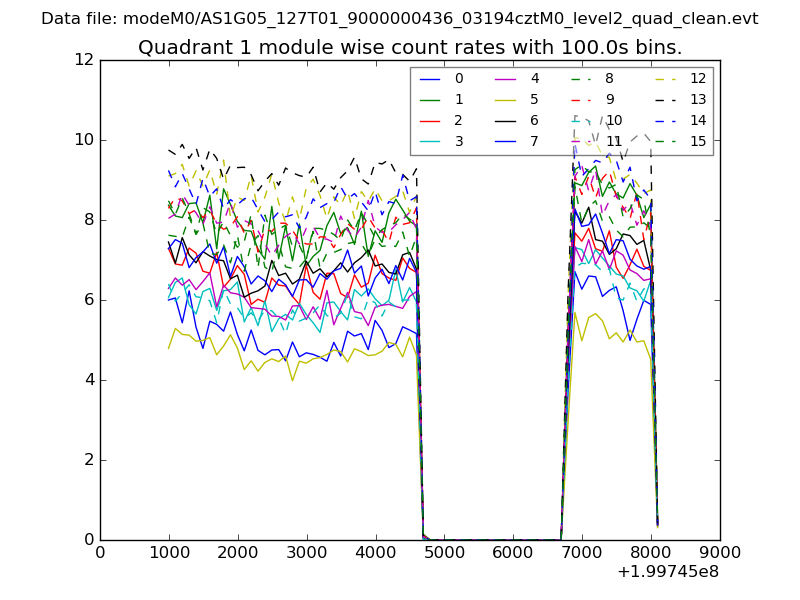
| Module-wise count rates for Quadrant A Data is divided into 100 sec bins |
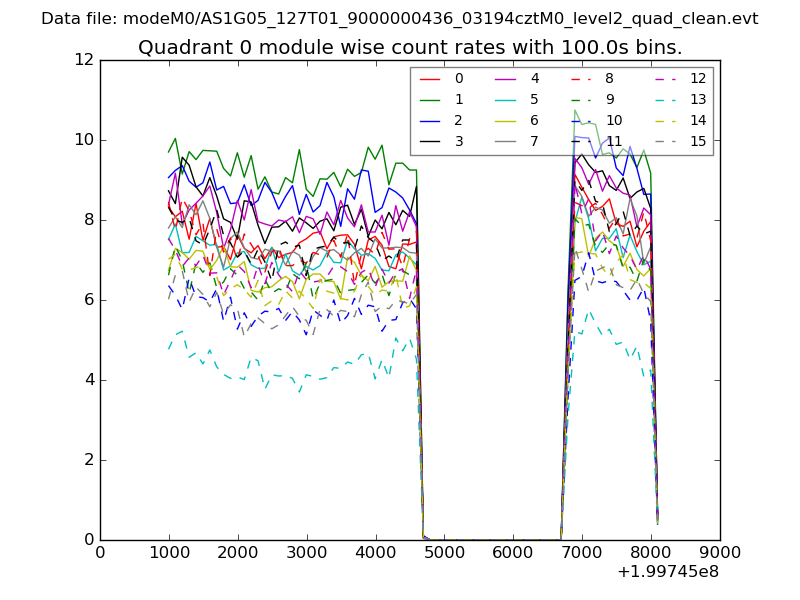 |
 |
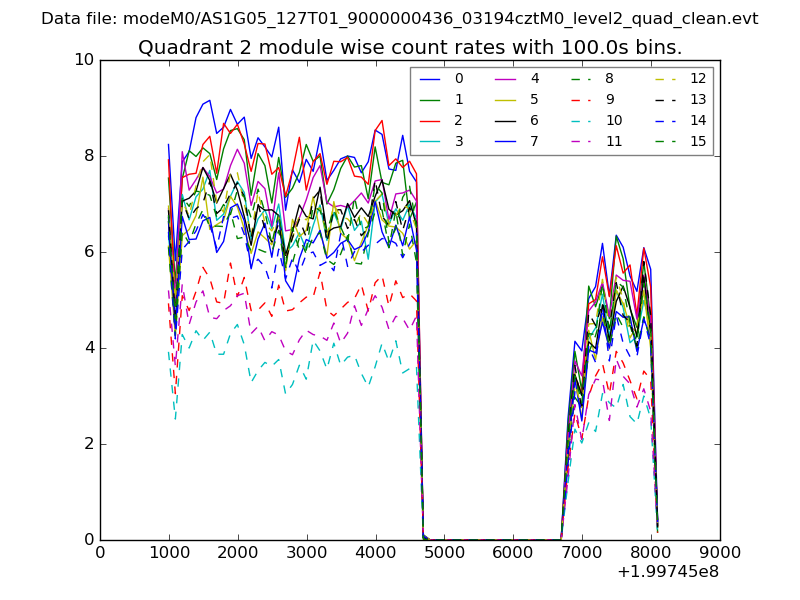
| Module-wise count rates for Quadrant B Data is divided into 100 sec bins |
 |
 |
| Module-wise count rates for Quadrant C Data is divided into 100 sec bins |
 |
 |
| Module-wise count rates for Quadrant D Data is divided into 100 sec bins |
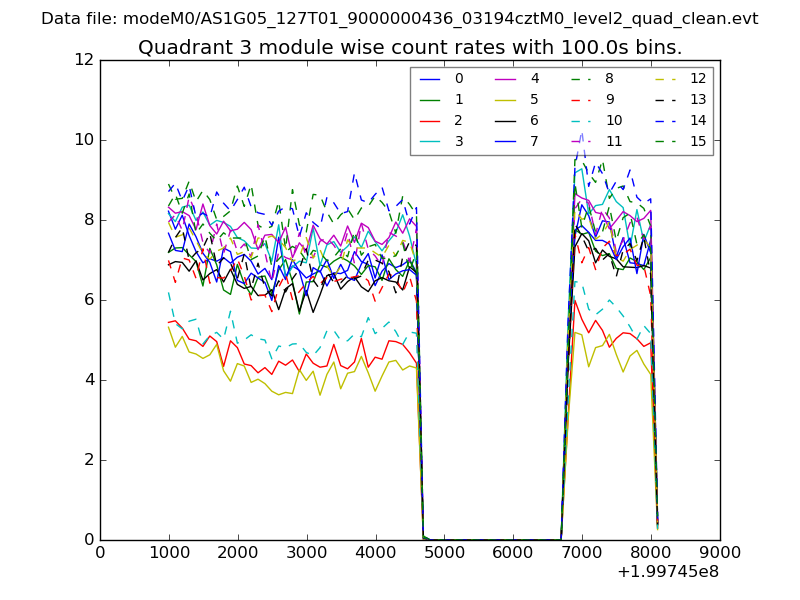 |
 |
| Parameter | Plot |
|---|---|
| CZT HV Monitor | 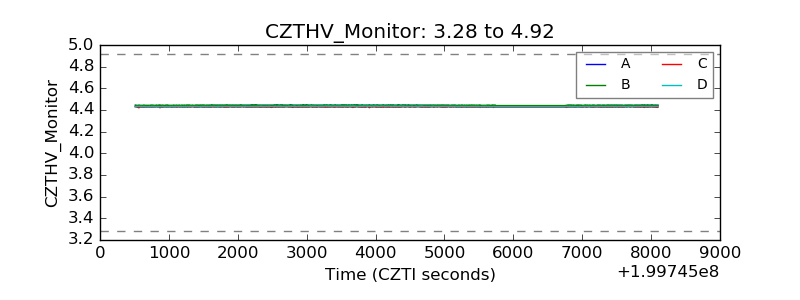 |
| D_VDD | 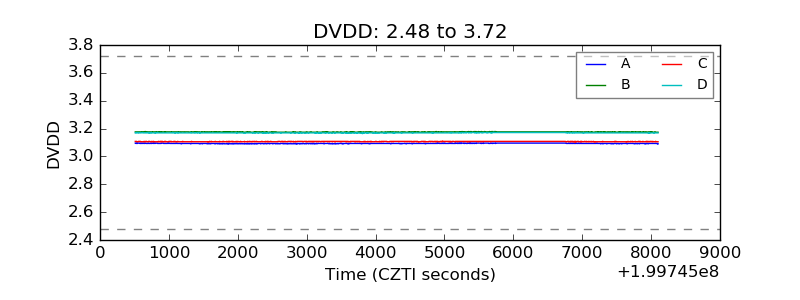 |
| Temperature 1 | 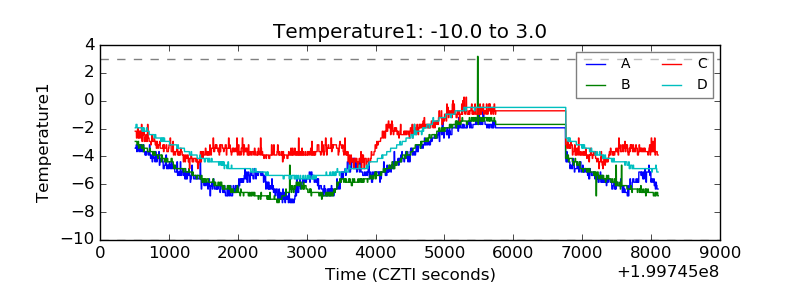 |
| Veto HV Monitor | 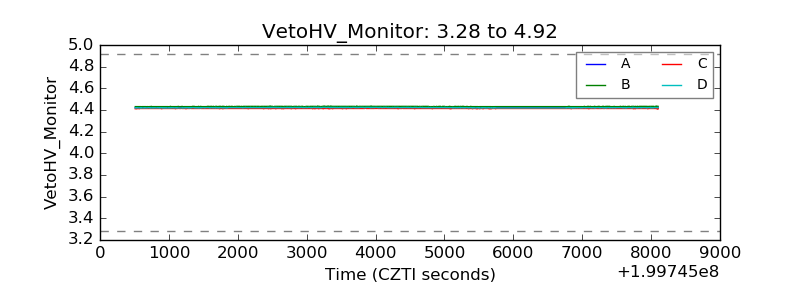 |
| Veto LLD | 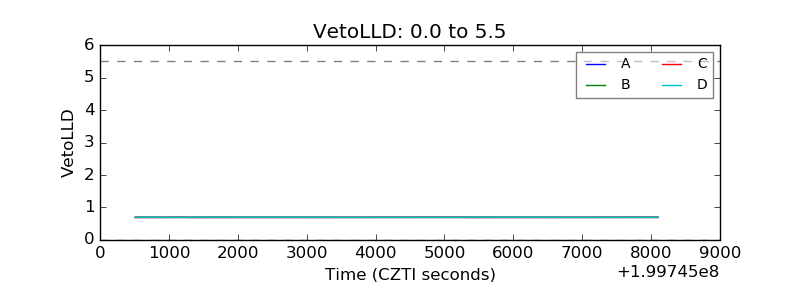 |
| Alpha Counter | 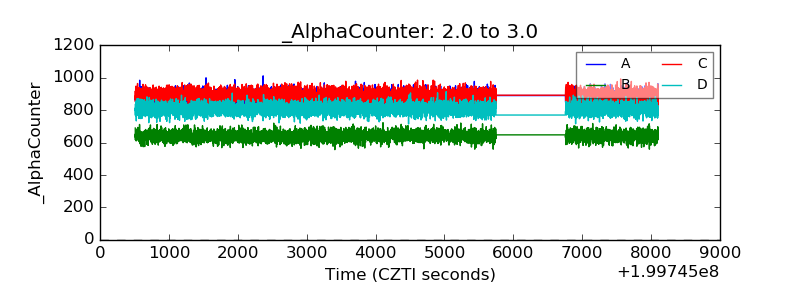 |
| _CPM_Rate | 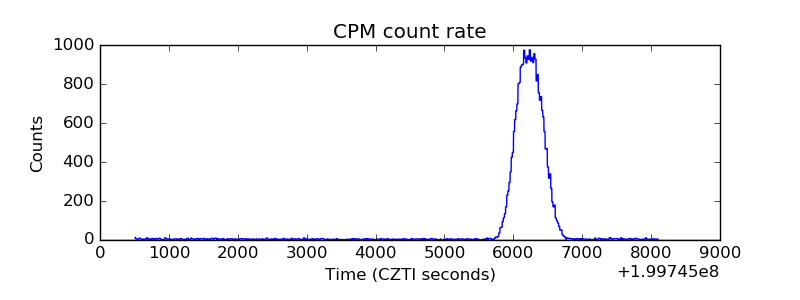 |
| CZT Counter | 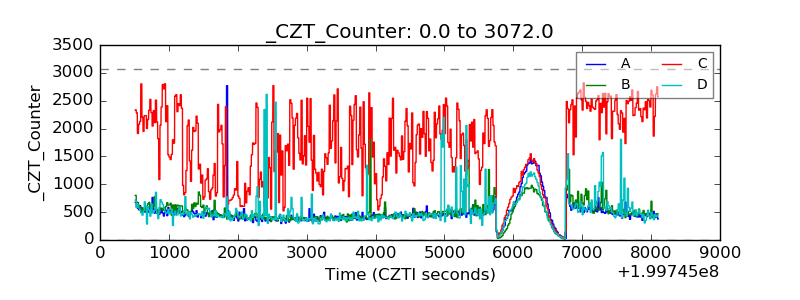 |
| +2.5 Volts monitor | 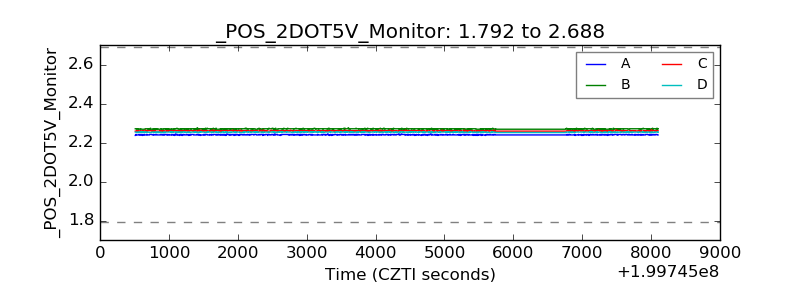 |
| +5 Volts monitor | 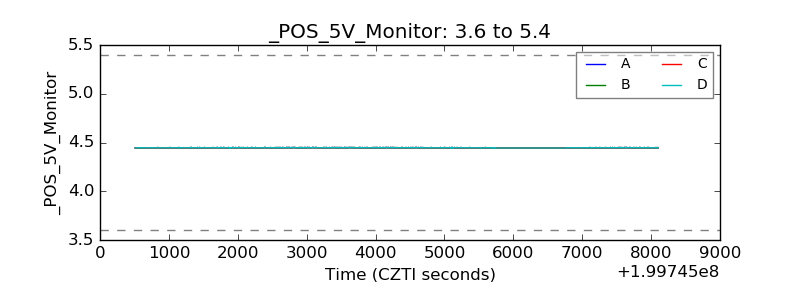 |
| Veto Counter | 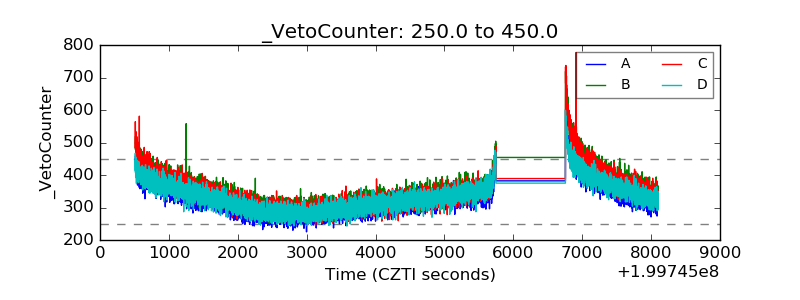 |