| Param | Original file | Final file |
|---|---|---|
| Filename | modeM0/AS1G05_127T01_9000000436_03198cztM0_level2.evt | modeM0/AS1G05_127T01_9000000436_03198cztM0_level2_quad_clean.evt |
| Size (bytes) | 104,549,760 | 24,209,280 |
| Size | 99.7 MB | 23.1 MB |
| Events in quadrant A | 582,996 | 162,828 |
| Events in quadrant B | 618,574 | 166,421 |
| Events in quadrant C | 1,157,014 | 157,212 |
| Events in quadrant D | 720,857 | 153,030 |
| Mode SS | |||
|---|---|---|---|
| Quadrant | BADHDUFLAG | Total packets | Discarded packets |
| A | 0 | 26 | 0 |
| B | 0 | 26 | 0 |
| C | 0 | 26 | 0 |
| D | 0 | 26 | 0 |
| Mode M0 | |||
|---|---|---|---|
| Quadrant | BADHDUFLAG | Total packets | Discarded packets |
| A | 0 | 2511 | 1 |
| B | 0 | 2595 | 1 |
| C | 0 | 4346 | 1 |
| D | 0 | 3014 | 1 |
| Quadrant | Total seconds | Saturated seconds | Saturation percentage |
|---|---|---|---|
| A | 1232 | 0 | 0.000000% |
| B | 1232 | 3 | 0.243506% |
| C | 1232 | 35 | 2.840909% |
| D | 1232 | 27 | 2.191558% |
Noise dominated data is calculated using 1-second bins in cleaned event files. If a bin has >2000 counts, and if more than 50% of those come from <1% of pixels, then it is considered to be noise-dominated and hence unusable.
| Quadrant | # 1 sec bins | Bins with >0 counts | Bins with >2000 counts | High rate bins dominated by noise | Noise dominated (total time) | Noise dominated (detector-on time) | Marked lightcurve |
|---|---|---|---|---|---|---|---|
| A | 1232 | 1232 | 0 | 0 | 0.00% | 0.00% |  |
| B | 1232 | 1232 | 0 | 0 | 0.00% | 0.00% |  |
| C | 1232 | 1232 | 36 | 36 | 2.92% | 2.92% |  |
| D | 1232 | 1232 | 29 | 29 | 2.35% | 2.35% | 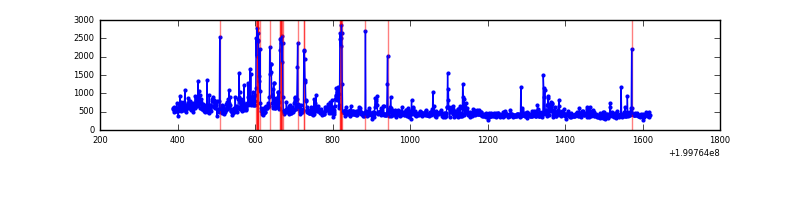 |
Top three noisy pixels from each quadrant. If the there are fewer than three noisy pixels in the level2.evt file, extra rows are filled as -1
| Pixel properties | Quadrant properties | ||||||
|---|---|---|---|---|---|---|---|
| Quadrant | DetID | PixID | Counts | Sigma | Mean | Median | Sigma |
| A | 3 | 1 | 3443 | 103.92 | 149 | 147 | 31.7 |
| A | 0 | 31 | 2948 | 88.32 | 149 | 147 | 31.7 |
| A | 13 | 14 | 1888 | 54.89 | 149 | 147 | 31.7 |
| B | 5 | 70 | 9855 | 309.36 | 156 | 152 | 31.4 |
| B | 0 | 229 | 4943 | 152.75 | 156 | 152 | 31.4 |
| B | 5 | 184 | 1905 | 55.89 | 156 | 152 | 31.4 |
| C | 12 | 206 | 413978 | 11568.57 | 146 | 147 | 35.8 |
| C | 14 | 223 | 152732 | 4265.49 | 146 | 147 | 35.8 |
| C | 8 | 128 | 6334 | 172.96 | 146 | 147 | 35.8 |
| D | 13 | 223 | 90833 | 2314.42 | 141 | 138 | 39.2 |
| D | 13 | 120 | 38820 | 987.12 | 141 | 138 | 39.2 |
| D | 5 | 233 | 29808 | 757.14 | 141 | 138 | 39.2 |
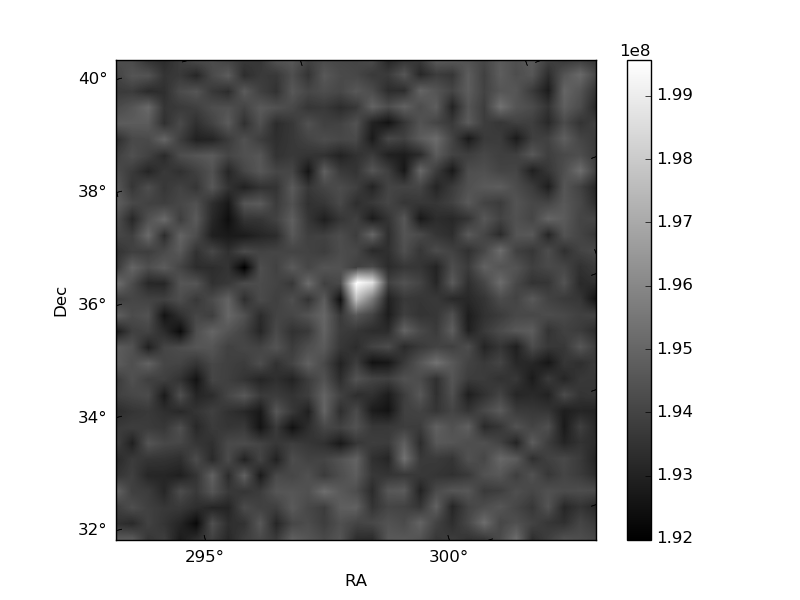
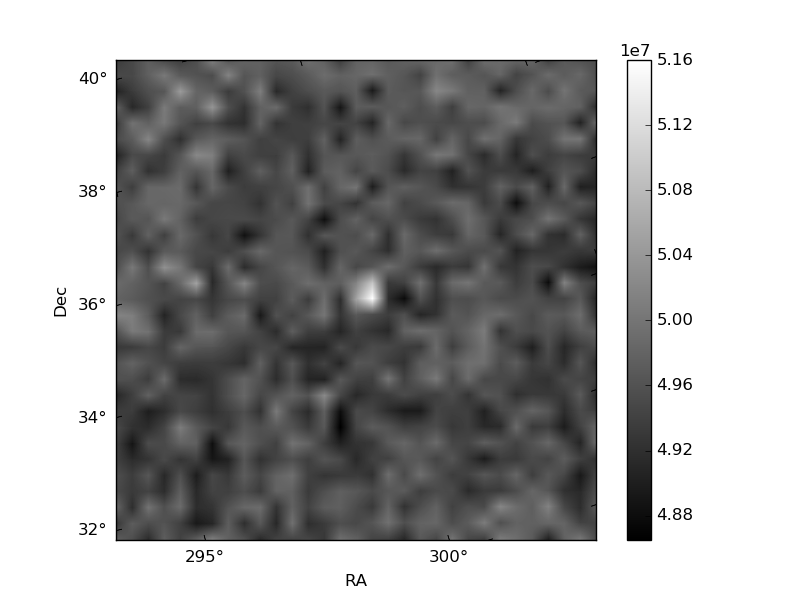
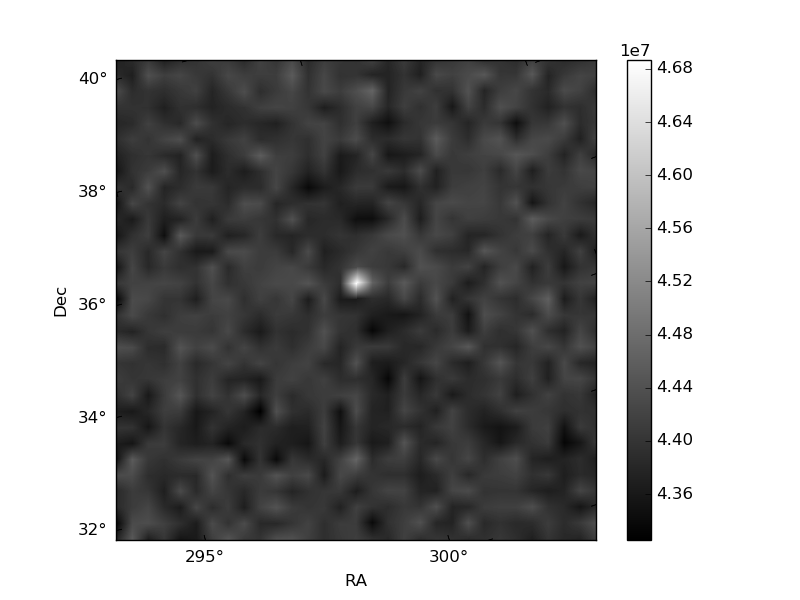
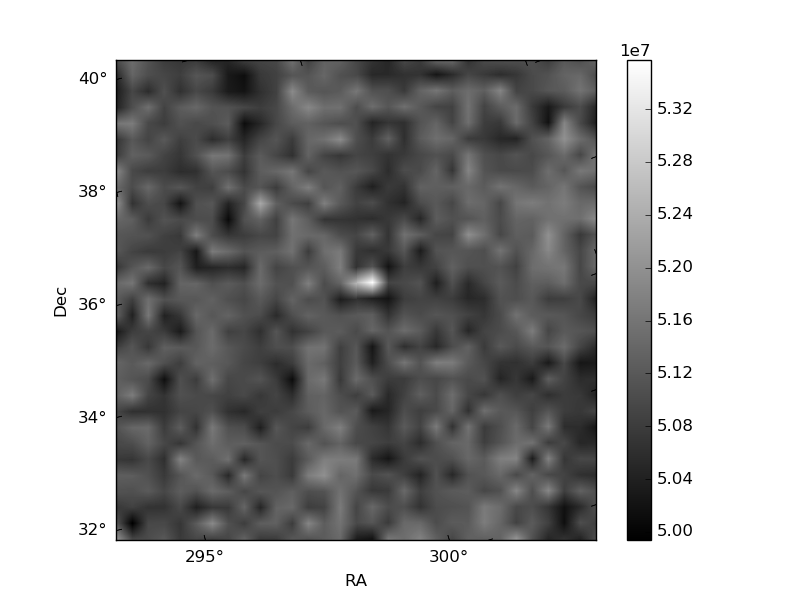
Histogram calculated using DETX and DETY for each event in the final _common_clean file
| Quadrant A | 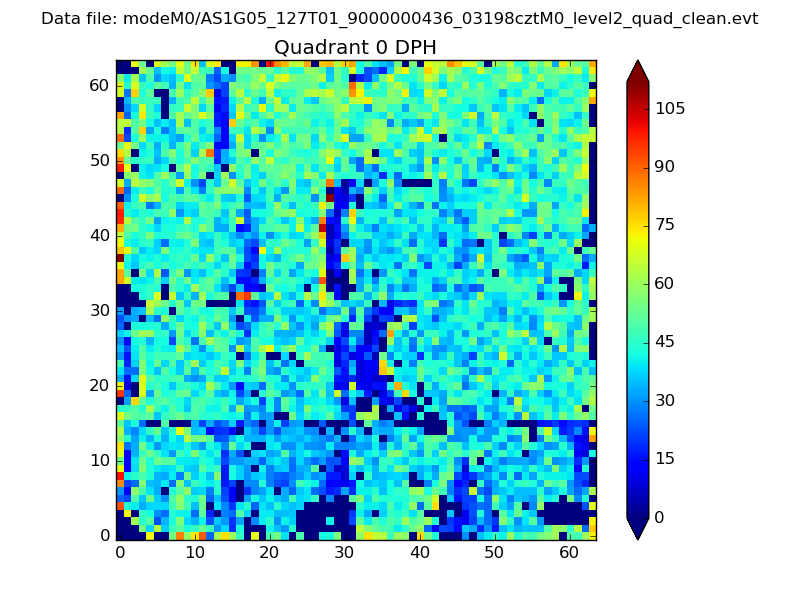 |
 |
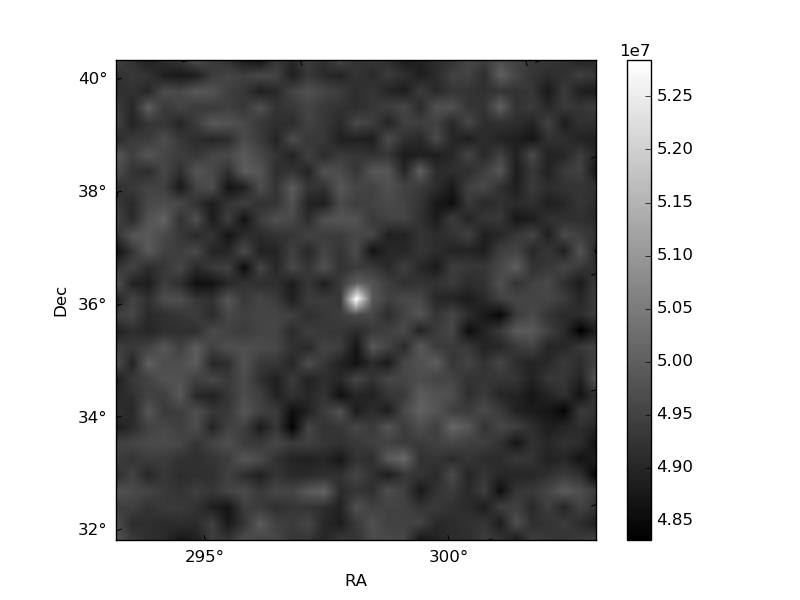
Quadrant B |
|---|---|---|---|
| Quadrant D | 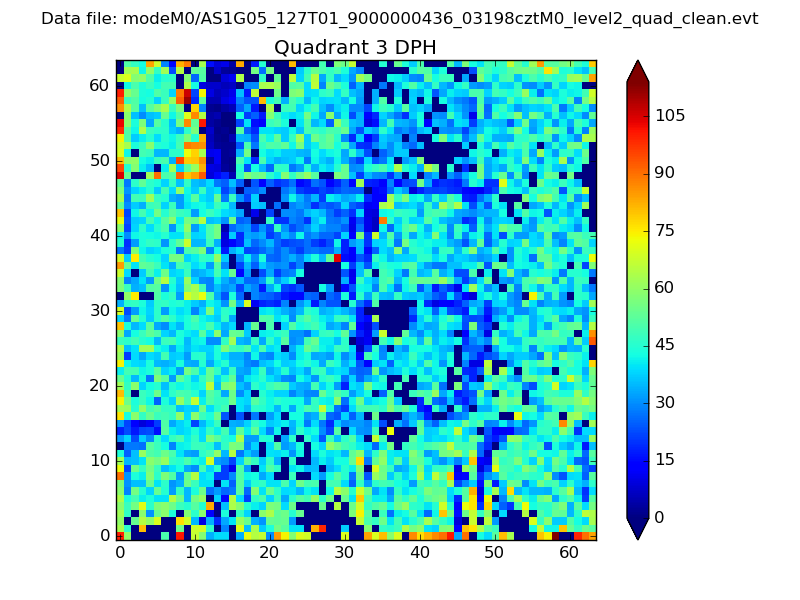 |
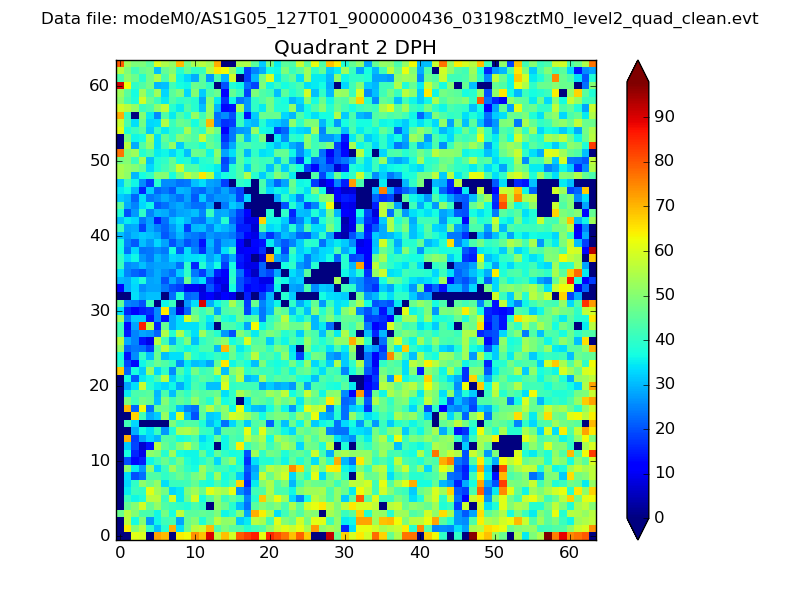 |
Quadrant C |
| Plot type | Count rate plots | Images |
|---|---|---|
| Comparison with Poisson distribution Blue bars denote a histogram of data divided into 1 sec bins. Red curve is a Poisson curve with rate = median count rate of data. |
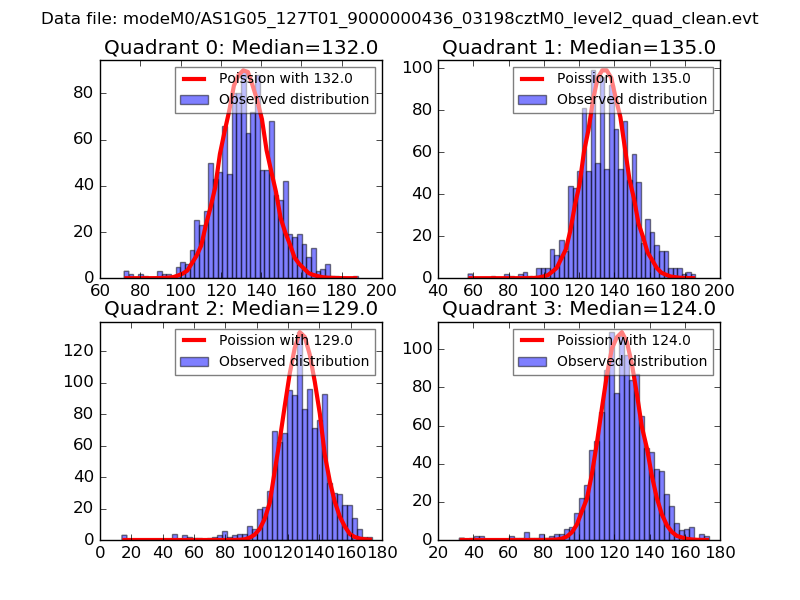 |
 |
| Quadrant-wise count rates Data is divided into 100 sec bins |
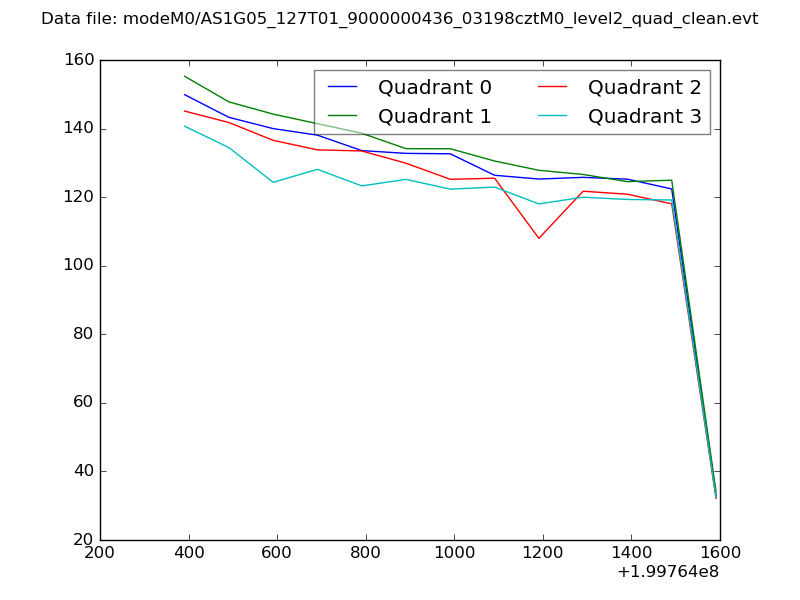 |
|
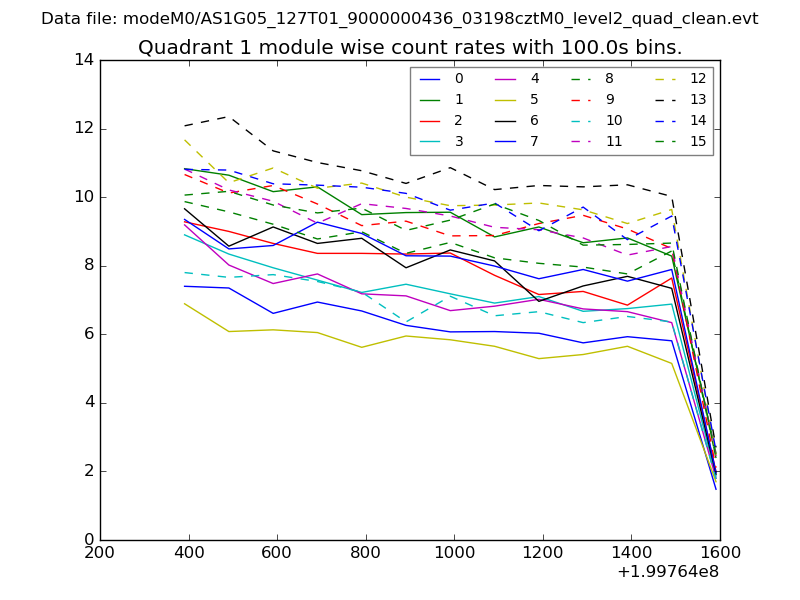
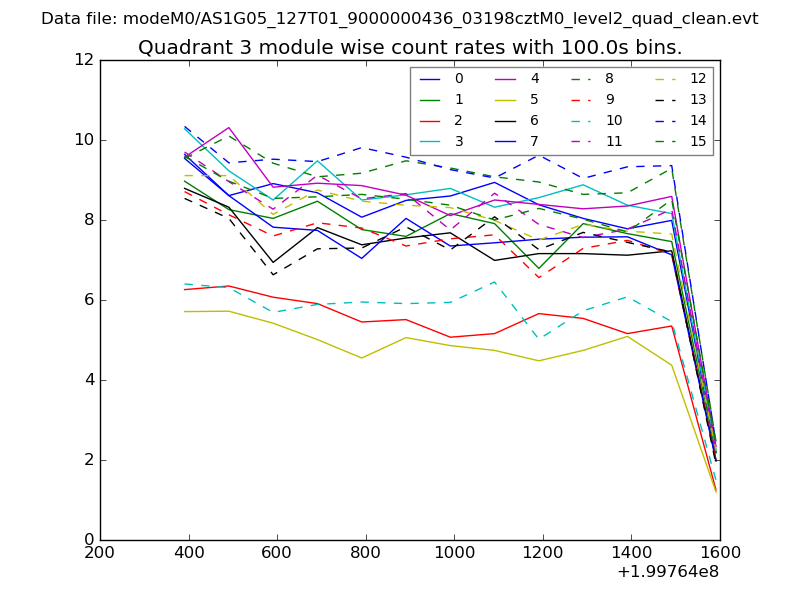
| Module-wise count rates for Quadrant A Data is divided into 100 sec bins |
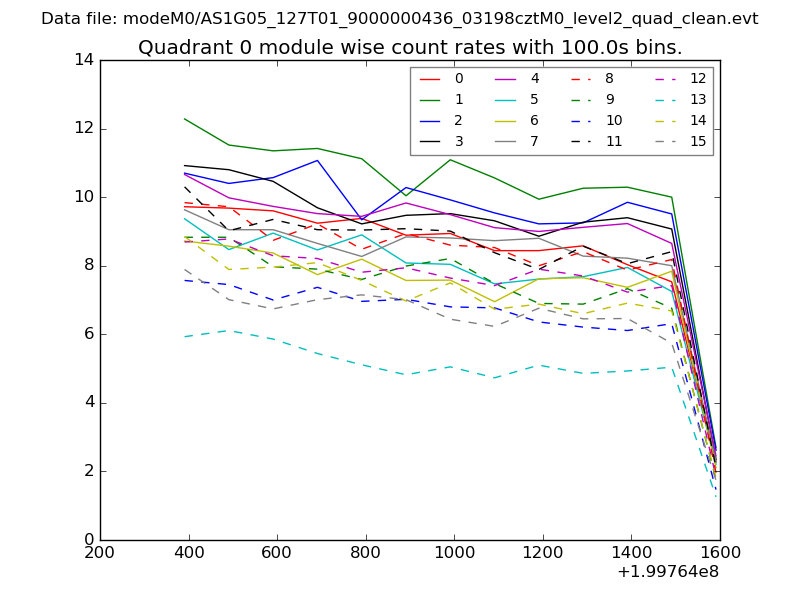 |
 |
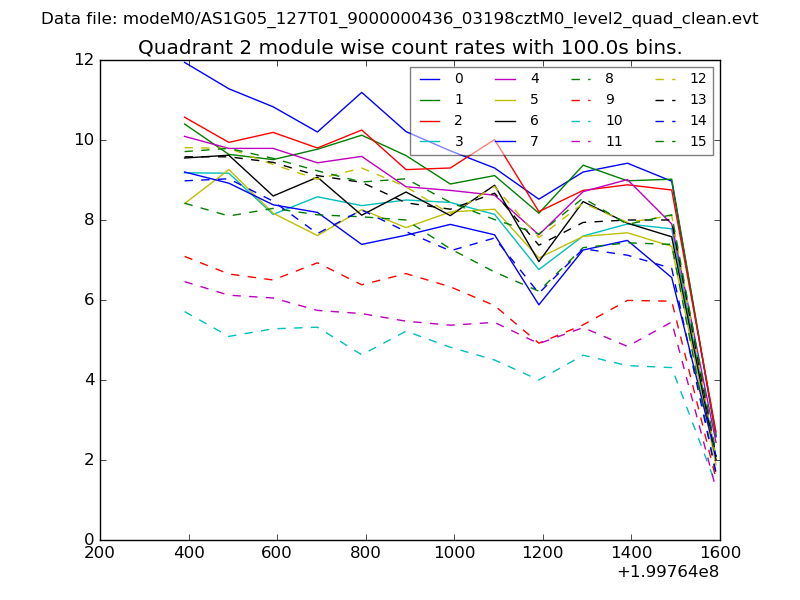
| Module-wise count rates for Quadrant B Data is divided into 100 sec bins |
 |
 |
| Module-wise count rates for Quadrant C Data is divided into 100 sec bins |
 |
 |
| Module-wise count rates for Quadrant D Data is divided into 100 sec bins |
 |
 |
| Parameter | Plot |
|---|---|
| CZT HV Monitor | 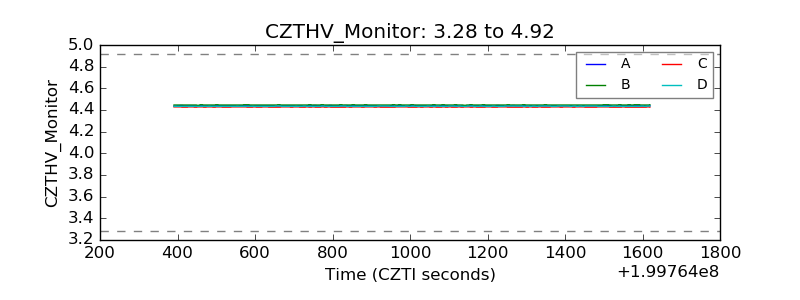 |
| D_VDD | 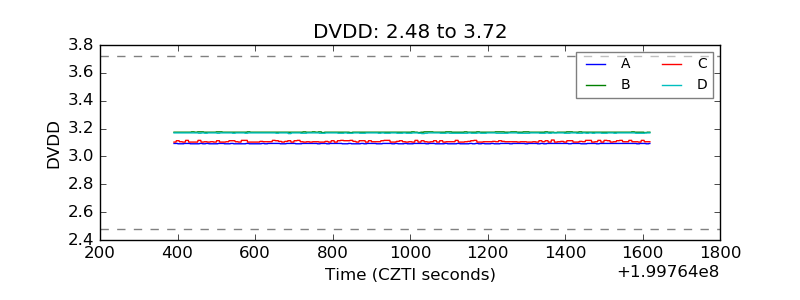 |
| Temperature 1 |  |
| Veto HV Monitor | 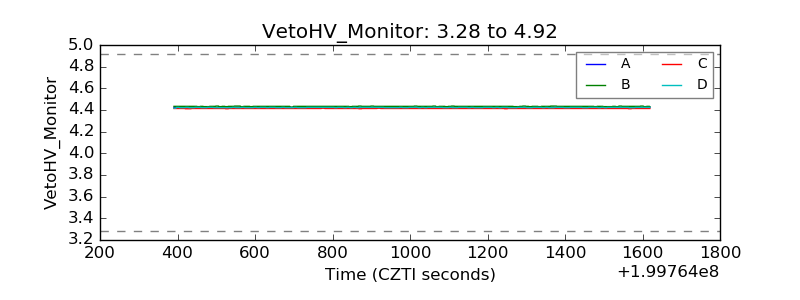 |
| Veto LLD | 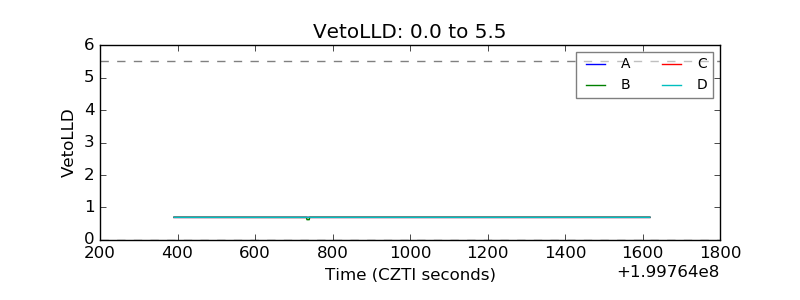 |
| Alpha Counter | 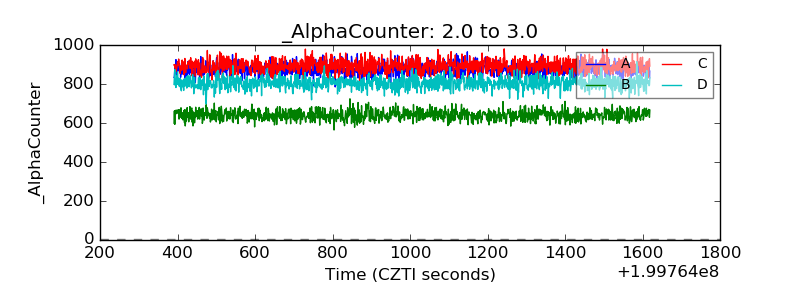 |
| _CPM_Rate | 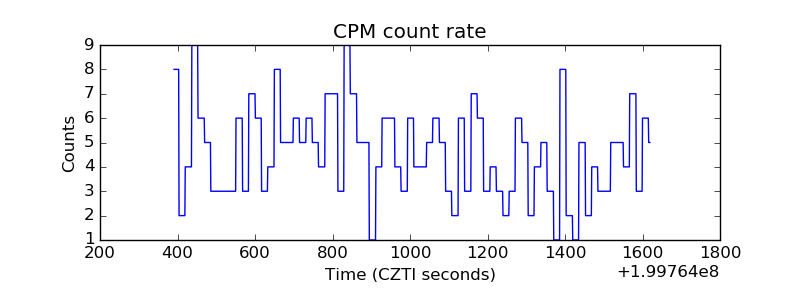 |
| CZT Counter | 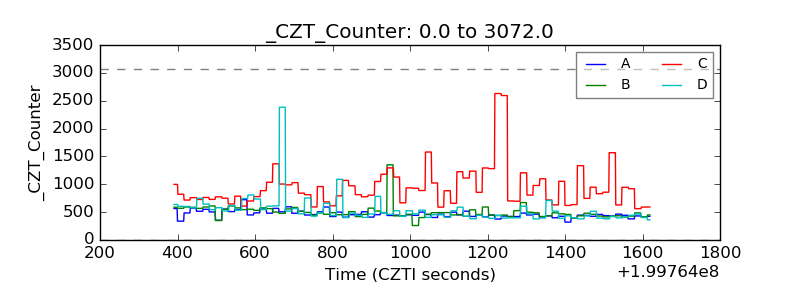 |
| +2.5 Volts monitor |  |
| +5 Volts monitor |  |
| _ROLL_ROT | 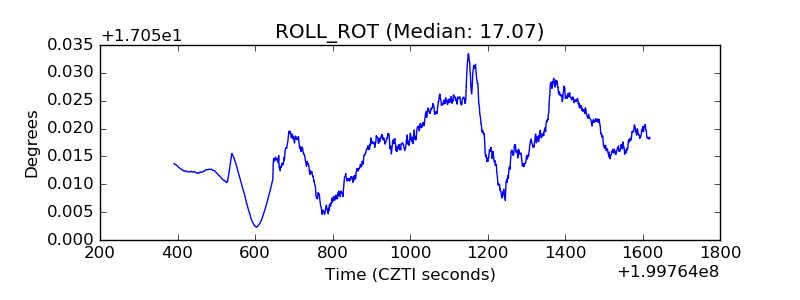 |
| _Roll_DEC | 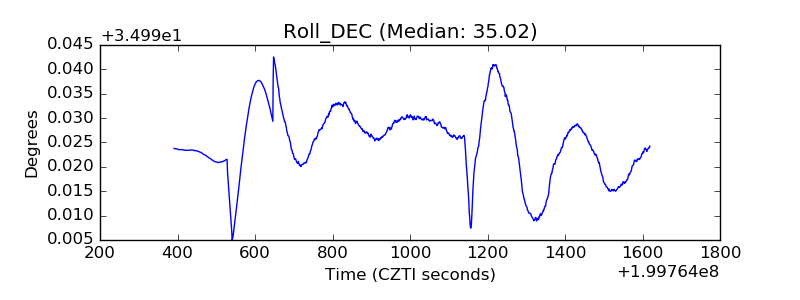 |
| _Roll_RA | 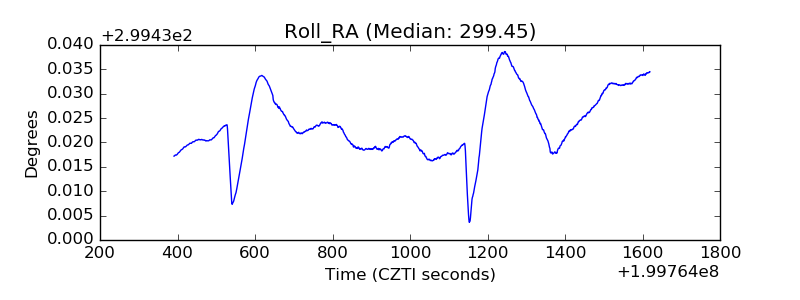 |
| Veto Counter | 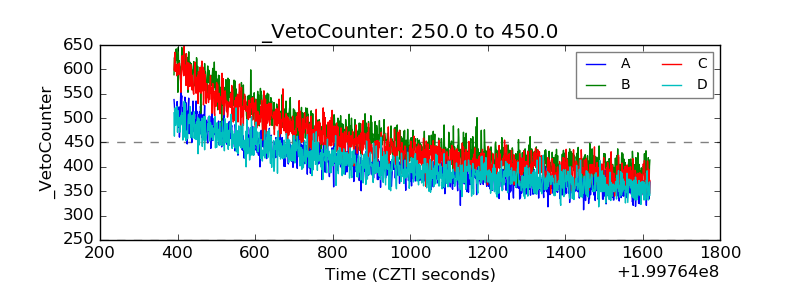 |