| Param | Original file | Final file |
|---|---|---|
| Filename | modeM0/AS1G05_221T01_9000000438cztM0_level2.fits | modeM0/AS1G05_221T01_9000000438cztM0_level2_quad_clean.evt |
| Size (bytes) | 1,403,671,680 | 1,603,512,000 |
| Size | 1.3 GB | 1.5 GB |
| Events in quadrant A | 8,405,072 | 10,170,576 |
| Events in quadrant B | 8,278,998 | 10,251,728 |
| Events in quadrant C | 7,528,302 | 8,035,338 |
| Events in quadrant D | 7,200,318 | 9,030,259 |
| Mode SS | |||
|---|---|---|---|
| Quadrant | BADHDUFLAG | Total packets | Discarded packets |
| A | 0 | 3286 | 0 |
| B | 0 | 3286 | 0 |
| C | 0 | 3286 | 0 |
| D | 0 | 3286 | 0 |
| Mode M0 | |||
|---|---|---|---|
| Quadrant | BADHDUFLAG | Total packets | Discarded packets |
| A | 0 | 365861 | 0 |
| B | 0 | 361503 | 0 |
| C | 0 | 617408 | 0 |
| D | 0 | 360155 | 0 |
| Mode M9 | |||
|---|---|---|---|
| Quadrant | BADHDUFLAG | Total packets | Discarded packets |
| A | 0 | 216 | 0 |
| B | 0 | 216 | 0 |
| C | 0 | 216 | 0 |
| D | 0 | 216 | 0 |
| Quadrant | Total seconds | Saturated seconds | Saturation percentage |
|---|---|---|---|
| A | 161747 | 5088 | 3.145653% |
| B | 161747 | 2925 | 1.808380% |
| C | 161694 | 34790 | 21.515950% |
| D | 161596 | 2867 | 1.774178% |
Noise dominated data is calculated using 1-second bins in cleaned event files. If a bin has >2000 counts, and if more than 50% of those come from <1% of pixels, then it is considered to be noise-dominated and hence unusable.
| Quadrant | # 1 sec bins | Bins with >0 counts | Bins with >2000 counts | High rate bins dominated by noise | Noise dominated (total time) | Noise dominated (detector-on time) | Marked lightcurve |
|---|---|---|---|---|---|---|---|
| A | 183346 | 161683 | 0 | 0 | 0.00% | 0.00% |  |
| B | 183346 | 161717 | 0 | 0 | 0.00% | 0.00% |  |
| C | 183346 | 161469 | 0 | 0 | 0.00% | 0.00% |  |
| D | 183346 | 161562 | 0 | 0 | 0.00% | 0.00% |  |
Top three noisy pixels from each quadrant. If the there are fewer than three noisy pixels in the level2.evt file, extra rows are filled as -1
| Pixel properties | Quadrant properties | ||||||
|---|---|---|---|---|---|---|---|
| Quadrant | DetID | PixID | Counts | Sigma | Mean | Median | Sigma |
| A | 0 | 29 | 8244 | 11.04 | 2184 | 2034 | 562.5 |
| A | 14 | 188 | 8239 | 11.03 | 2184 | 2034 | 562.5 |
| A | 7 | 110 | 7343 | 9.44 | 2184 | 2034 | 562.5 |
| B | 2 | 9 | 7177 | 11.73 | 2187 | 2082 | 434.2 |
| B | 12 | 226 | 6274 | 9.65 | 2187 | 2082 | 434.2 |
| B | 14 | 254 | 5891 | 8.77 | 2187 | 2082 | 434.2 |
| C | 1 | 80 | 5498 | 6.97 | 1991 | 1837 | 525.4 |
| C | 1 | 81 | 5387 | 6.76 | 1991 | 1837 | 525.4 |
| C | 12 | 241 | 5305 | 6.6 | 1991 | 1837 | 525.4 |
| D | 1 | 19 | 5325 | 6.33 | 2059 | 1866 | 546.8 |
| D | 6 | 231 | 5224 | 6.14 | 2059 | 1866 | 546.8 |
| D | 1 | 3 | 5213 | 6.12 | 2059 | 1866 | 546.8 |
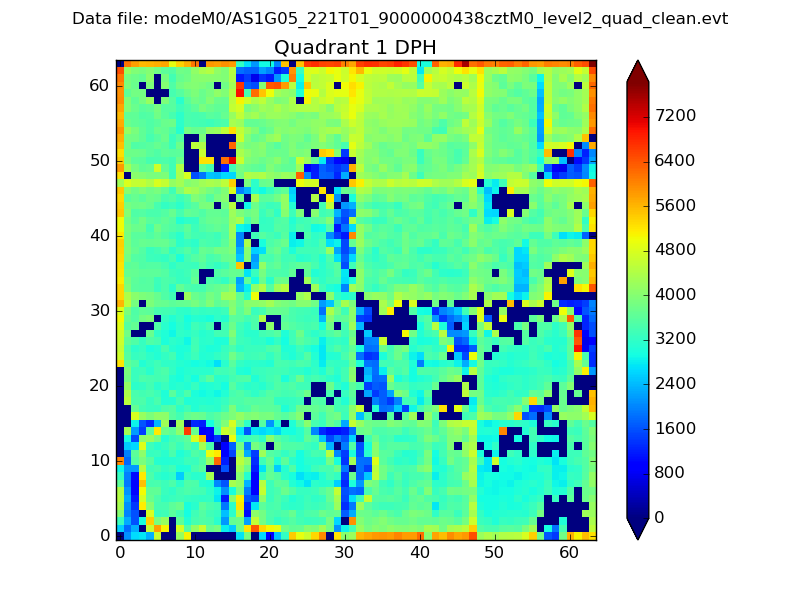
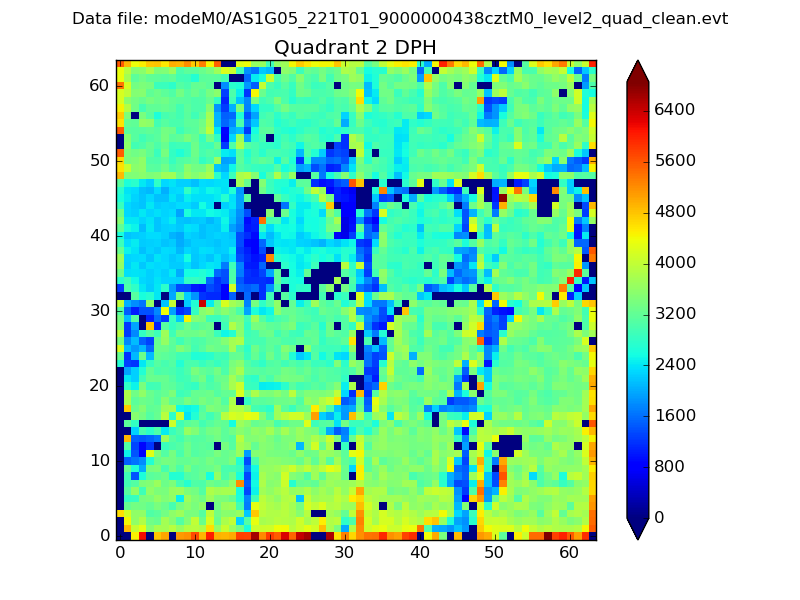
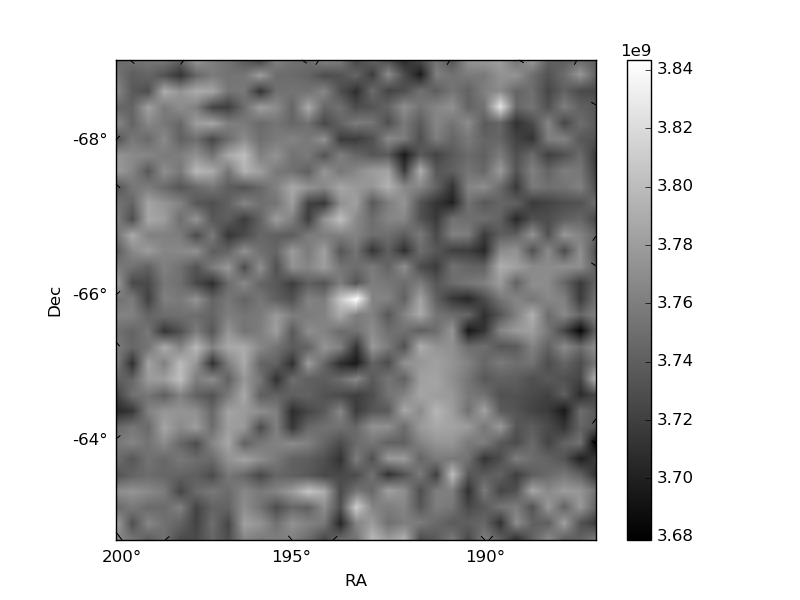
Histogram calculated using DETX and DETY for each event in the final _common_clean file
| Quadrant A |  |
 |
Quadrant B |
|---|---|---|---|
| Quadrant D | 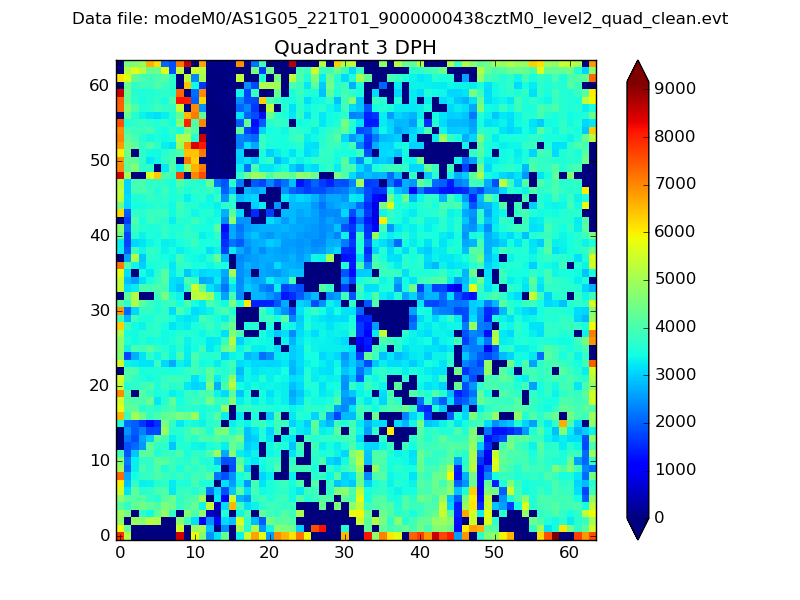 |
 |
Quadrant C |
| Plot type | Count rate plots | Images |
|---|---|---|
| Comparison with Poisson distribution Blue bars denote a histogram of data divided into 1 sec bins. Red curve is a Poisson curve with rate = median count rate of data. |
 |
 |
| Quadrant-wise count rates Data is divided into 100 sec bins |
 |
|
| Module-wise count rates for Quadrant A Data is divided into 100 sec bins |
 |
 |
| Module-wise count rates for Quadrant B Data is divided into 100 sec bins |
 |
 |
| Module-wise count rates for Quadrant C Data is divided into 100 sec bins |
 |
 |
| Module-wise count rates for Quadrant D Data is divided into 100 sec bins |
 |
 |
| Parameter | Plot |
|---|---|
| CZT HV Monitor |  |
| D_VDD | 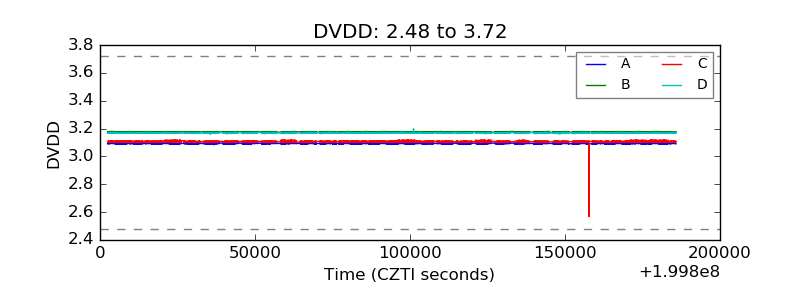 |
| Temperature 1 |  |
| Veto HV Monitor |  |
| Veto LLD | 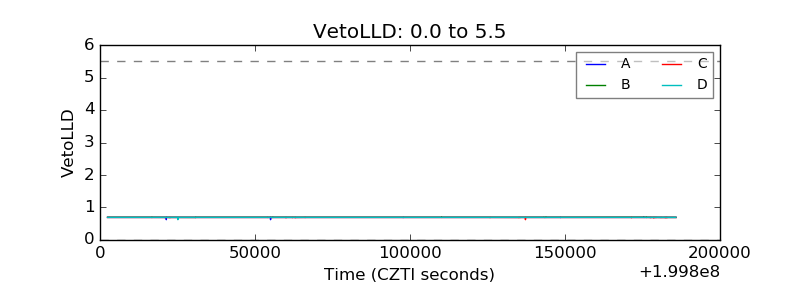 |
| Alpha Counter |  |
| _CPM_Rate | 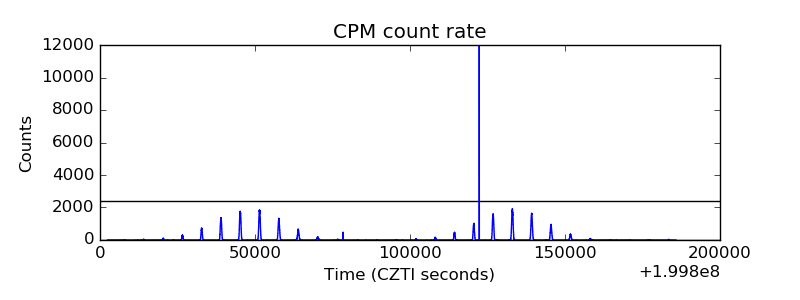 |
| CZT Counter |  |
| +2.5 Volts monitor |  |
| +5 Volts monitor | 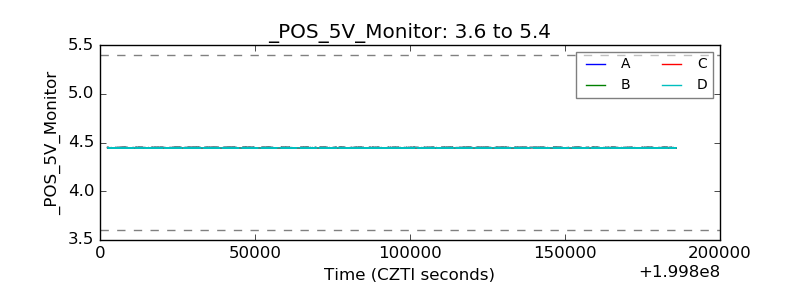 |
| _ROLL_ROT |  |
| _Roll_DEC |  |
| _Roll_RA | 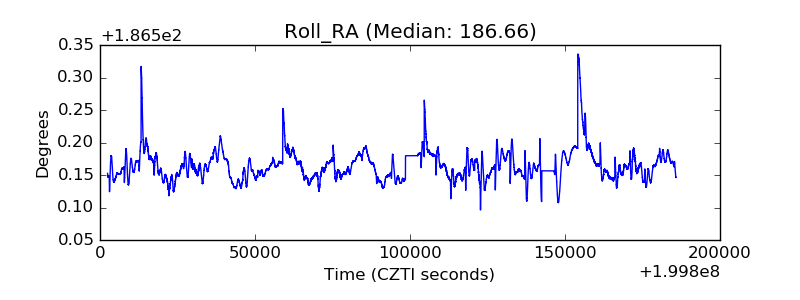 |
| Veto Counter |  |