| Param | Original file | Final file |
|---|---|---|
| Filename | modeM0/AS1G05_221T01_9000000438_03207cztM0_level2.evt | modeM0/AS1G05_221T01_9000000438_03207cztM0_level2_quad_clean.evt |
| Size (bytes) | 2,074,196,160 | 199,304,640 |
| Size | 1.9 GB | 190.1 MB |
| Events in quadrant A | 7,993,759 | 1,308,487 |
| Events in quadrant B | 8,650,978 | 1,305,096 |
| Events in quadrant C | 35,728,425 | 931,775 |
| Events in quadrant D | 9,233,333 | 1,247,370 |
| Mode SS | |||
|---|---|---|---|
| Quadrant | BADHDUFLAG | Total packets | Discarded packets |
| A | 0 | 366 | 0 |
| B | 0 | 366 | 0 |
| C | 0 | 366 | 0 |
| D | 0 | 366 | 0 |
| Mode M0 | |||
|---|---|---|---|
| Quadrant | BADHDUFLAG | Total packets | Discarded packets |
| A | 0 | 36909 | 4 |
| B | 0 | 37895 | 3 |
| C | 0 | 118497 | 3 |
| D | 0 | 40273 | 3 |
| Mode M9 | |||
|---|---|---|---|
| Quadrant | BADHDUFLAG | Total packets | Discarded packets |
| A | 0 | 11 | 0 |
| B | 0 | 11 | 0 |
| C | 0 | 11 | 0 |
| D | 0 | 11 | 0 |
| Quadrant | Total seconds | Saturated seconds | Saturation percentage |
|---|---|---|---|
| A | 17990 | 215 | 1.195108% |
| B | 17990 | 227 | 1.261812% |
| C | 17990 | 9905 | 55.058366% |
| D | 17990 | 203 | 1.128405% |
Noise dominated data is calculated using 1-second bins in cleaned event files. If a bin has >2000 counts, and if more than 50% of those come from <1% of pixels, then it is considered to be noise-dominated and hence unusable.
| Quadrant | # 1 sec bins | Bins with >0 counts | Bins with >2000 counts | High rate bins dominated by noise | Noise dominated (total time) | Noise dominated (detector-on time) | Marked lightcurve |
|---|---|---|---|---|---|---|---|
| A | 19085 | 17992 | 5 | 5 | 0.03% | 0.03% | 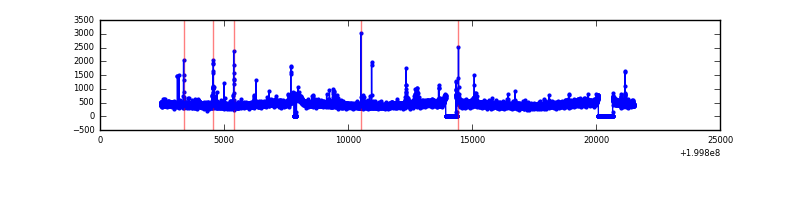 |
| B | 19085 | 17993 | 11 | 11 | 0.06% | 0.06% | 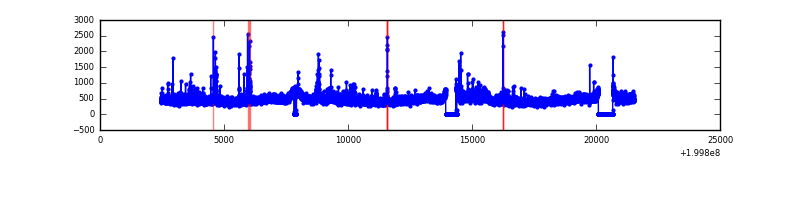 |
| C | 19084 | 17989 | 9683 | 9683 | 50.74% | 53.83% | 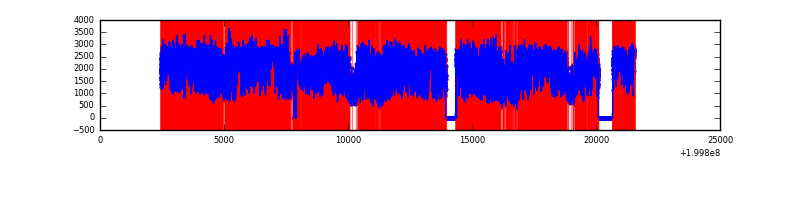 |
| D | 19085 | 17995 | 91 | 91 | 0.48% | 0.51% | 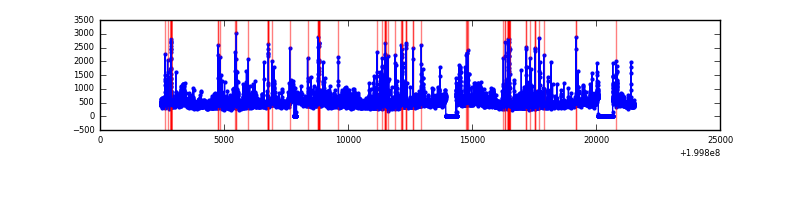 |
Top three noisy pixels from each quadrant. If the there are fewer than three noisy pixels in the level2.evt file, extra rows are filled as -1
| Pixel properties | Quadrant properties | ||||||
|---|---|---|---|---|---|---|---|
| Quadrant | DetID | PixID | Counts | Sigma | Mean | Median | Sigma |
| A | 0 | 118 | 43665 | 100.35 | 2020 | 1966 | 415.6 |
| A | 0 | 199 | 38589 | 88.13 | 2020 | 1966 | 415.6 |
| A | 12 | 247 | 34683 | 78.73 | 2020 | 1966 | 415.6 |
| B | 15 | 204 | 399086 | 1005.52 | 2055 | 2005 | 394.9 |
| B | 2 | 249 | 103252 | 256.39 | 2055 | 2005 | 394.9 |
| B | 4 | 80 | 62730 | 153.77 | 2055 | 2005 | 394.9 |
| C | 12 | 206 | 28484872 | 81149.4 | 1517 | 1524 | 351.0 |
| C | 14 | 223 | 622770 | 1769.94 | 1517 | 1524 | 351.0 |
| C | 7 | 220 | 525925 | 1494.02 | 1517 | 1524 | 351.0 |
| D | 13 | 114 | 601602 | 1250.66 | 1936 | 1882 | 479.5 |
| D | 13 | 120 | 326136 | 676.2 | 1936 | 1882 | 479.5 |
| D | 5 | 233 | 268196 | 555.37 | 1936 | 1882 | 479.5 |
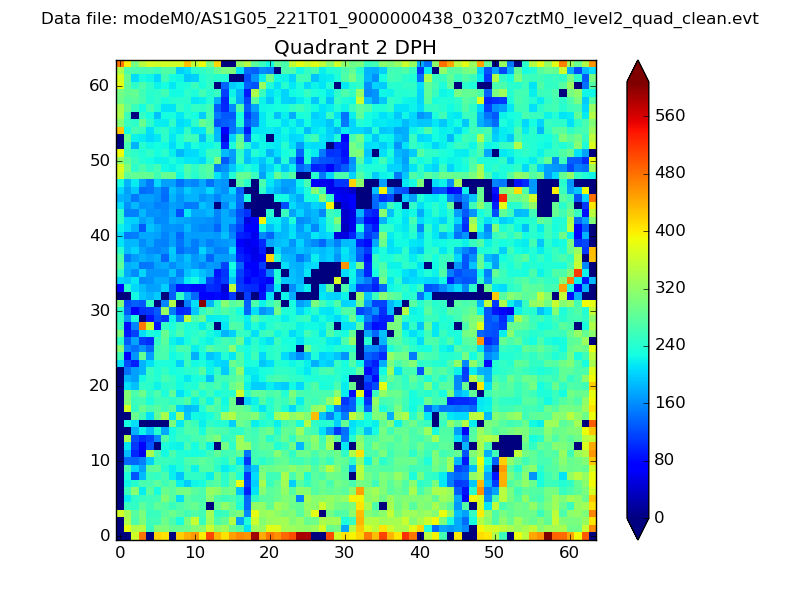
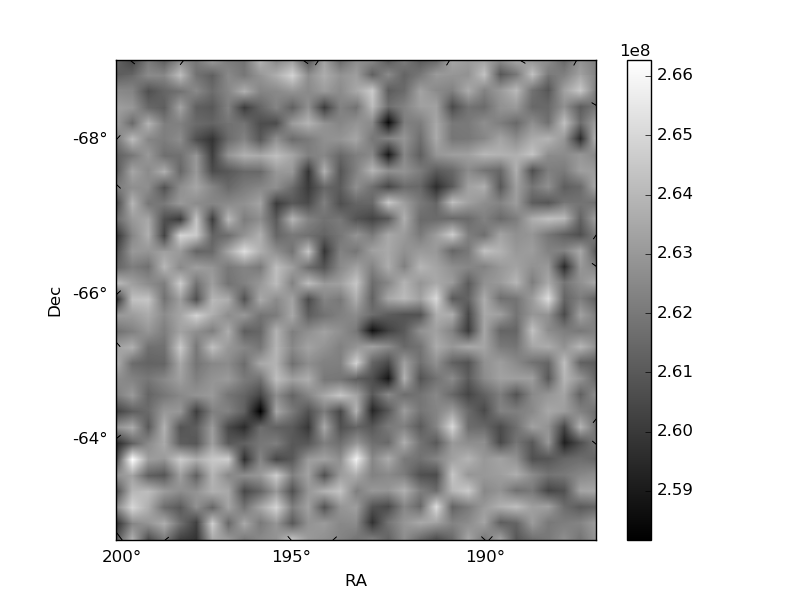
Histogram calculated using DETX and DETY for each event in the final _common_clean file
| Quadrant A | 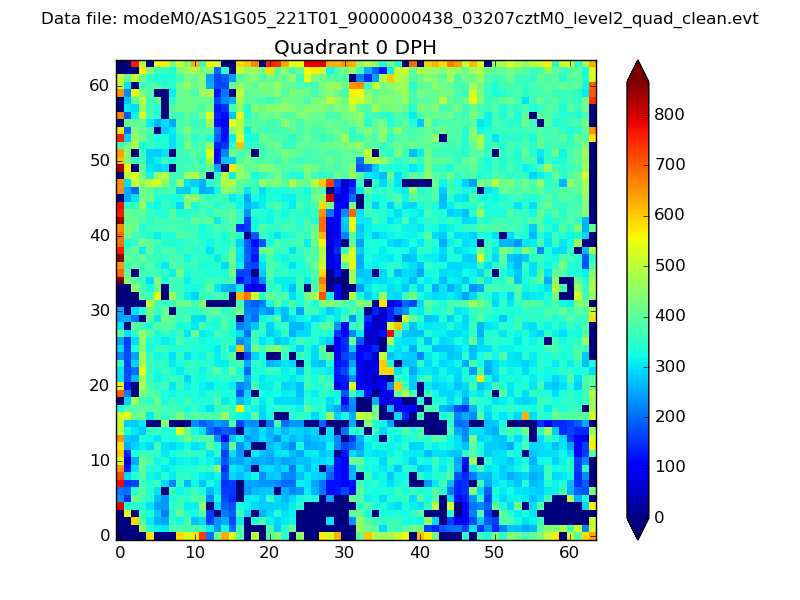 |
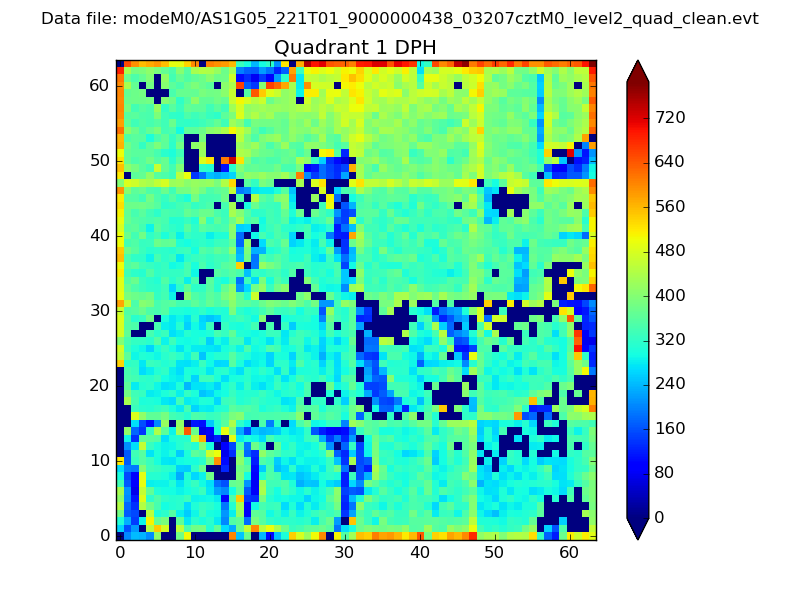 |
Quadrant B |
|---|---|---|---|
| Quadrant D | 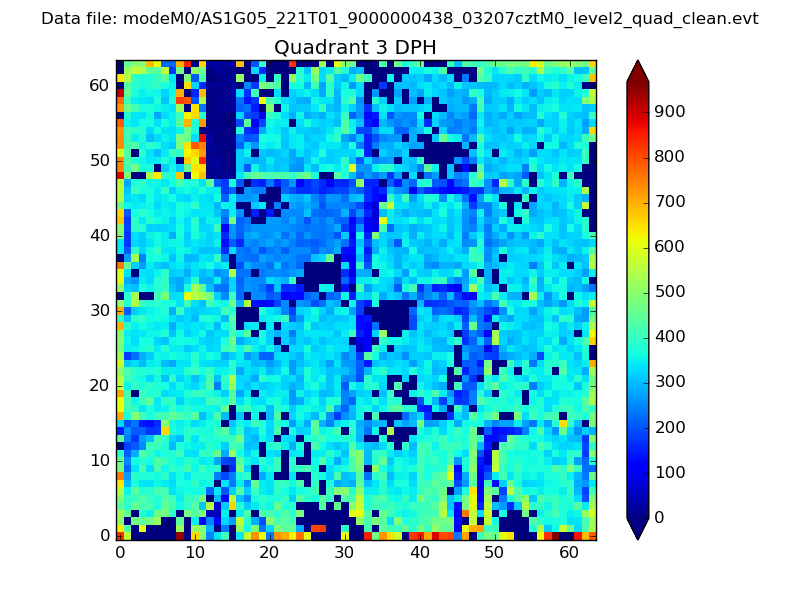 |
 |
Quadrant C |
| Plot type | Count rate plots | Images |
|---|---|---|
| Comparison with Poisson distribution Blue bars denote a histogram of data divided into 1 sec bins. Red curve is a Poisson curve with rate = median count rate of data. |
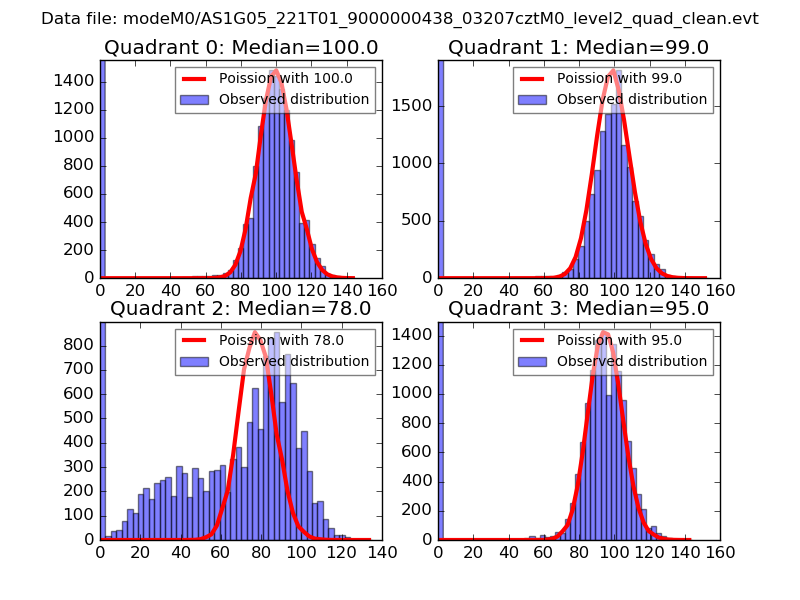 |
 |
| Quadrant-wise count rates Data is divided into 100 sec bins |
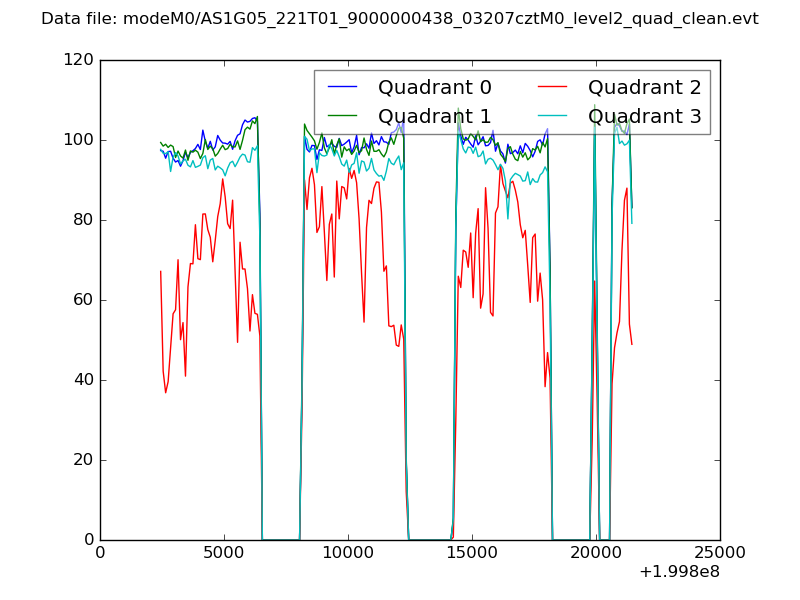 |
|
| Module-wise count rates for Quadrant A Data is divided into 100 sec bins |
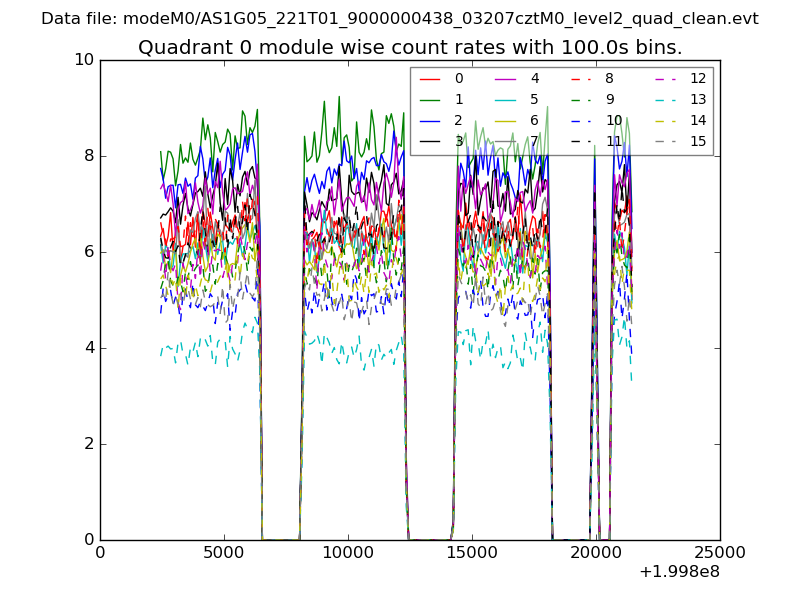 |
 |
| Module-wise count rates for Quadrant B Data is divided into 100 sec bins |
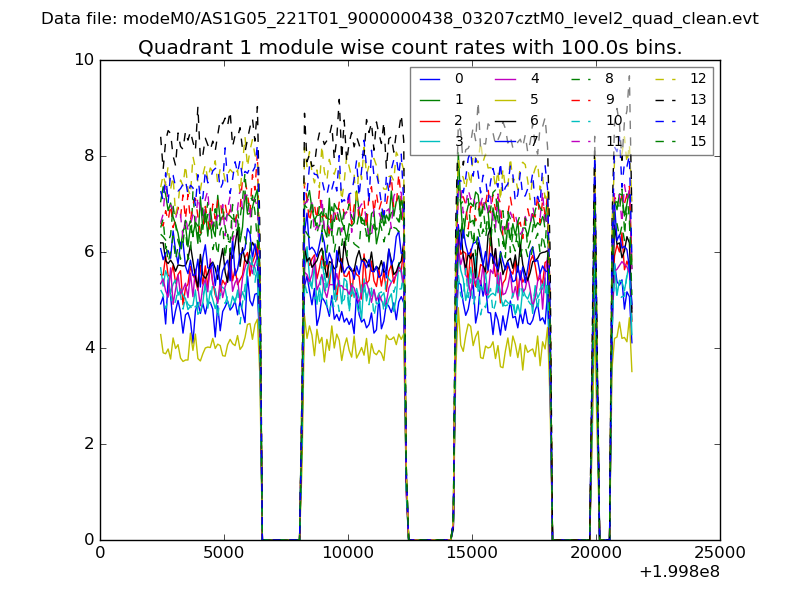 |
 |
| Module-wise count rates for Quadrant C Data is divided into 100 sec bins |
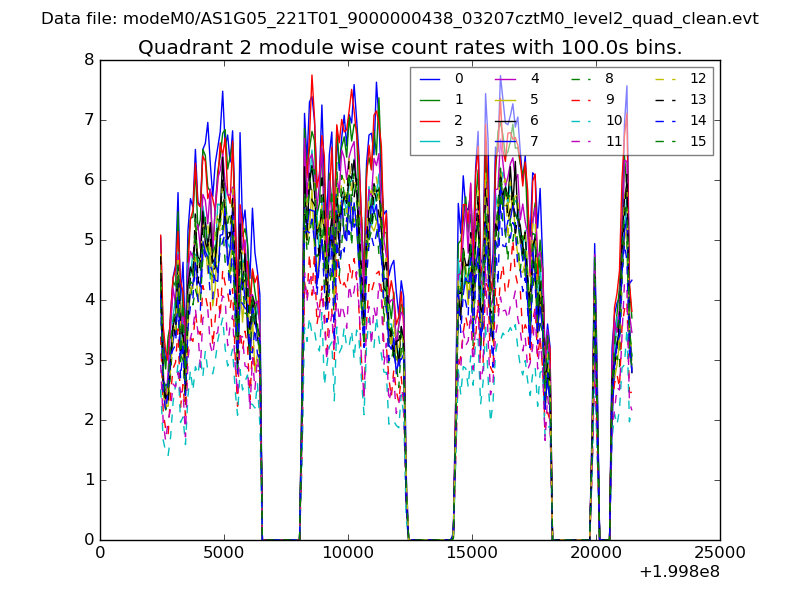 |
 |
| Module-wise count rates for Quadrant D Data is divided into 100 sec bins |
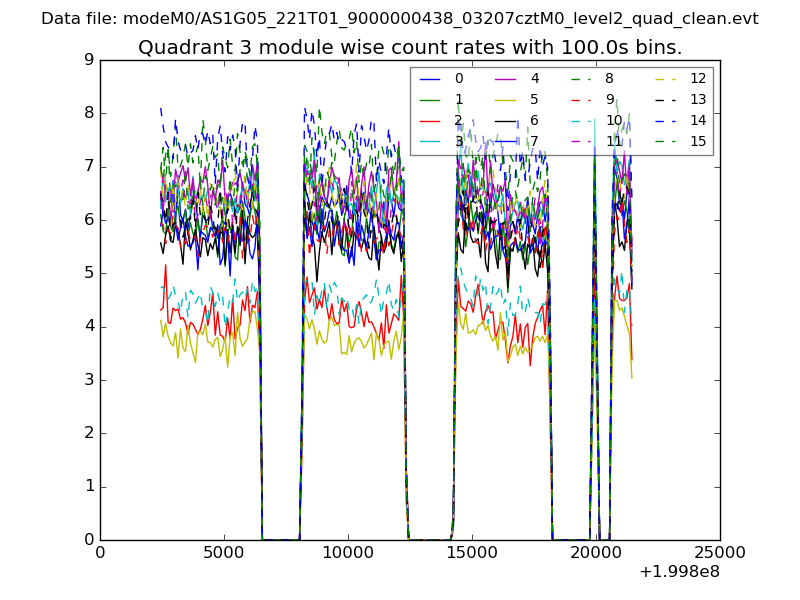 |
 |
| Parameter | Plot |
|---|---|
| CZT HV Monitor | 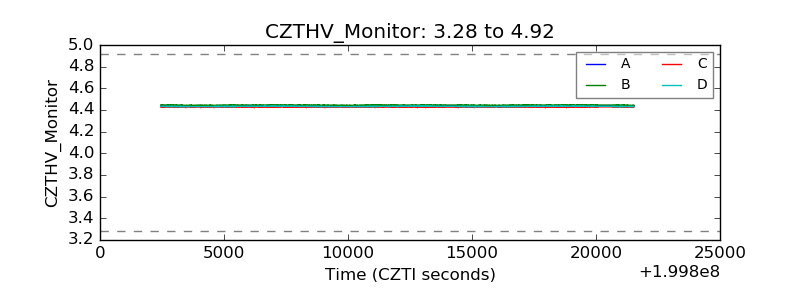 |
| D_VDD | 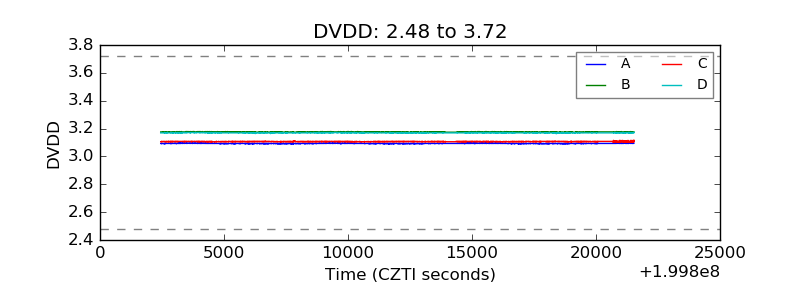 |
| Temperature 1 | 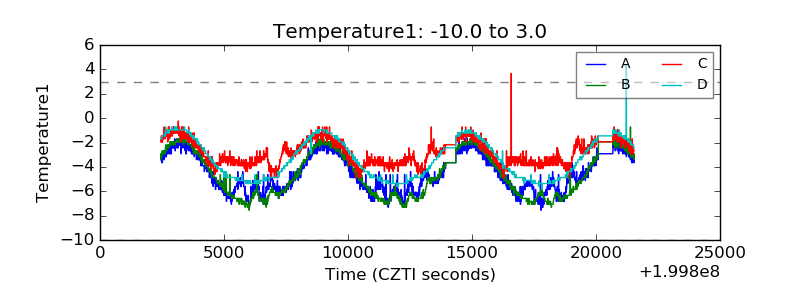 |
| Veto HV Monitor | 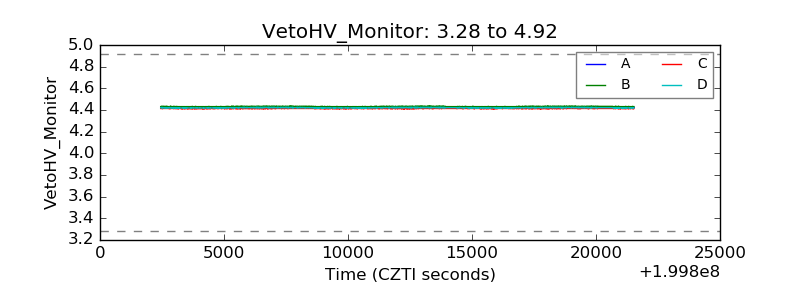 |
| Veto LLD | 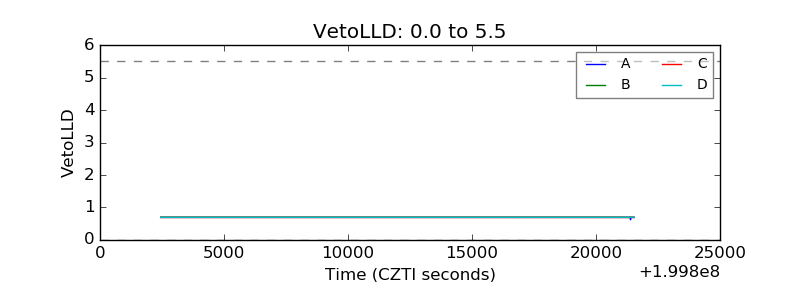 |
| Alpha Counter | 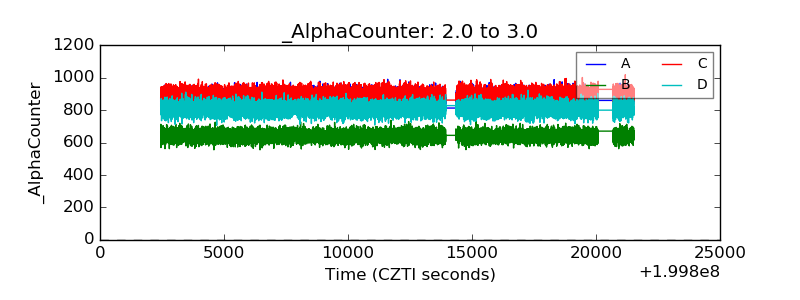 |
| _CPM_Rate | 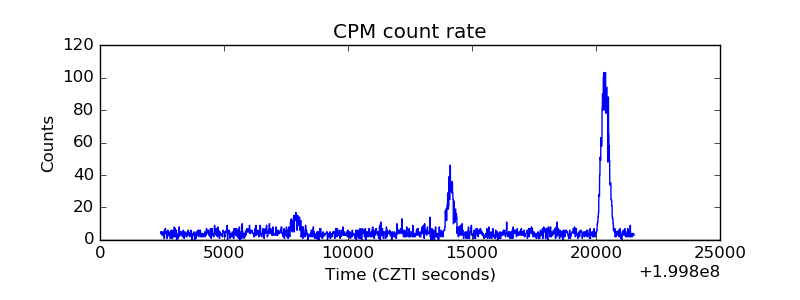 |
| CZT Counter | 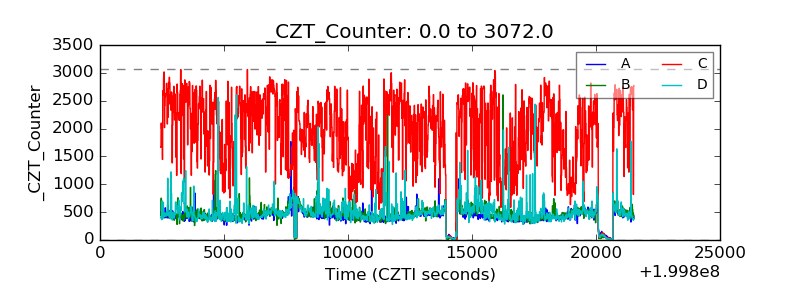 |
| +2.5 Volts monitor | 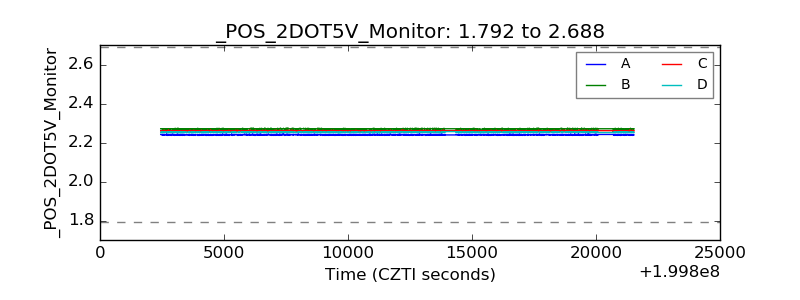 |
| +5 Volts monitor |  |
| _ROLL_ROT | 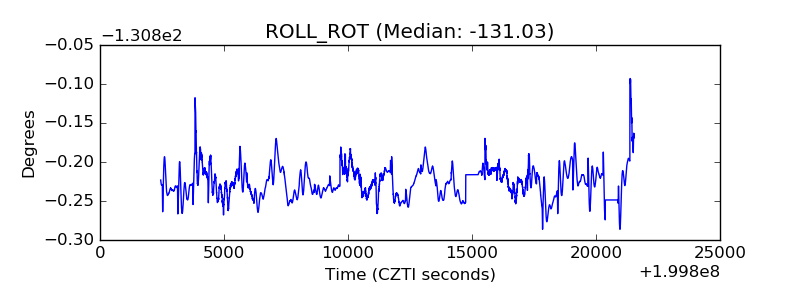 |
| _Roll_DEC | 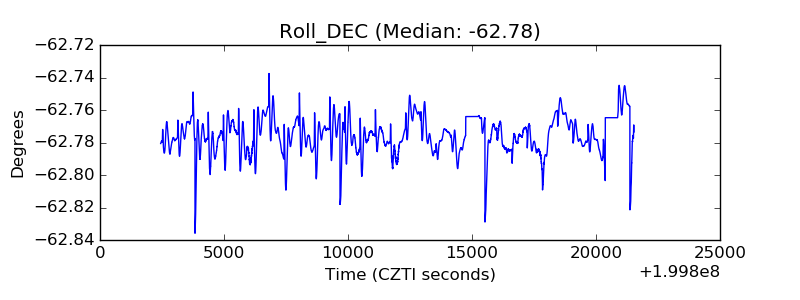 |
| _Roll_RA | 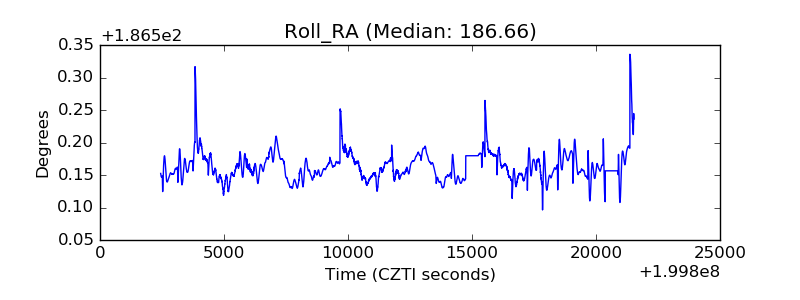 |
| Veto Counter | 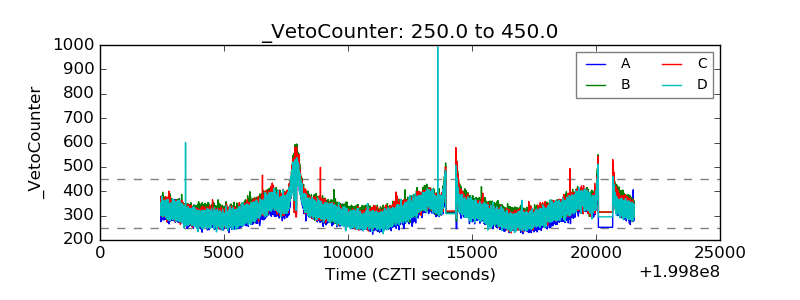 |