| Param | Original file | Final file |
|---|---|---|
| Filename | modeM0/AS1G05_221T01_9000000438_03208cztM0_level2.evt | modeM0/AS1G05_221T01_9000000438_03208cztM0_level2_quad_clean.evt |
| Size (bytes) | 1,385,092,800 | 138,631,680 |
| Size | 1.3 GB | 132.2 MB |
| Events in quadrant A | 5,316,636 | 921,065 |
| Events in quadrant B | 5,726,296 | 916,243 |
| Events in quadrant C | 23,821,108 | 641,688 |
| Events in quadrant D | 6,255,777 | 868,374 |
| Mode SS | |||
|---|---|---|---|
| Quadrant | BADHDUFLAG | Total packets | Discarded packets |
| A | 0 | 250 | 0 |
| B | 0 | 250 | 0 |
| C | 0 | 250 | 0 |
| D | 0 | 250 | 0 |
| Mode M0 | |||
|---|---|---|---|
| Quadrant | BADHDUFLAG | Total packets | Discarded packets |
| A | 0 | 24811 | 3 |
| B | 0 | 25331 | 2 |
| C | 0 | 79255 | 2 |
| D | 0 | 27787 | 2 |
| Mode M9 | |||
|---|---|---|---|
| Quadrant | BADHDUFLAG | Total packets | Discarded packets |
| A | 0 | 17 | 0 |
| B | 0 | 17 | 0 |
| C | 0 | 17 | 0 |
| D | 0 | 17 | 0 |
| Quadrant | Total seconds | Saturated seconds | Saturation percentage |
|---|---|---|---|
| A | 12273 | 28 | 0.228143% |
| B | 12273 | 40 | 0.325919% |
| C | 12273 | 7103 | 57.875010% |
| D | 12273 | 146 | 1.189603% |
Noise dominated data is calculated using 1-second bins in cleaned event files. If a bin has >2000 counts, and if more than 50% of those come from <1% of pixels, then it is considered to be noise-dominated and hence unusable.
| Quadrant | # 1 sec bins | Bins with >0 counts | Bins with >2000 counts | High rate bins dominated by noise | Noise dominated (total time) | Noise dominated (detector-on time) | Marked lightcurve |
|---|---|---|---|---|---|---|---|
| A | 14003 | 12274 | 3 | 3 | 0.02% | 0.02% | 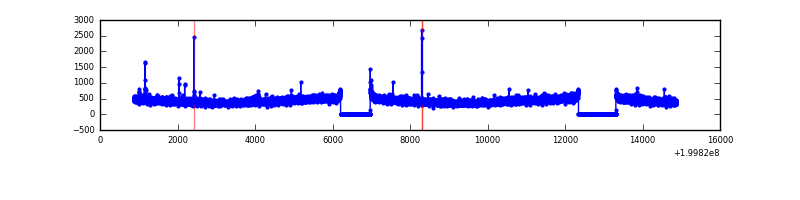 |
| B | 14003 | 12275 | 4 | 4 | 0.03% | 0.03% | 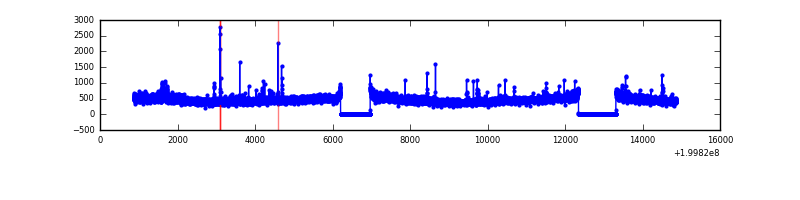 |
| C | 14002 | 12272 | 7030 | 7030 | 50.21% | 57.28% | 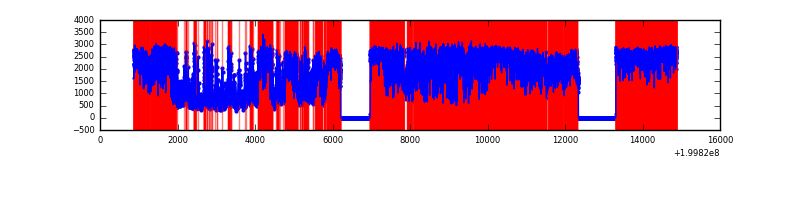 |
| D | 14003 | 12275 | 114 | 114 | 0.81% | 0.93% | 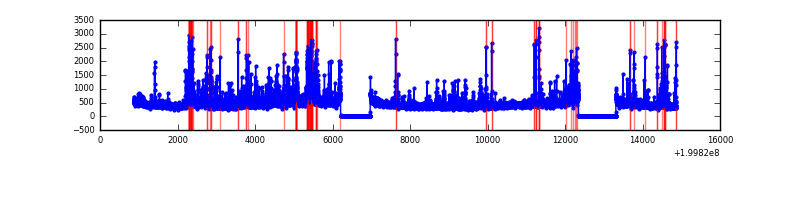 |
Top three noisy pixels from each quadrant. If the there are fewer than three noisy pixels in the level2.evt file, extra rows are filled as -1
| Pixel properties | Quadrant properties | ||||||
|---|---|---|---|---|---|---|---|
| Quadrant | DetID | PixID | Counts | Sigma | Mean | Median | Sigma |
| A | 0 | 118 | 23290 | 78.96 | 1361 | 1328 | 278.1 |
| A | 8 | 15 | 16630 | 55.01 | 1361 | 1328 | 278.1 |
| A | 0 | 226 | 16294 | 53.81 | 1361 | 1328 | 278.1 |
| B | 15 | 204 | 234537 | 872.79 | 1389 | 1353 | 267.2 |
| B | 2 | 249 | 31864 | 114.2 | 1389 | 1353 | 267.2 |
| B | 15 | 85 | 28356 | 101.07 | 1389 | 1353 | 267.2 |
| C | 12 | 206 | 19469290 | 81560.66 | 1028 | 1033 | 238.7 |
| C | 14 | 223 | 123961 | 515.0 | 1028 | 1033 | 238.7 |
| C | 1 | 192 | 88820 | 367.78 | 1028 | 1033 | 238.7 |
| D | 12 | 233 | 349805 | 1111.35 | 1295 | 1258 | 313.6 |
| D | 13 | 120 | 289168 | 918.01 | 1295 | 1258 | 313.6 |
| D | 13 | 223 | 260152 | 825.49 | 1295 | 1258 | 313.6 |
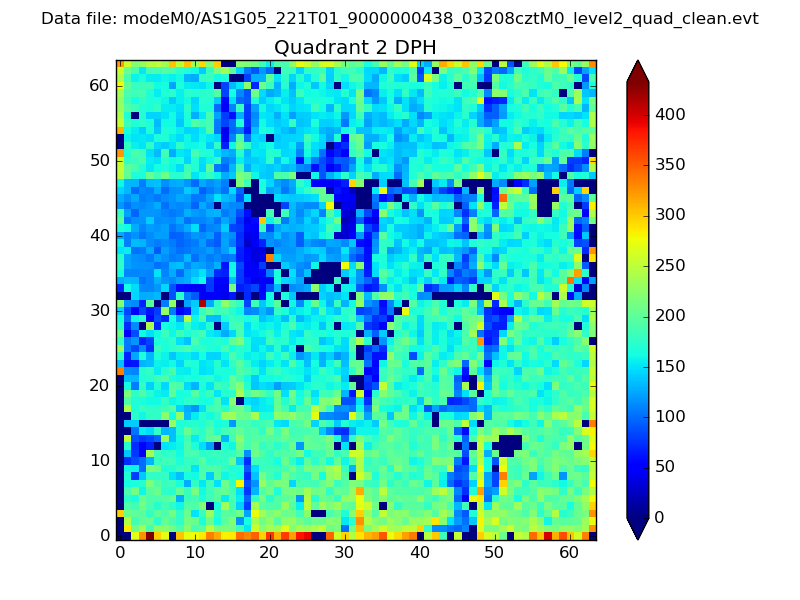
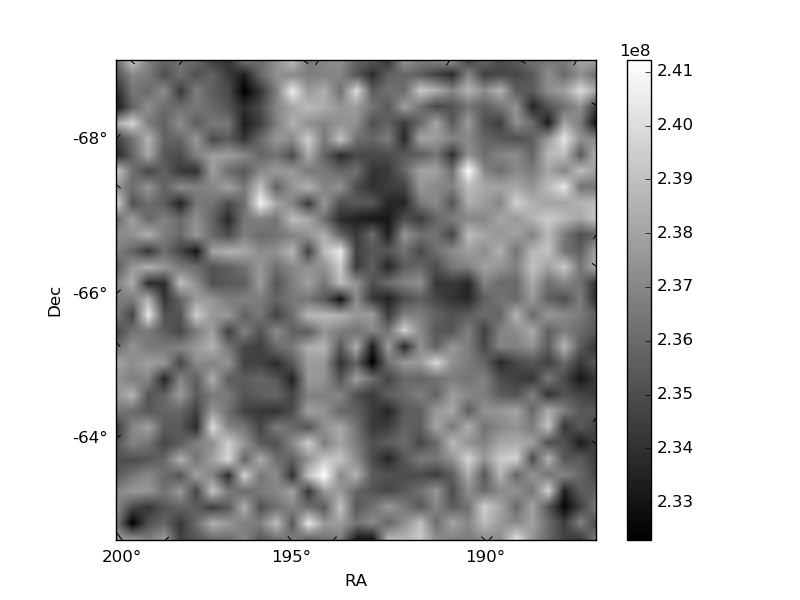
Histogram calculated using DETX and DETY for each event in the final _common_clean file
| Quadrant A |  |
 |
Quadrant B |
|---|---|---|---|
| Quadrant D | 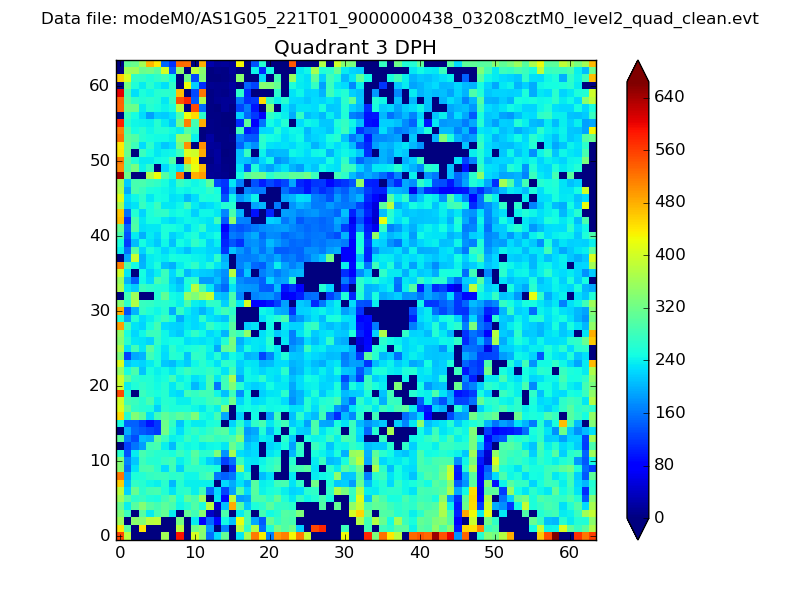 |
 |
Quadrant C |
| Plot type | Count rate plots | Images |
|---|---|---|
| Comparison with Poisson distribution Blue bars denote a histogram of data divided into 1 sec bins. Red curve is a Poisson curve with rate = median count rate of data. |
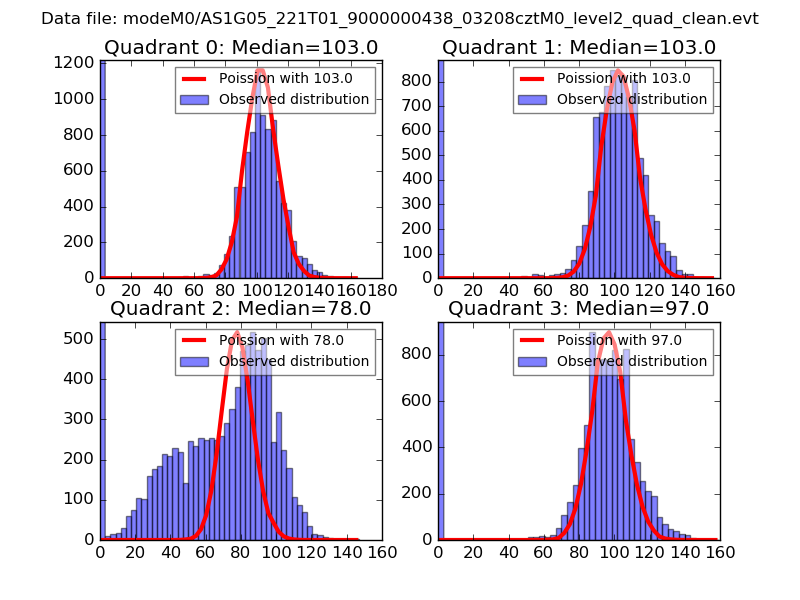 |
 |
| Quadrant-wise count rates Data is divided into 100 sec bins |
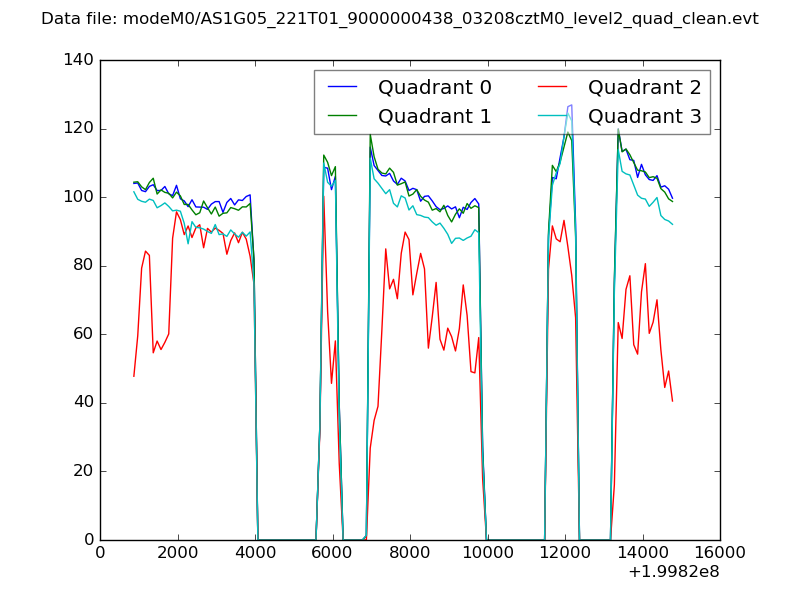 |
|
| Module-wise count rates for Quadrant A Data is divided into 100 sec bins |
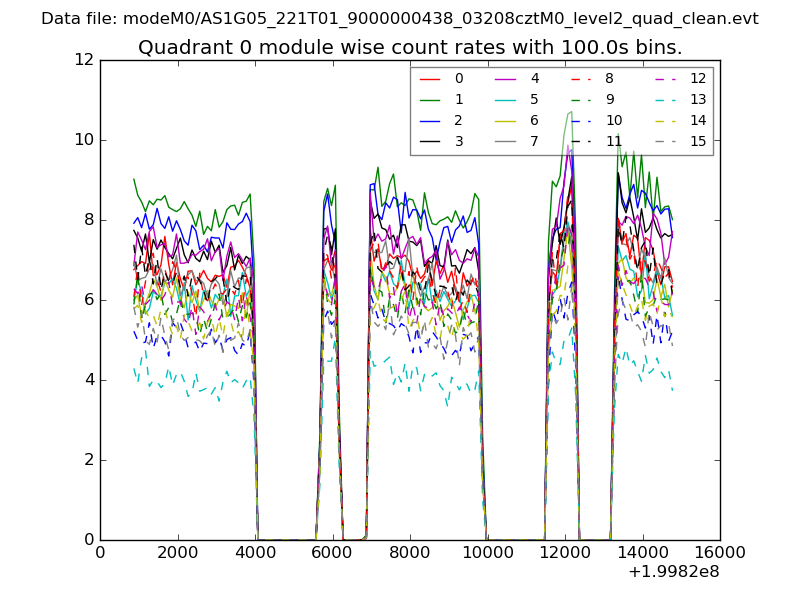 |
 |
| Module-wise count rates for Quadrant B Data is divided into 100 sec bins |
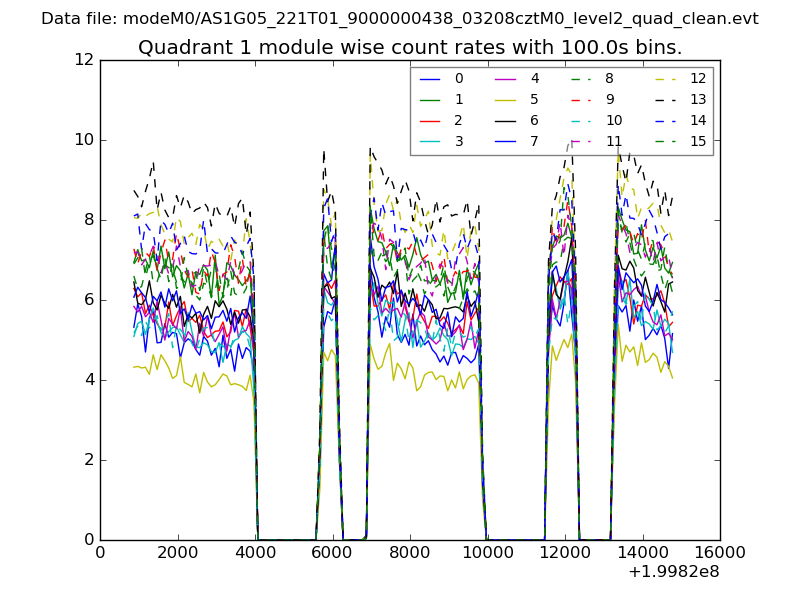 |
 |
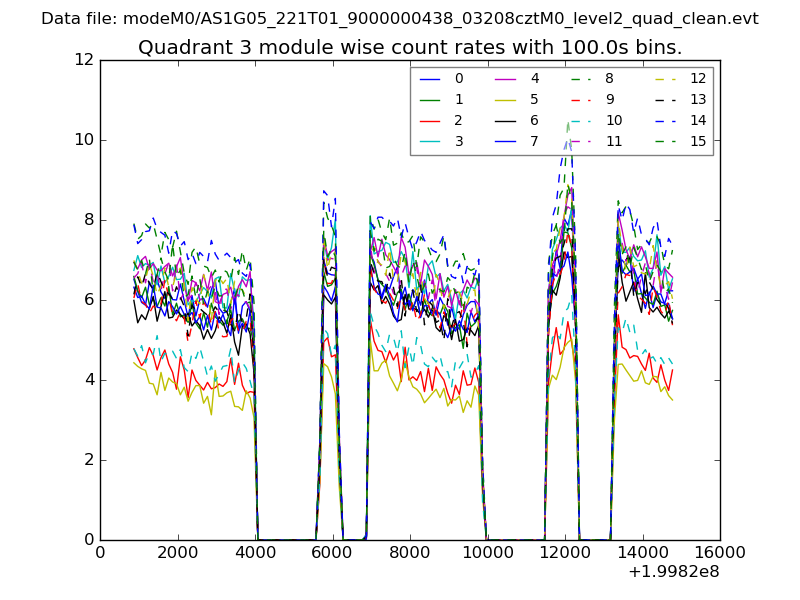
| Module-wise count rates for Quadrant C Data is divided into 100 sec bins |
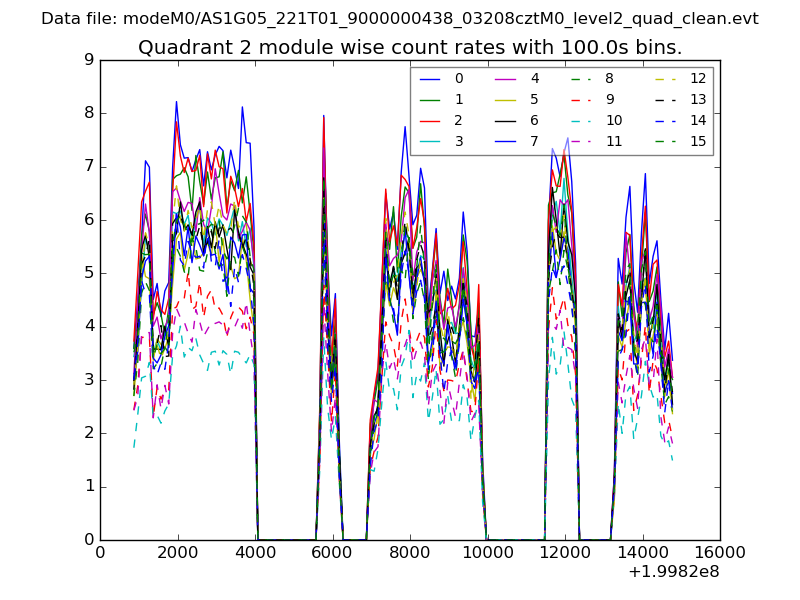 |
 |
| Module-wise count rates for Quadrant D Data is divided into 100 sec bins |
 |
 |
| Parameter | Plot |
|---|---|
| CZT HV Monitor | 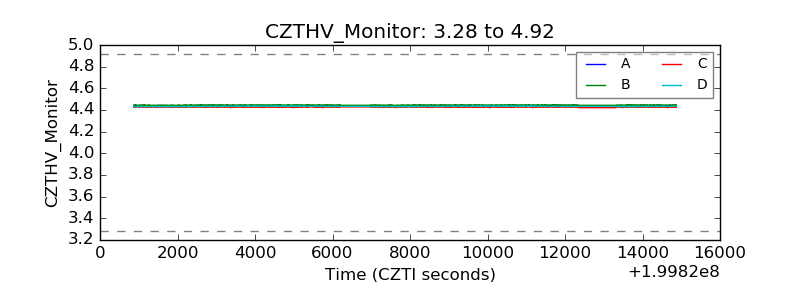 |
| D_VDD | 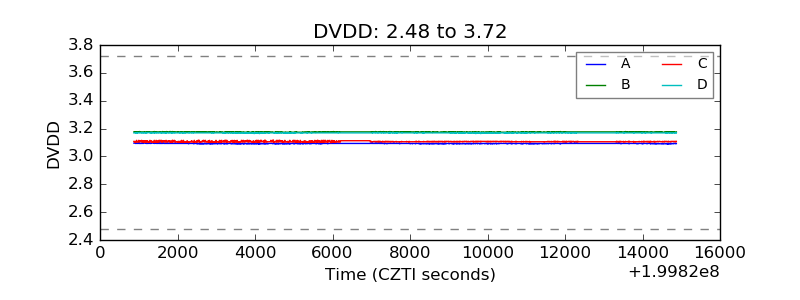 |
| Temperature 1 | 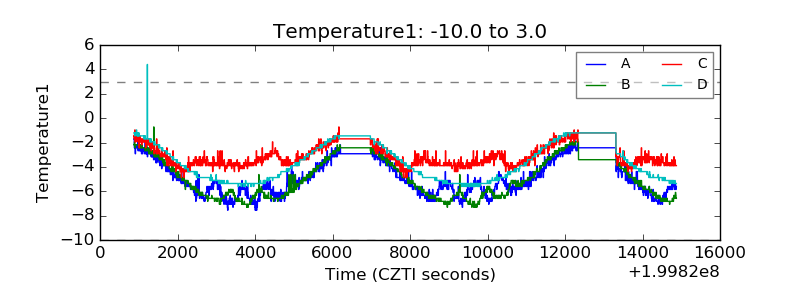 |
| Veto HV Monitor | 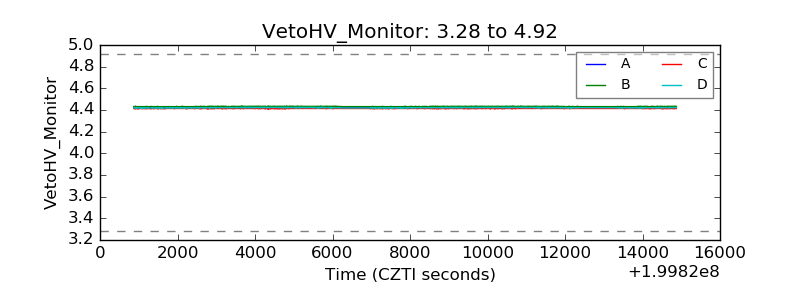 |
| Veto LLD | 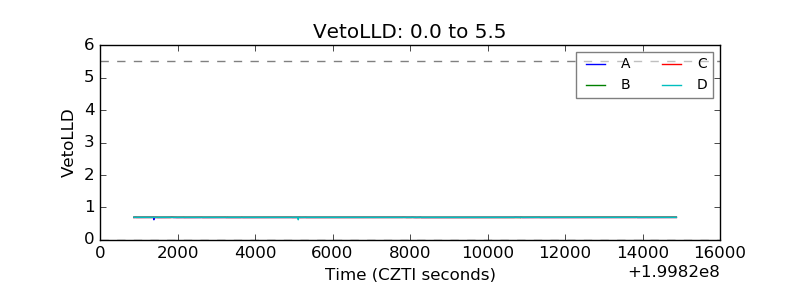 |
| Alpha Counter | 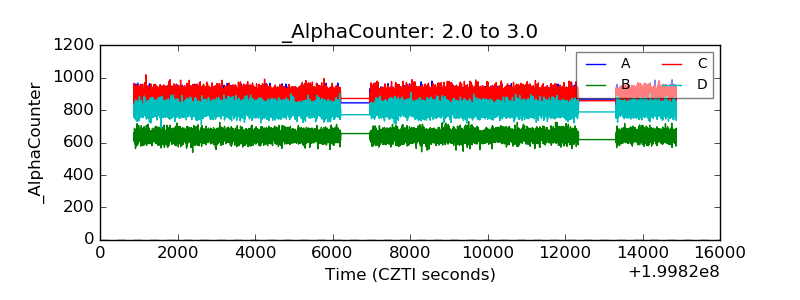 |
| _CPM_Rate | 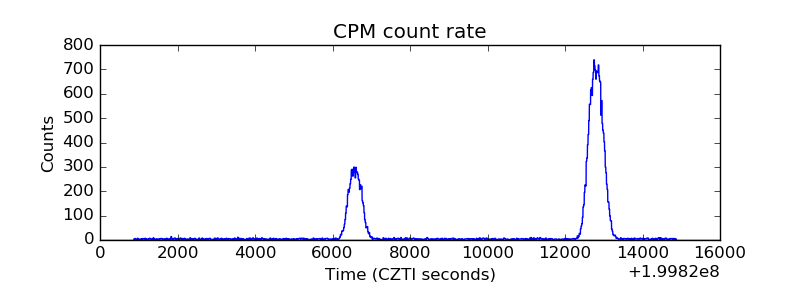 |
| CZT Counter | 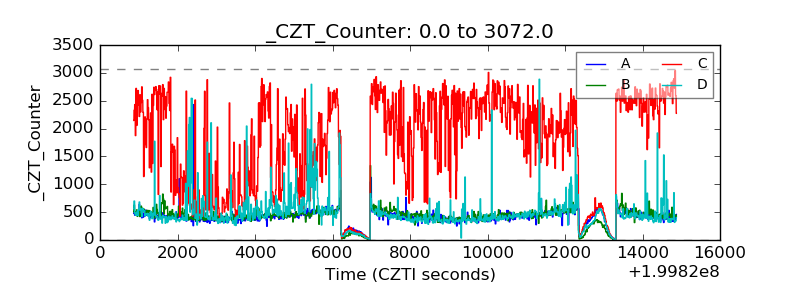 |
| +2.5 Volts monitor |  |
| +5 Volts monitor |  |
| _ROLL_ROT | 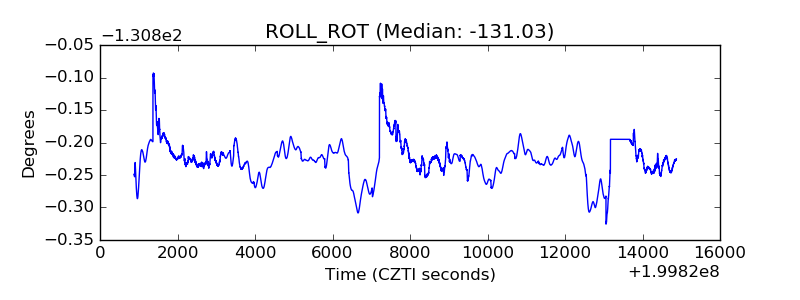 |
| _Roll_DEC | 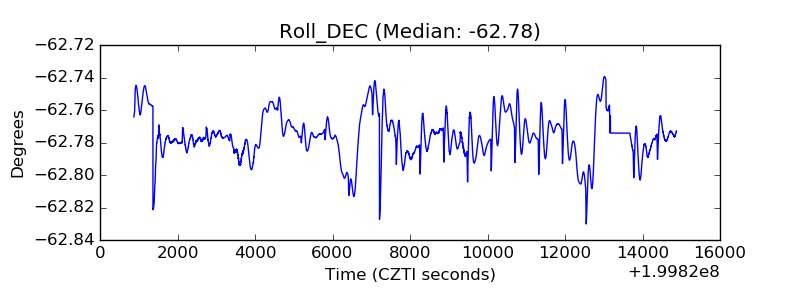 |
| _Roll_RA | 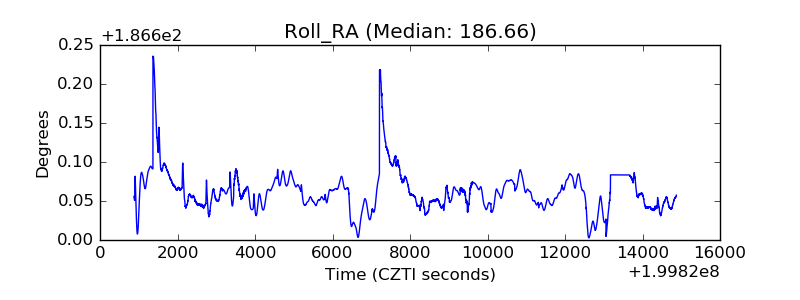 |
| Veto Counter | 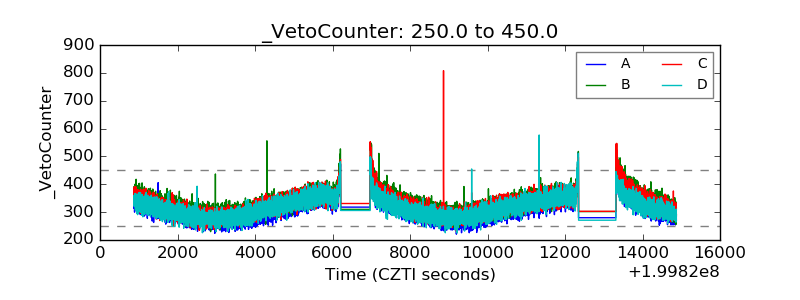 |