| Param | Original file | Final file |
|---|---|---|
| Filename | modeM0/AS1G05_221T01_9000000438_03214cztM0_level2.evt | modeM0/AS1G05_221T01_9000000438_03214cztM0_level2_quad_clean.evt |
| Size (bytes) | 744,448,320 | 66,672,000 |
| Size | 710.0 MB | 63.6 MB |
| Events in quadrant A | 2,854,784 | 424,256 |
| Events in quadrant B | 3,273,250 | 428,882 |
| Events in quadrant C | 12,504,396 | 325,008 |
| Events in quadrant D | 3,492,693 | 404,990 |
| Mode SS | |||
|---|---|---|---|
| Quadrant | BADHDUFLAG | Total packets | Discarded packets |
| A | 0 | 128 | 0 |
| B | 0 | 128 | 0 |
| C | 0 | 128 | 0 |
| D | 0 | 128 | 0 |
| Mode M0 | |||
|---|---|---|---|
| Quadrant | BADHDUFLAG | Total packets | Discarded packets |
| A | 0 | 12722 | 3 |
| B | 0 | 13489 | 2 |
| C | 0 | 41464 | 2 |
| D | 0 | 14638 | 2 |
| Mode M9 | |||
|---|---|---|---|
| Quadrant | BADHDUFLAG | Total packets | Discarded packets |
| A | 0 | 15 | 0 |
| B | 0 | 15 | 0 |
| C | 0 | 15 | 0 |
| D | 0 | 16 | 0 |
| Quadrant | Total seconds | Saturated seconds | Saturation percentage |
|---|---|---|---|
| A | 6218 | 34 | 0.546800% |
| B | 6218 | 63 | 1.013188% |
| C | 6218 | 3334 | 53.618527% |
| D | 6218 | 80 | 1.286587% |
Noise dominated data is calculated using 1-second bins in cleaned event files. If a bin has >2000 counts, and if more than 50% of those come from <1% of pixels, then it is considered to be noise-dominated and hence unusable.
| Quadrant | # 1 sec bins | Bins with >0 counts | Bins with >2000 counts | High rate bins dominated by noise | Noise dominated (total time) | Noise dominated (detector-on time) | Marked lightcurve |
|---|---|---|---|---|---|---|---|
| A | 7488 | 6218 | 1 | 1 | 0.01% | 0.02% | 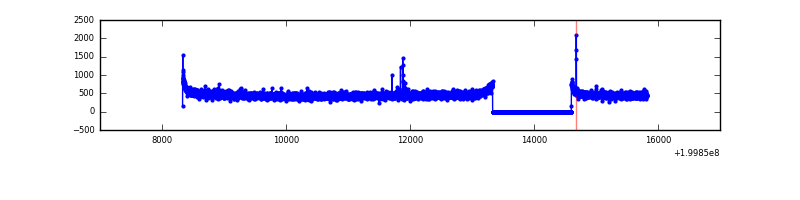 |
| B | 7488 | 6218 | 1 | 1 | 0.01% | 0.02% | 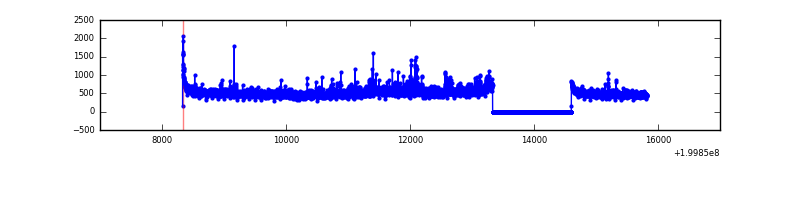 |
| C | 7487 | 6217 | 3421 | 3421 | 45.69% | 55.03% | 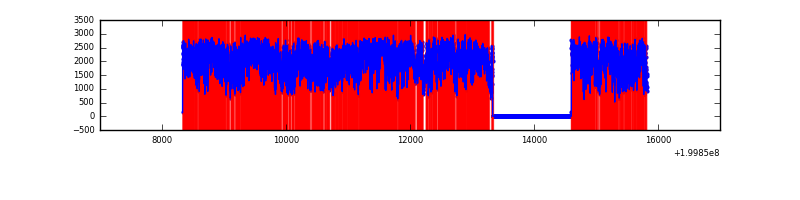 |
| D | 7488 | 6218 | 50 | 50 | 0.67% | 0.80% | 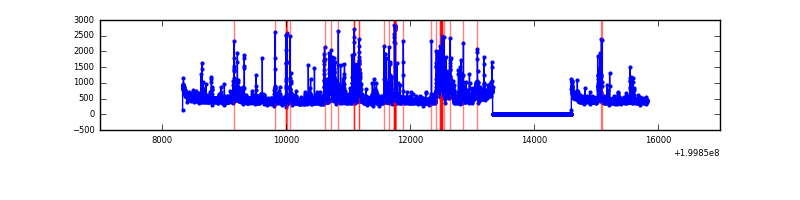 |
Top three noisy pixels from each quadrant. If the there are fewer than three noisy pixels in the level2.evt file, extra rows are filled as -1
| Pixel properties | Quadrant properties | ||||||
|---|---|---|---|---|---|---|---|
| Quadrant | DetID | PixID | Counts | Sigma | Mean | Median | Sigma |
| A | 0 | 118 | 14126 | 89.92 | 734 | 717 | 149.1 |
| A | 0 | 226 | 9140 | 56.48 | 734 | 717 | 149.1 |
| A | 12 | 194 | 7770 | 47.3 | 734 | 717 | 149.1 |
| B | 15 | 204 | 309428 | 2178.64 | 751 | 734 | 141.7 |
| B | 4 | 80 | 23040 | 157.43 | 751 | 734 | 141.7 |
| B | 1 | 223 | 20970 | 142.82 | 751 | 734 | 141.7 |
| C | 12 | 206 | 9447863 | 67752.62 | 610 | 613 | 139.4 |
| C | 15 | 208 | 489834 | 3508.53 | 610 | 613 | 139.4 |
| C | 1 | 192 | 90488 | 644.55 | 610 | 613 | 139.4 |
| D | 8 | 144 | 368429 | 2151.81 | 710 | 690 | 170.9 |
| D | 13 | 223 | 167557 | 976.42 | 710 | 690 | 170.9 |
| D | 13 | 120 | 87108 | 505.67 | 710 | 690 | 170.9 |
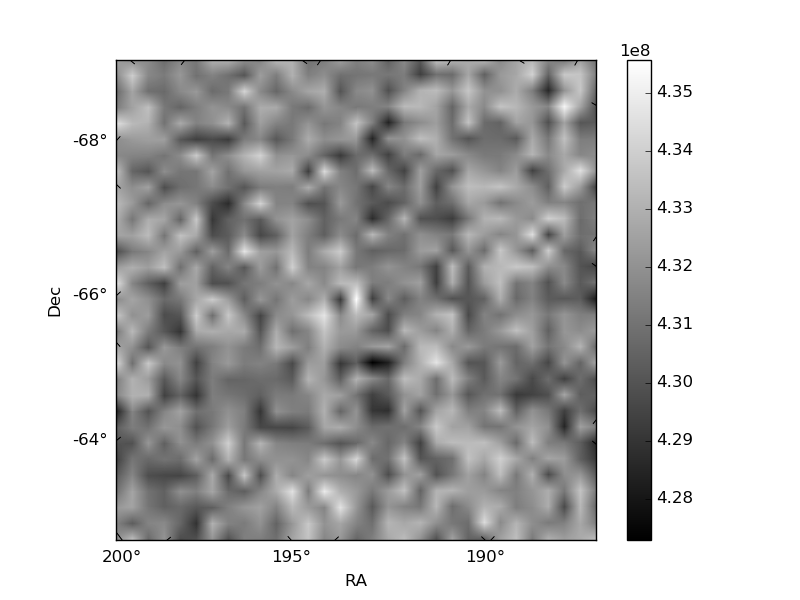
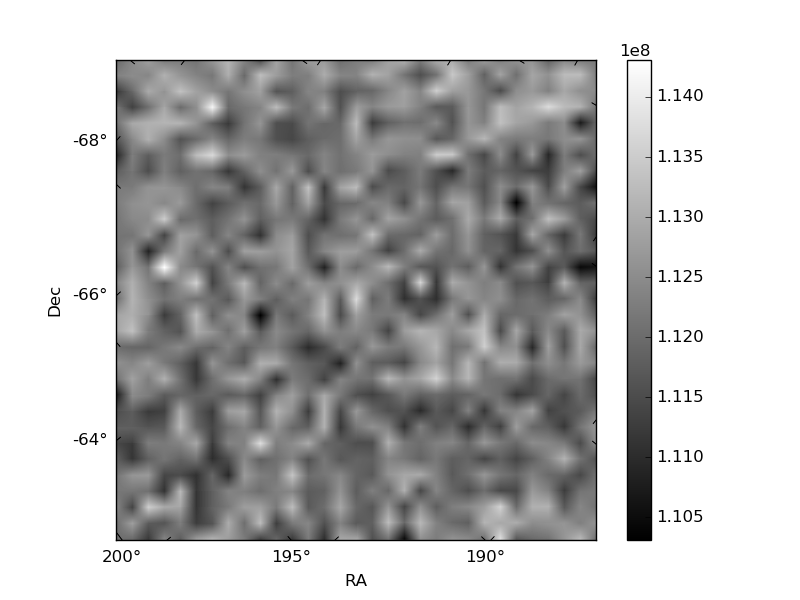
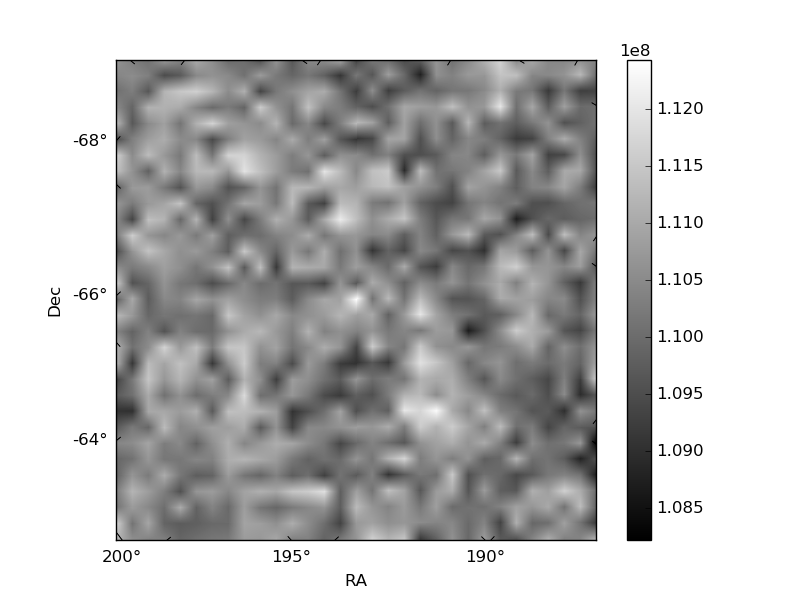
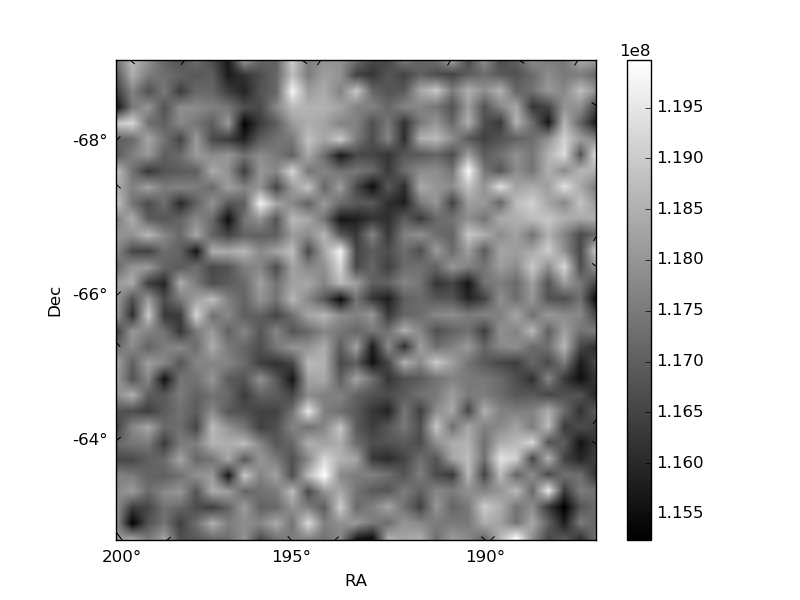
Histogram calculated using DETX and DETY for each event in the final _common_clean file
| Quadrant A | 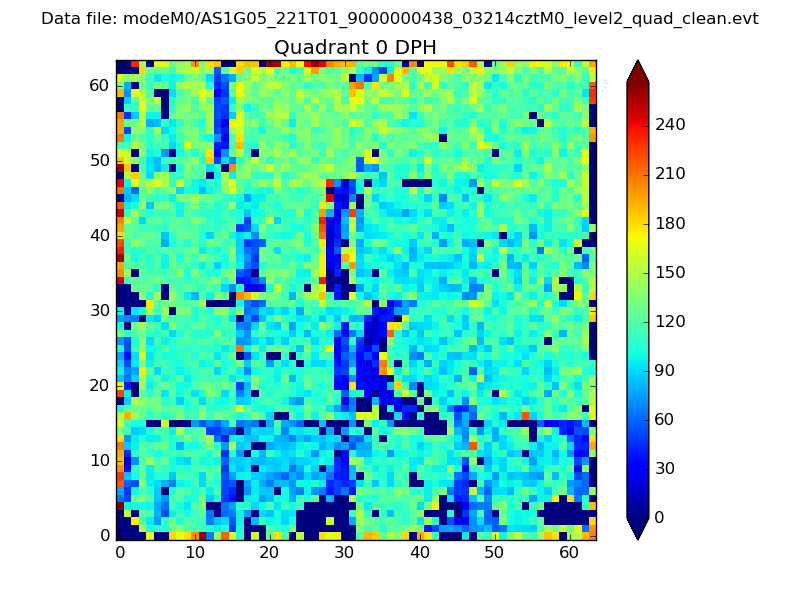 |
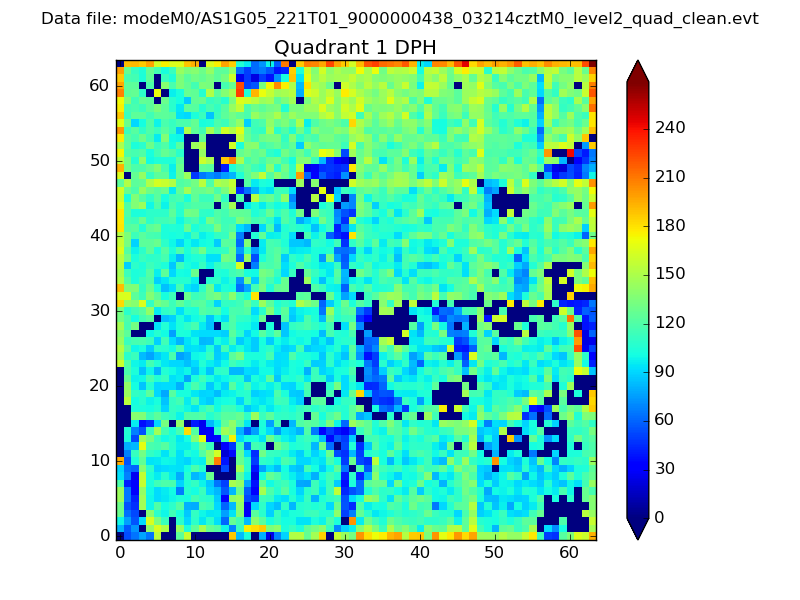 |
Quadrant B |
|---|---|---|---|
| Quadrant D | 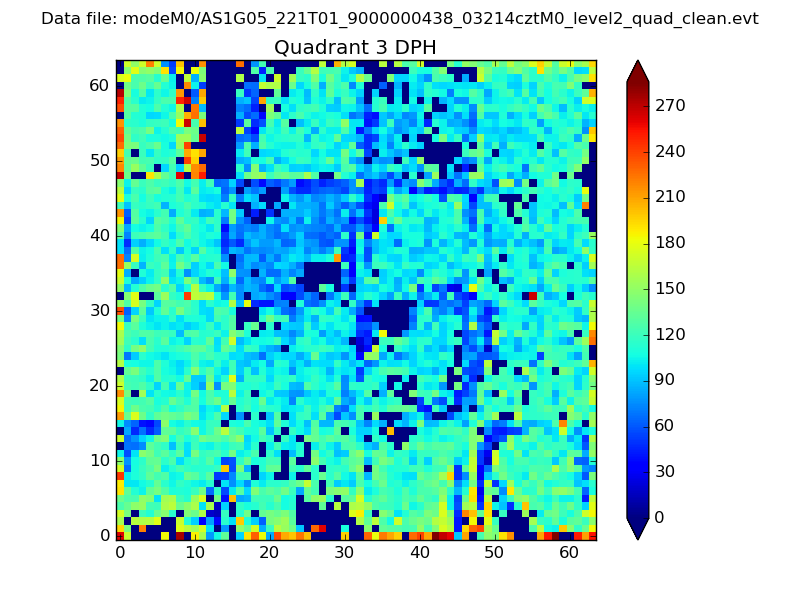 |
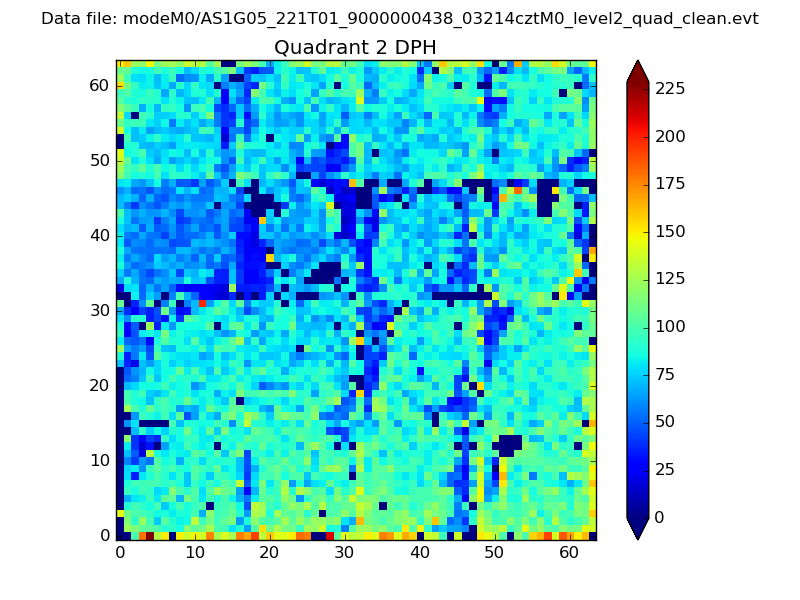 |
Quadrant C |
| Plot type | Count rate plots | Images |
|---|---|---|
| Comparison with Poisson distribution Blue bars denote a histogram of data divided into 1 sec bins. Red curve is a Poisson curve with rate = median count rate of data. |
 |
 |
| Quadrant-wise count rates Data is divided into 100 sec bins |
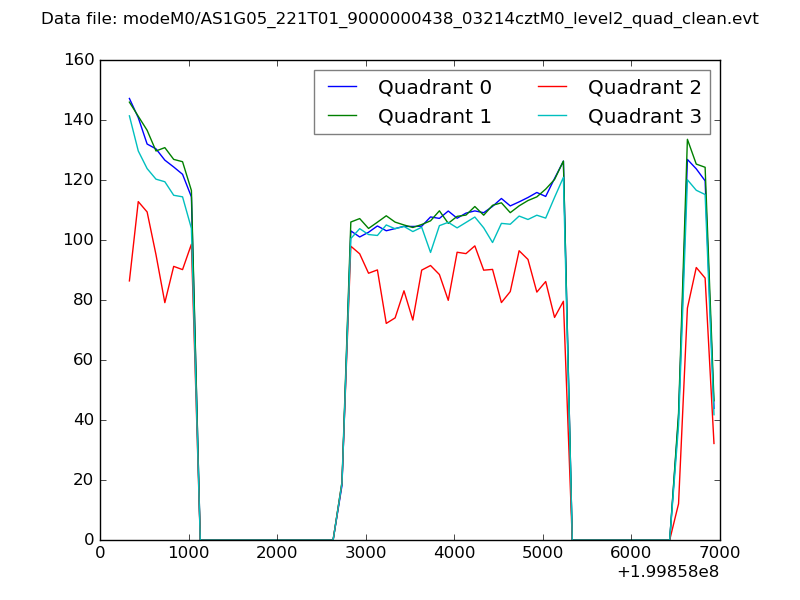 |
|
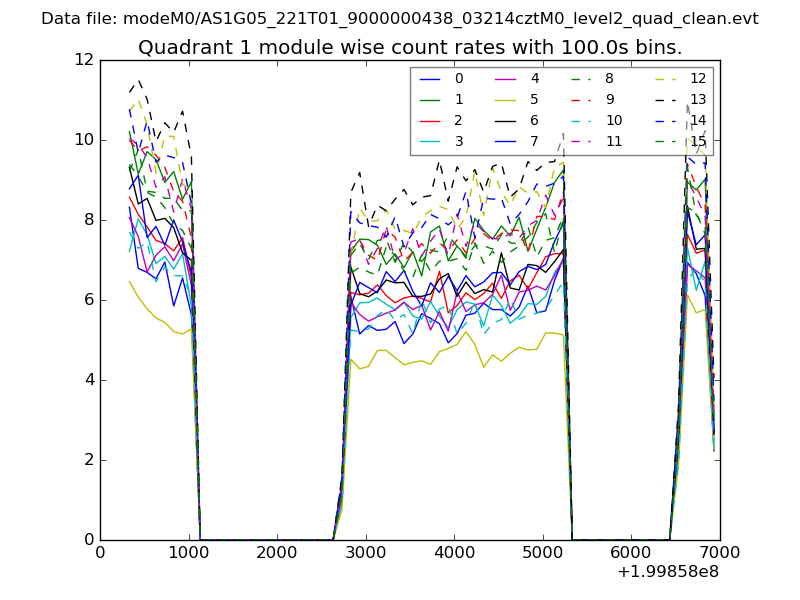
| Module-wise count rates for Quadrant A Data is divided into 100 sec bins |
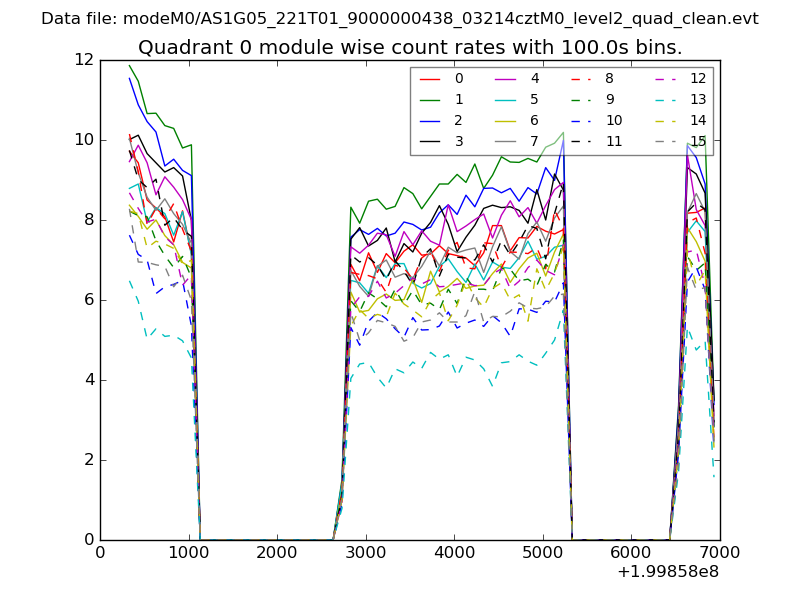 |
 |
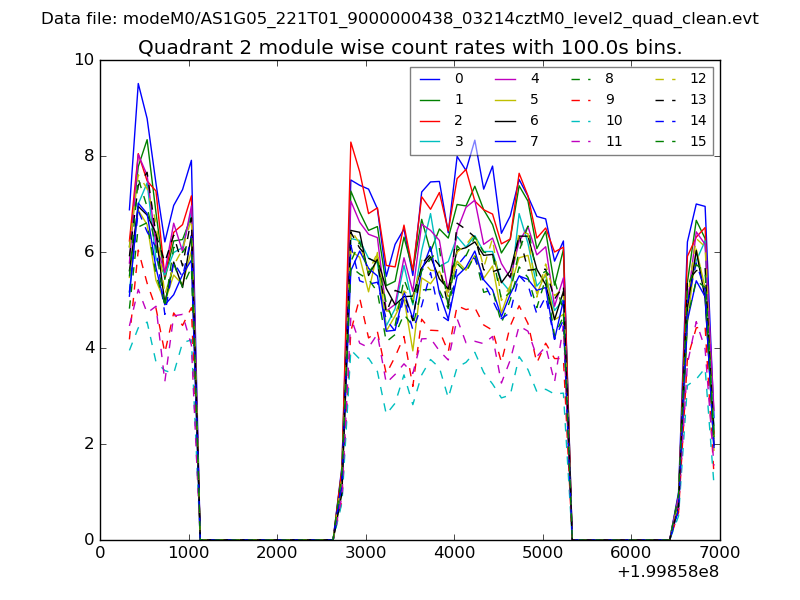
| Module-wise count rates for Quadrant B Data is divided into 100 sec bins |
 |
 |
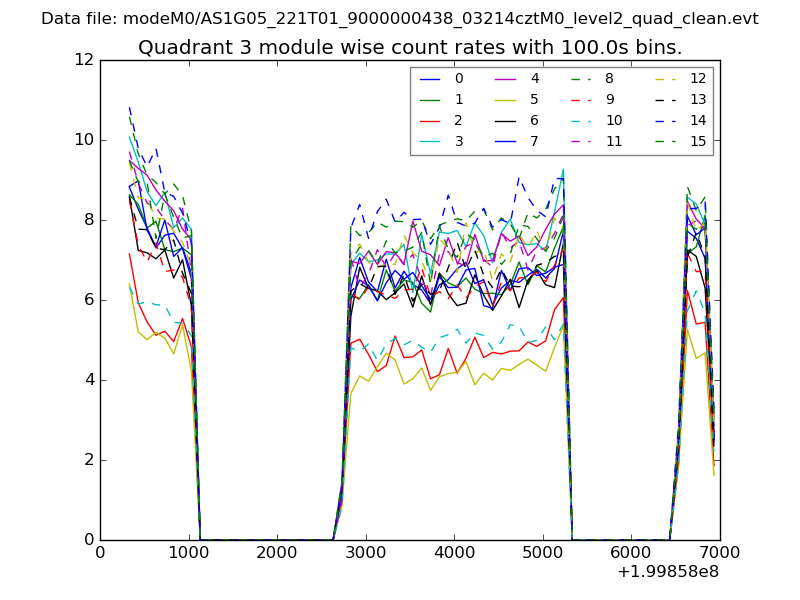
| Module-wise count rates for Quadrant C Data is divided into 100 sec bins |
 |
 |
| Module-wise count rates for Quadrant D Data is divided into 100 sec bins |
 |
 |
| Parameter | Plot |
|---|---|
| CZT HV Monitor | 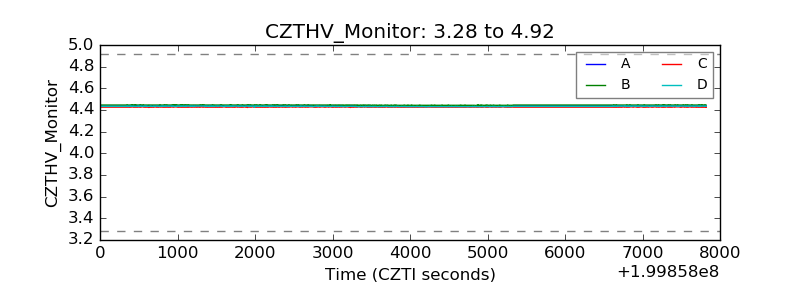 |
| D_VDD |  |
| Temperature 1 | 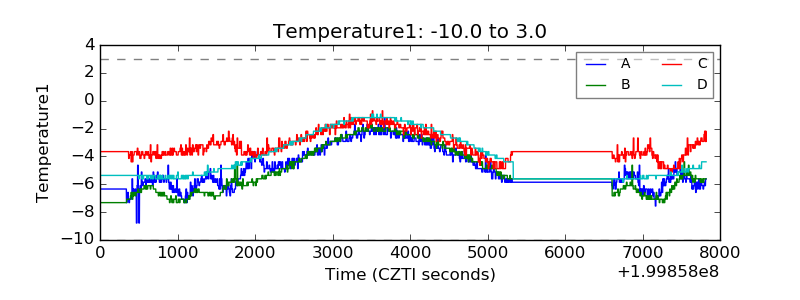 |
| Veto HV Monitor | 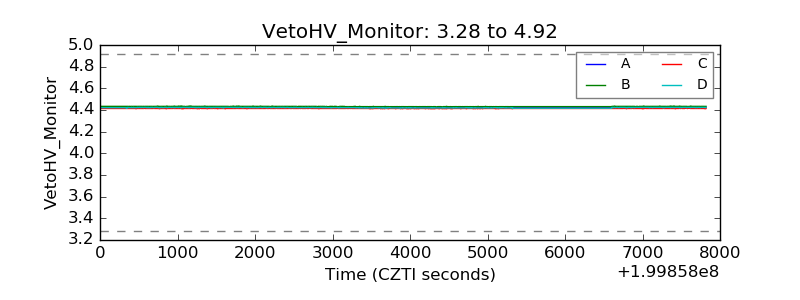 |
| Veto LLD | 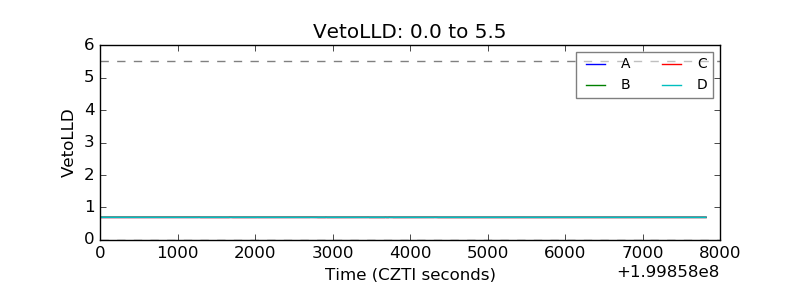 |
| Alpha Counter | 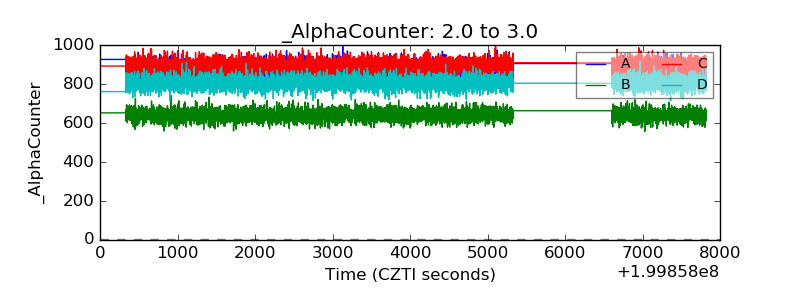 |
| _CPM_Rate | 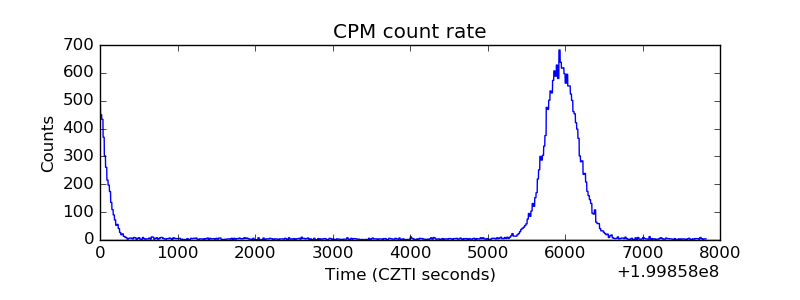 |
| CZT Counter | 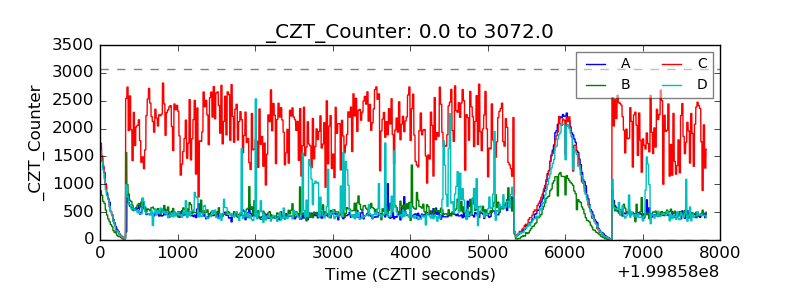 |
| +2.5 Volts monitor |  |
| +5 Volts monitor |  |
| _ROLL_ROT | 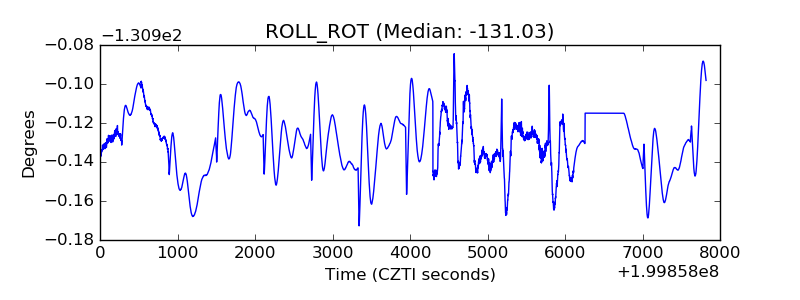 |
| _Roll_DEC | 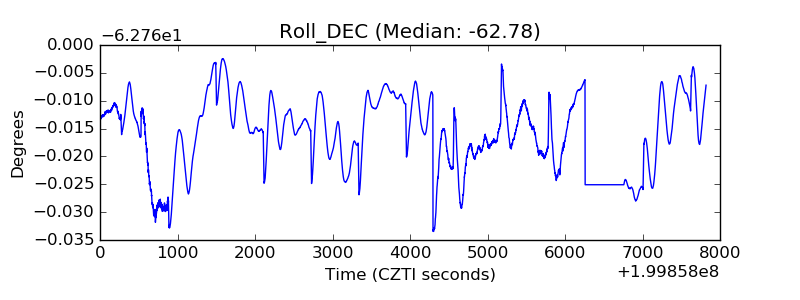 |
| _Roll_RA | 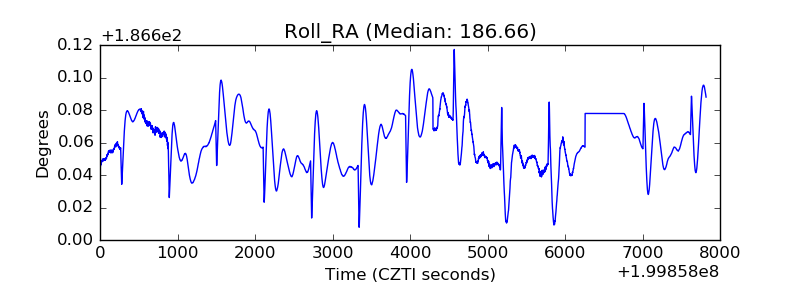 |
| Veto Counter | 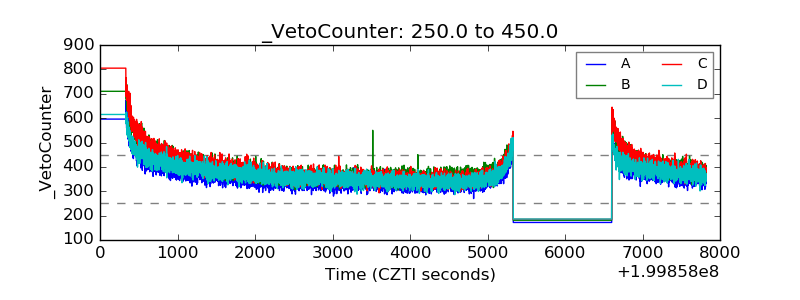 |