| Param | Original file | Final file |
|---|---|---|
| Filename | modeM0/AS1G05_221T01_9000000438_03216cztM0_level2.evt | modeM0/AS1G05_221T01_9000000438_03216cztM0_level2_quad_clean.evt |
| Size (bytes) | 566,225,280 | 87,788,160 |
| Size | 540.0 MB | 83.7 MB |
| Events in quadrant A | 3,722,864 | 529,579 |
| Events in quadrant B | 4,158,041 | 528,851 |
| Events in quadrant C | 4,635,415 | 526,080 |
| Events in quadrant D | 4,084,163 | 513,109 |
| Mode SS | |||
|---|---|---|---|
| Quadrant | BADHDUFLAG | Total packets | Discarded packets |
| A | 0 | 164 | 0 |
| B | 0 | 164 | 0 |
| C | 0 | 164 | 0 |
| D | 0 | 164 | 0 |
| Mode M0 | |||
|---|---|---|---|
| Quadrant | BADHDUFLAG | Total packets | Discarded packets |
| A | 0 | 16821 | 3 |
| B | 0 | 17455 | 2 |
| C | 0 | 19365 | 2 |
| D | 0 | 17964 | 2 |
| Mode M9 | |||
|---|---|---|---|
| Quadrant | BADHDUFLAG | Total packets | Discarded packets |
| A | 0 | 15 | 0 |
| B | 0 | 15 | 0 |
| C | 0 | 15 | 0 |
| D | 0 | 15 | 0 |
| Quadrant | Total seconds | Saturated seconds | Saturation percentage |
|---|---|---|---|
| A | 8060 | 320 | 3.970223% |
| B | 8060 | 350 | 4.342432% |
| C | 8060 | 428 | 5.310174% |
| D | 8060 | 339 | 4.205955% |
Noise dominated data is calculated using 1-second bins in cleaned event files. If a bin has >2000 counts, and if more than 50% of those come from <1% of pixels, then it is considered to be noise-dominated and hence unusable.
| Quadrant | # 1 sec bins | Bins with >0 counts | Bins with >2000 counts | High rate bins dominated by noise | Noise dominated (total time) | Noise dominated (detector-on time) | Marked lightcurve |
|---|---|---|---|---|---|---|---|
| A | 9620 | 8060 | 0 | 0 | 0.00% | 0.00% | 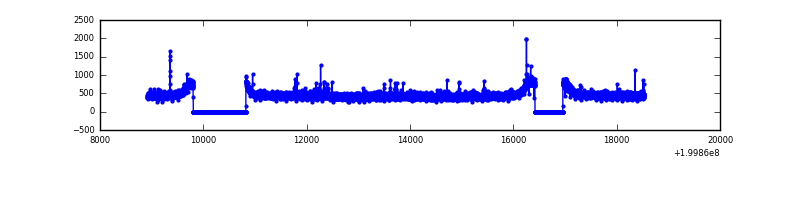 |
| B | 9620 | 8060 | 19 | 19 | 0.20% | 0.24% | 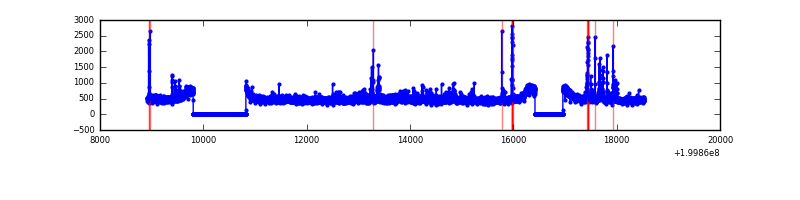 |
| C | 9620 | 8060 | 143 | 143 | 1.49% | 1.77% | 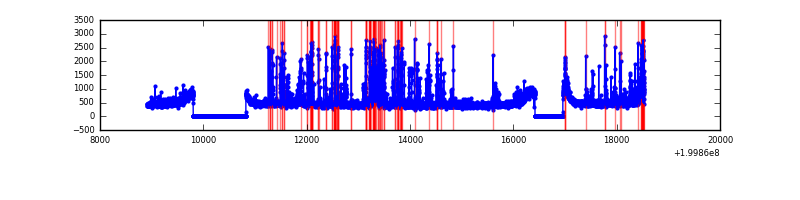 |
| D | 9620 | 8060 | 52 | 52 | 0.54% | 0.65% | 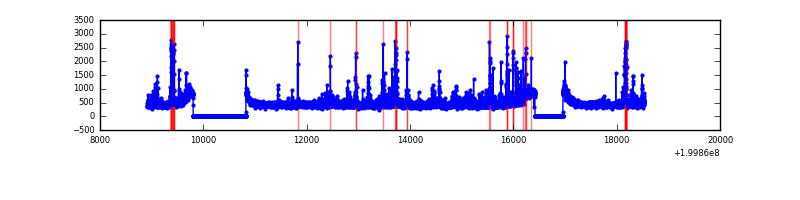 |
Top three noisy pixels from each quadrant. If the there are fewer than three noisy pixels in the level2.evt file, extra rows are filled as -1
| Pixel properties | Quadrant properties | ||||||
|---|---|---|---|---|---|---|---|
| Quadrant | DetID | PixID | Counts | Sigma | Mean | Median | Sigma |
| A | 0 | 118 | 18452 | 89.41 | 951 | 926 | 196.0 |
| A | 0 | 226 | 12416 | 58.62 | 951 | 926 | 196.0 |
| A | 0 | 199 | 11650 | 54.71 | 951 | 926 | 196.0 |
| B | 2 | 249 | 165374 | 880.69 | 965 | 938 | 186.7 |
| B | 15 | 204 | 156139 | 831.23 | 965 | 938 | 186.7 |
| B | 1 | 223 | 37686 | 196.82 | 965 | 938 | 186.7 |
| C | 15 | 208 | 442448 | 2061.24 | 925 | 927 | 214.2 |
| C | 1 | 192 | 407274 | 1897.03 | 925 | 927 | 214.2 |
| C | 14 | 223 | 84246 | 388.97 | 925 | 927 | 214.2 |
| D | 13 | 223 | 152705 | 679.7 | 923 | 890 | 223.4 |
| D | 5 | 233 | 125775 | 559.13 | 923 | 890 | 223.4 |
| D | 13 | 120 | 110542 | 490.93 | 923 | 890 | 223.4 |
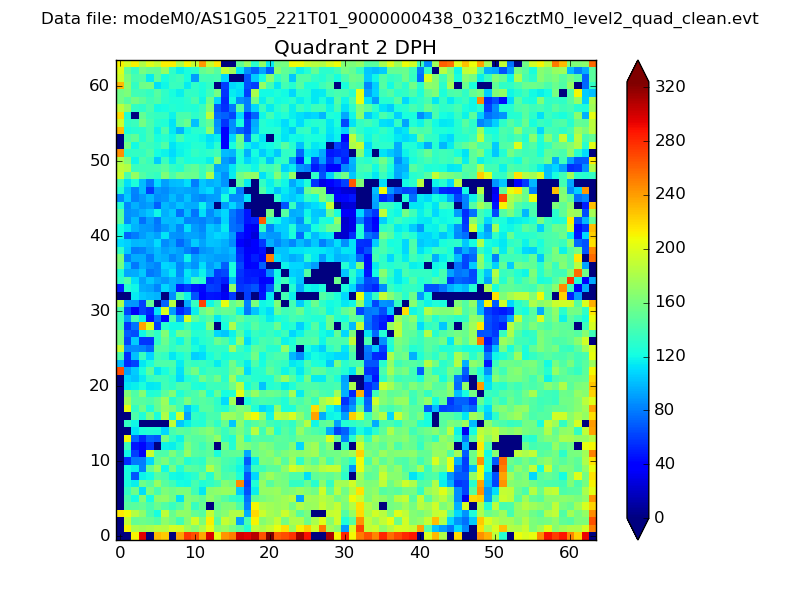
Histogram calculated using DETX and DETY for each event in the final _common_clean file
| Quadrant A | 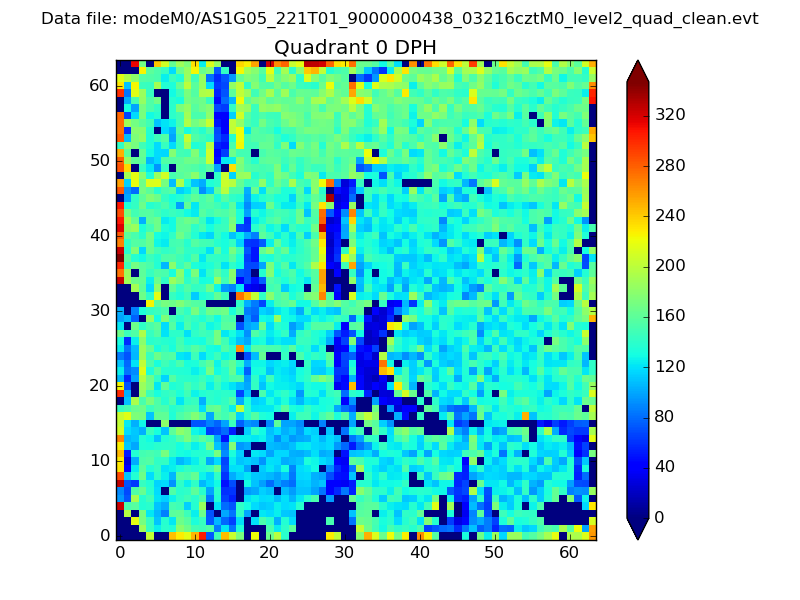 |
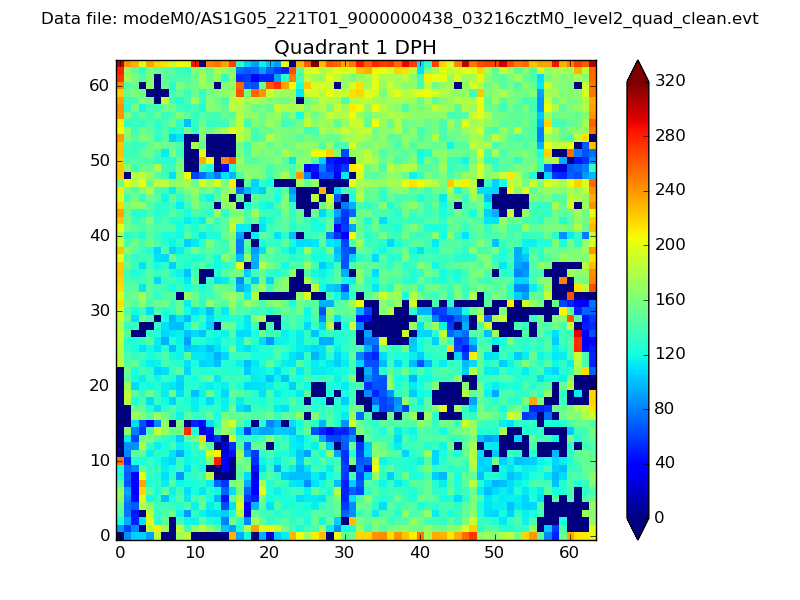 |
Quadrant B |
|---|---|---|---|
| Quadrant D | 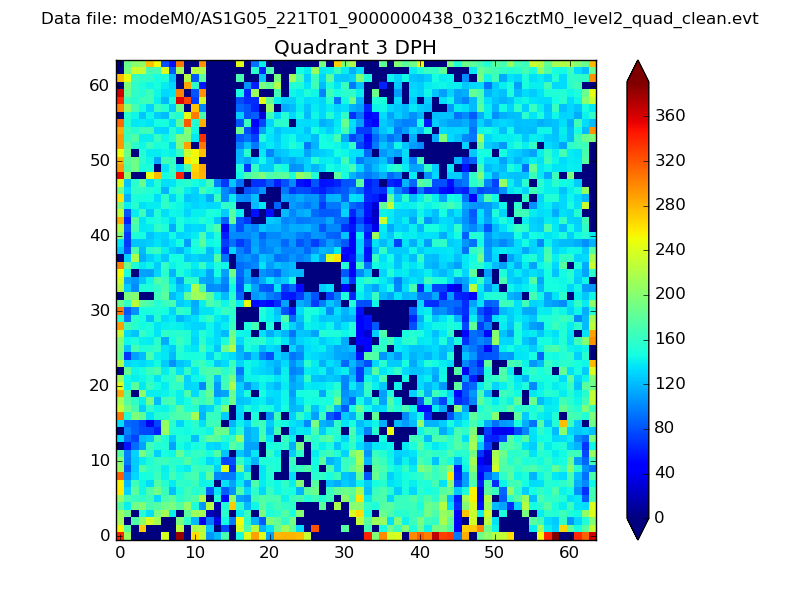 |
 |
Quadrant C |
| Plot type | Count rate plots | Images |
|---|---|---|
| Comparison with Poisson distribution Blue bars denote a histogram of data divided into 1 sec bins. Red curve is a Poisson curve with rate = median count rate of data. |
 |
 |
| Quadrant-wise count rates Data is divided into 100 sec bins |
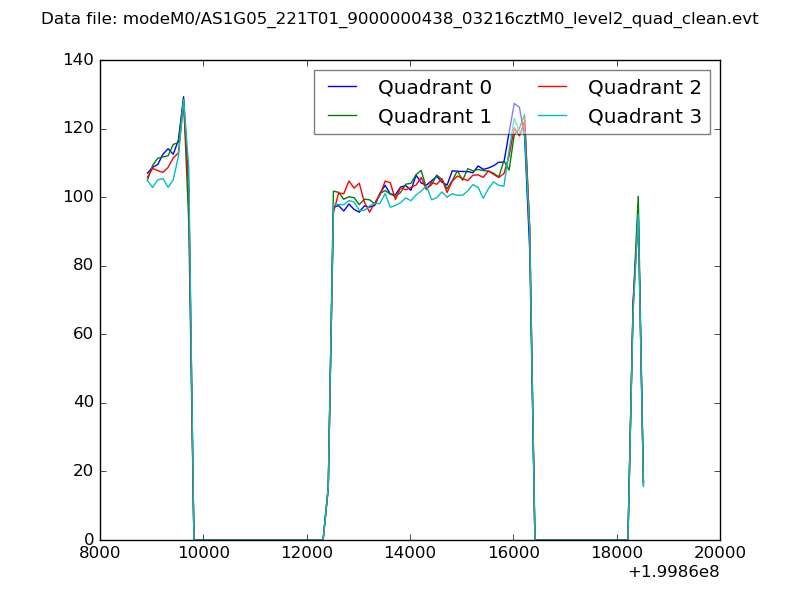 |
|
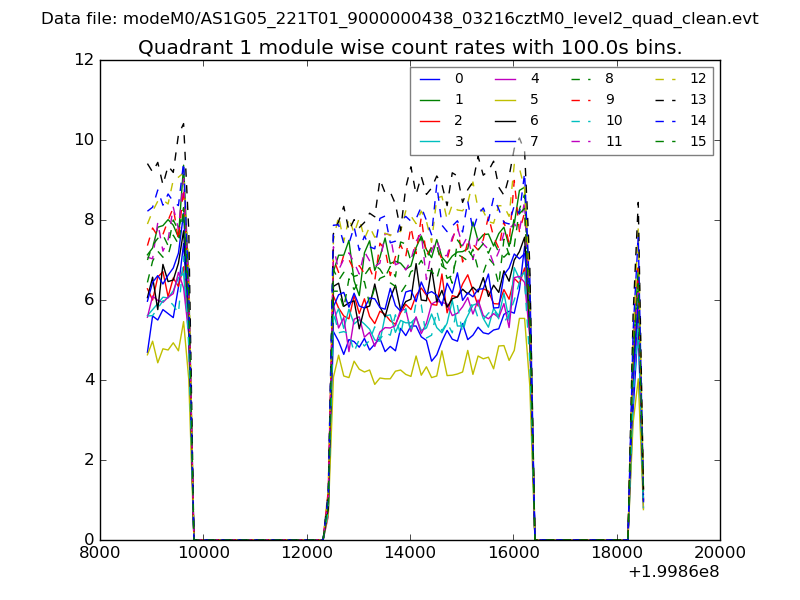
| Module-wise count rates for Quadrant A Data is divided into 100 sec bins |
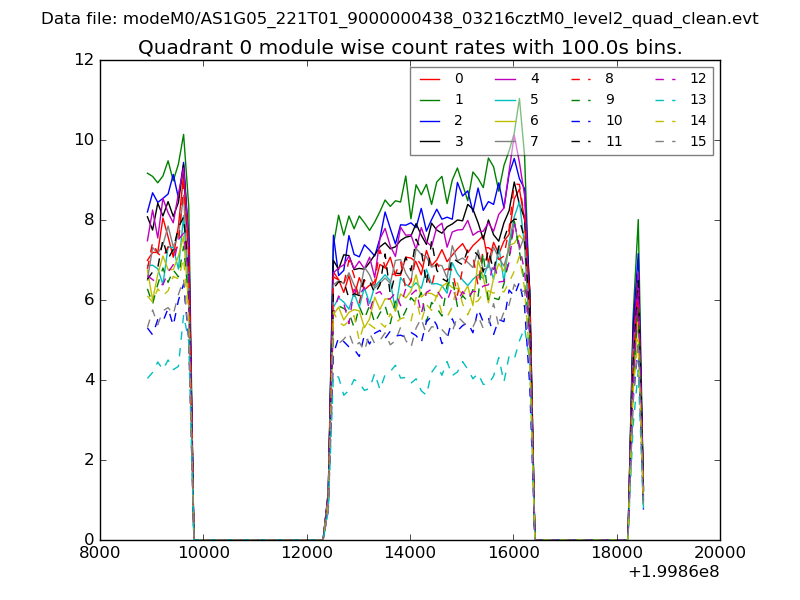 |
 |
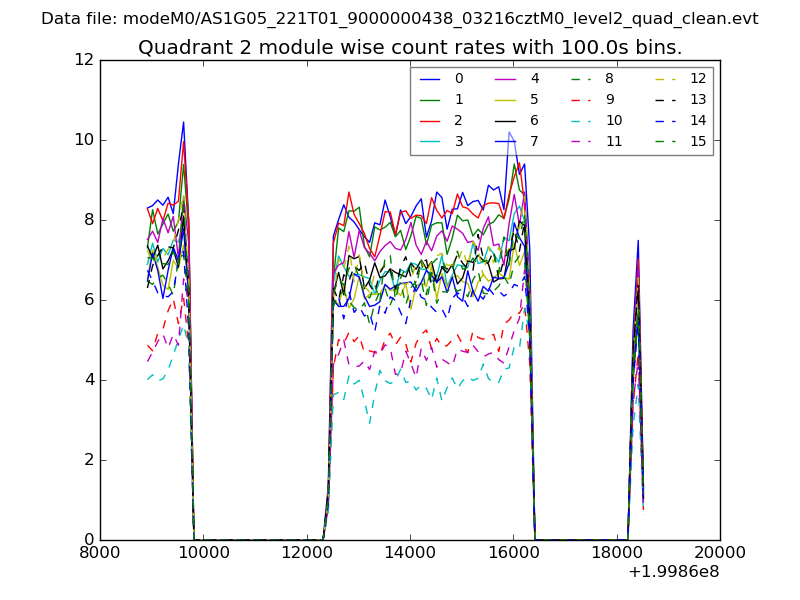
| Module-wise count rates for Quadrant B Data is divided into 100 sec bins |
 |
 |
| Module-wise count rates for Quadrant C Data is divided into 100 sec bins |
 |
 |
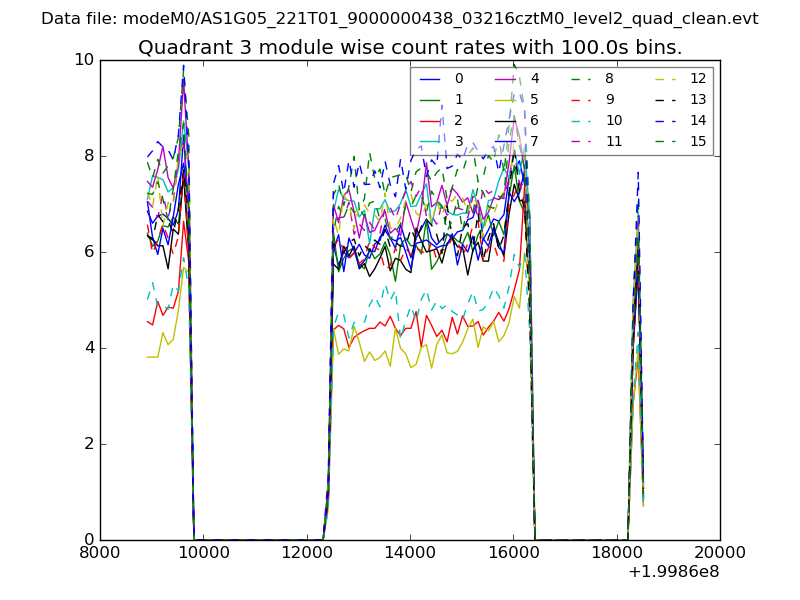
| Module-wise count rates for Quadrant D Data is divided into 100 sec bins |
 |
 |
| Parameter | Plot |
|---|---|
| CZT HV Monitor | 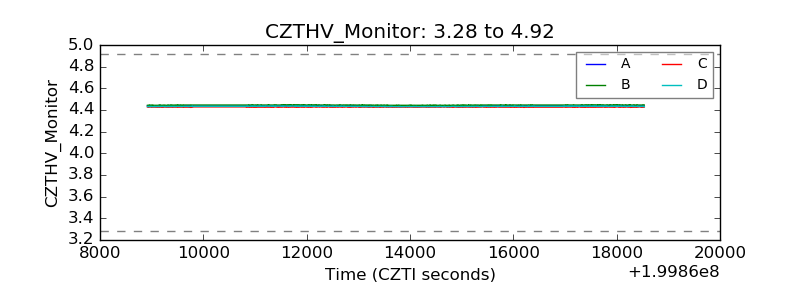 |
| D_VDD |  |
| Temperature 1 | 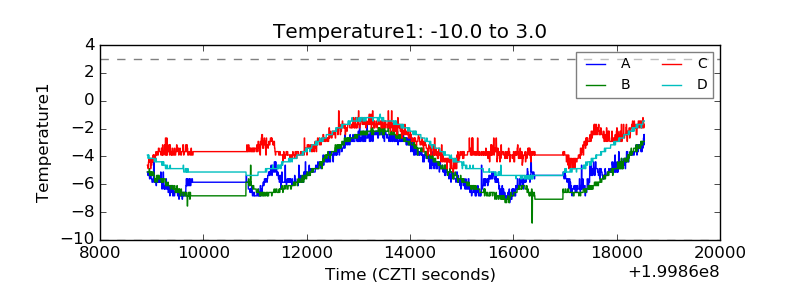 |
| Veto HV Monitor | 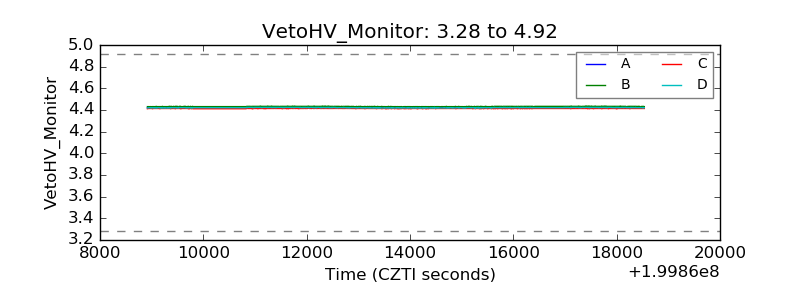 |
| Veto LLD | 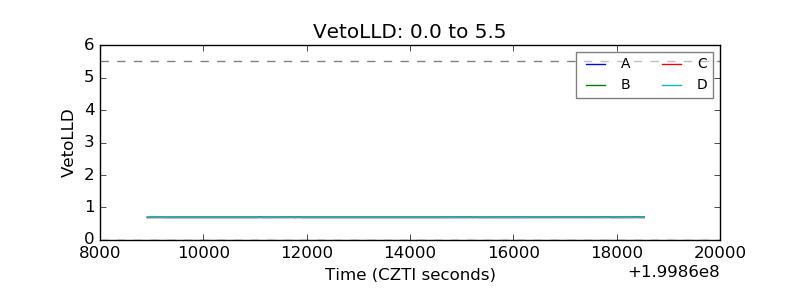 |
| Alpha Counter | 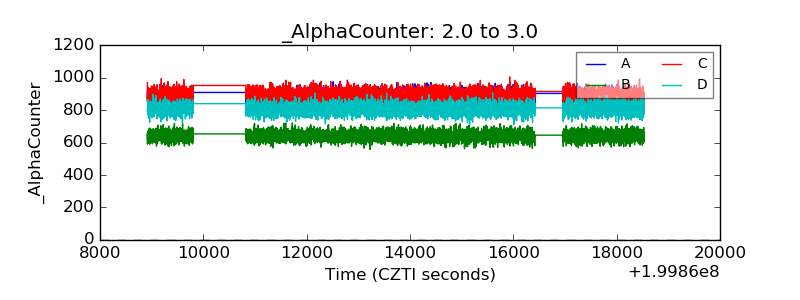 |
| _CPM_Rate | 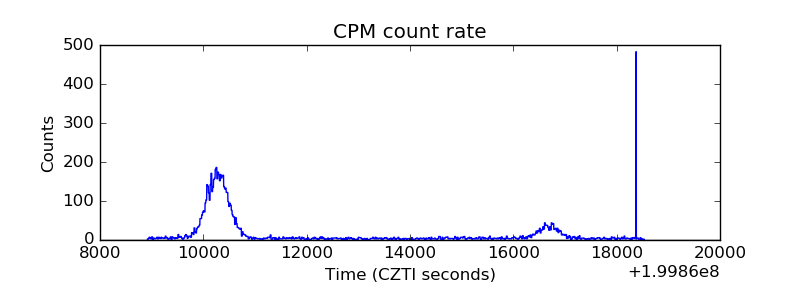 |
| CZT Counter | 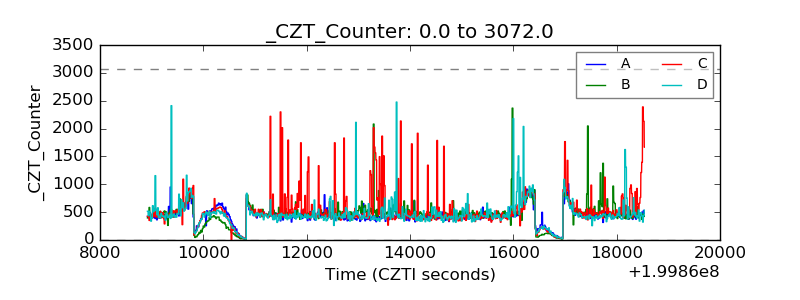 |
| +2.5 Volts monitor |  |
| +5 Volts monitor |  |
| _ROLL_ROT | 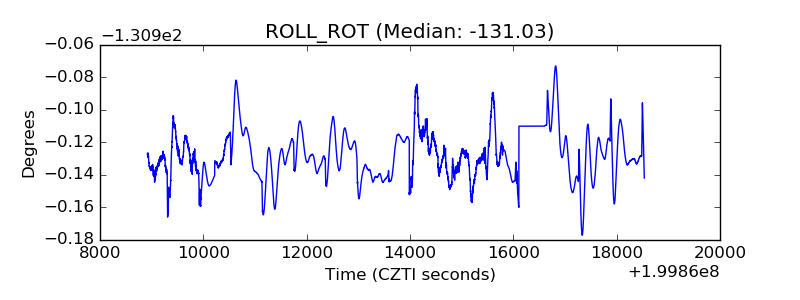 |
| _Roll_DEC | 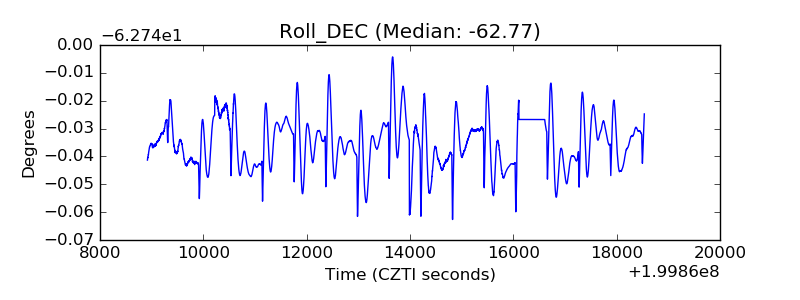 |
| _Roll_RA | 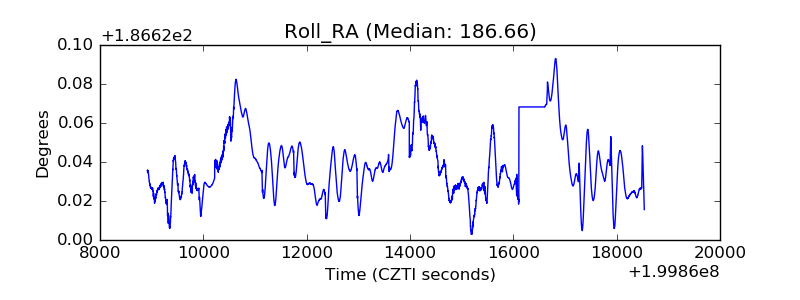 |
| Veto Counter | 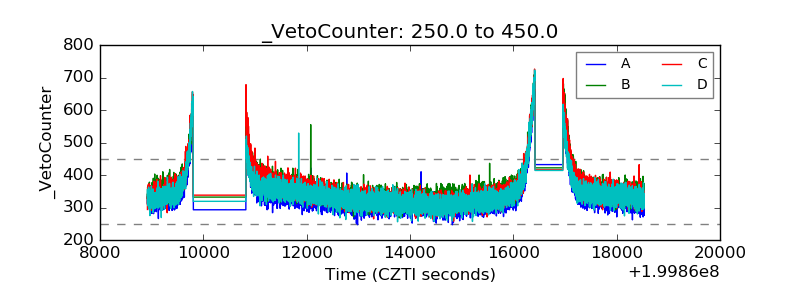 |