| Param | Original file | Final file |
|---|---|---|
| Filename | modeM0/AS1G05_221T01_9000000438_03221cztM0_level2.evt | modeM0/AS1G05_221T01_9000000438_03221cztM0_level2_quad_clean.evt |
| Size (bytes) | 559,969,920 | 97,977,600 |
| Size | 534.0 MB | 93.4 MB |
| Events in quadrant A | 3,717,142 | 606,883 |
| Events in quadrant B | 4,342,015 | 609,612 |
| Events in quadrant C | 4,402,340 | 605,876 |
| Events in quadrant D | 3,954,191 | 588,738 |
| Mode SS | |||
|---|---|---|---|
| Quadrant | BADHDUFLAG | Total packets | Discarded packets |
| A | 0 | 160 | 0 |
| B | 0 | 160 | 0 |
| C | 0 | 160 | 0 |
| D | 0 | 160 | 0 |
| Mode M0 | |||
|---|---|---|---|
| Quadrant | BADHDUFLAG | Total packets | Discarded packets |
| A | 0 | 16873 | 1 |
| B | 0 | 18028 | 0 |
| C | 0 | 18890 | 0 |
| D | 0 | 17718 | 0 |
| Quadrant | Total seconds | Saturated seconds | Saturation percentage |
|---|---|---|---|
| A | 8000 | 224 | 2.800000% |
| B | 8000 | 222 | 2.775000% |
| C | 8000 | 194 | 2.425000% |
| D | 8000 | 135 | 1.687500% |
Noise dominated data is calculated using 1-second bins in cleaned event files. If a bin has >2000 counts, and if more than 50% of those come from <1% of pixels, then it is considered to be noise-dominated and hence unusable.
| Quadrant | # 1 sec bins | Bins with >0 counts | Bins with >2000 counts | High rate bins dominated by noise | Noise dominated (total time) | Noise dominated (detector-on time) | Marked lightcurve |
|---|---|---|---|---|---|---|---|
| A | 8000 | 8000 | 40 | 40 | 0.50% | 0.50% | 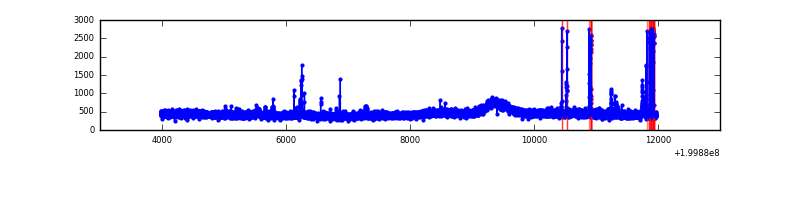 |
| B | 8000 | 8000 | 13 | 13 | 0.16% | 0.16% | 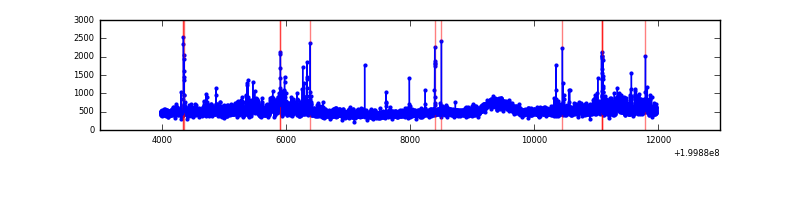 |
| C | 8000 | 8000 | 61 | 61 | 0.76% | 0.76% | 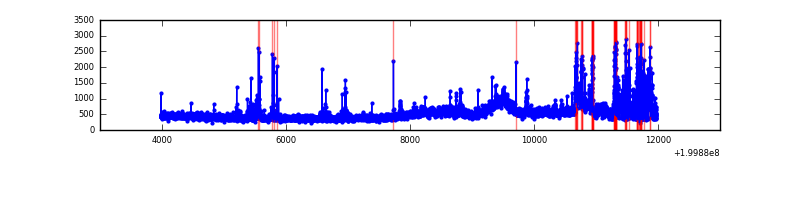 |
| D | 8000 | 8000 | 40 | 40 | 0.50% | 0.50% | 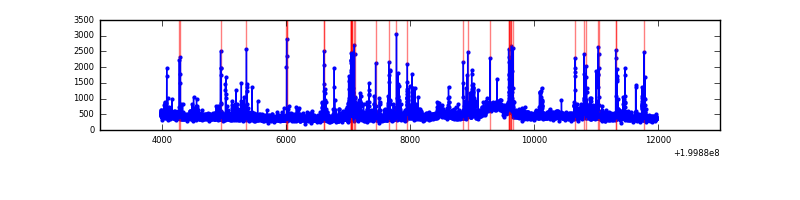 |
Top three noisy pixels from each quadrant. If the there are fewer than three noisy pixels in the level2.evt file, extra rows are filled as -1
| Pixel properties | Quadrant properties | ||||||
|---|---|---|---|---|---|---|---|
| Quadrant | DetID | PixID | Counts | Sigma | Mean | Median | Sigma |
| A | 0 | 199 | 142935 | 757.48 | 904 | 881 | 187.5 |
| A | 0 | 118 | 47002 | 245.93 | 904 | 881 | 187.5 |
| A | 0 | 226 | 27299 | 140.87 | 904 | 881 | 187.5 |
| B | 15 | 204 | 568475 | 3197.34 | 917 | 893 | 177.5 |
| B | 2 | 249 | 77459 | 431.32 | 917 | 893 | 177.5 |
| B | 1 | 223 | 71306 | 396.66 | 917 | 893 | 177.5 |
| C | 1 | 192 | 853335 | 4162.31 | 877 | 881 | 204.8 |
| C | 6 | 80 | 66337 | 319.6 | 877 | 881 | 204.8 |
| C | 14 | 223 | 43851 | 209.81 | 877 | 881 | 204.8 |
| D | 13 | 223 | 255966 | 1194.0 | 877 | 848 | 213.7 |
| D | 13 | 120 | 163382 | 760.69 | 877 | 848 | 213.7 |
| D | 5 | 233 | 91790 | 425.62 | 877 | 848 | 213.7 |
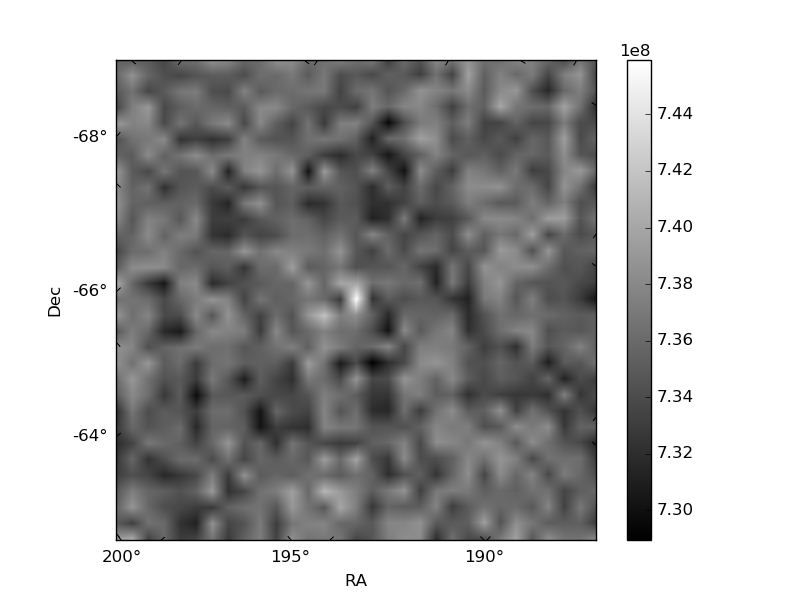
Histogram calculated using DETX and DETY for each event in the final _common_clean file
| Quadrant A | 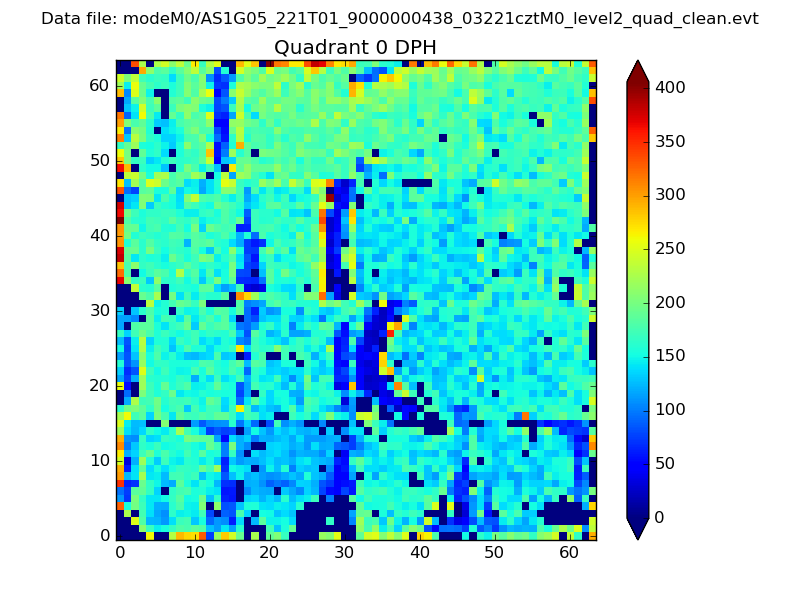 |
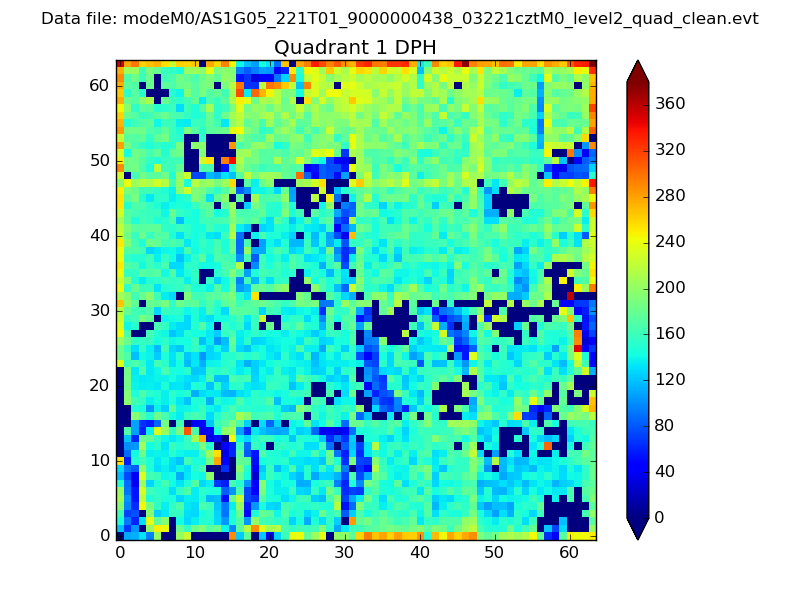 |
Quadrant B |
|---|---|---|---|
| Quadrant D | 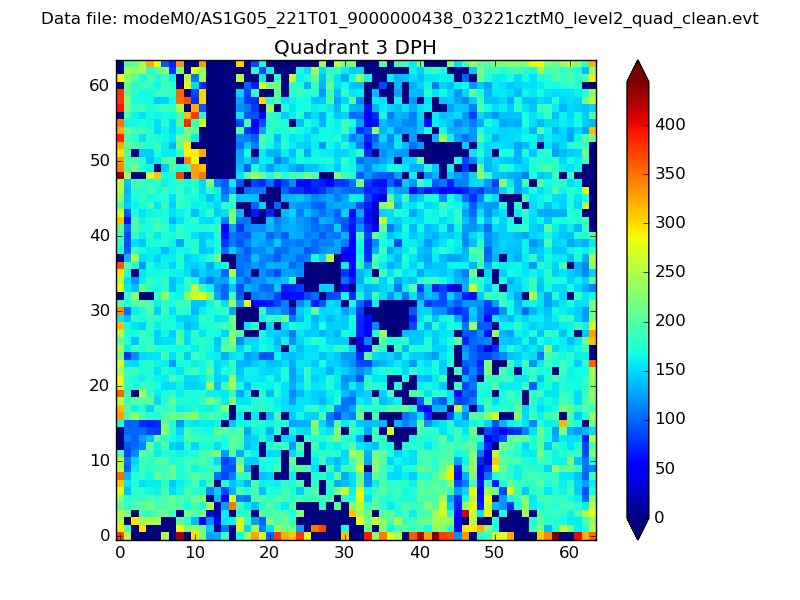 |
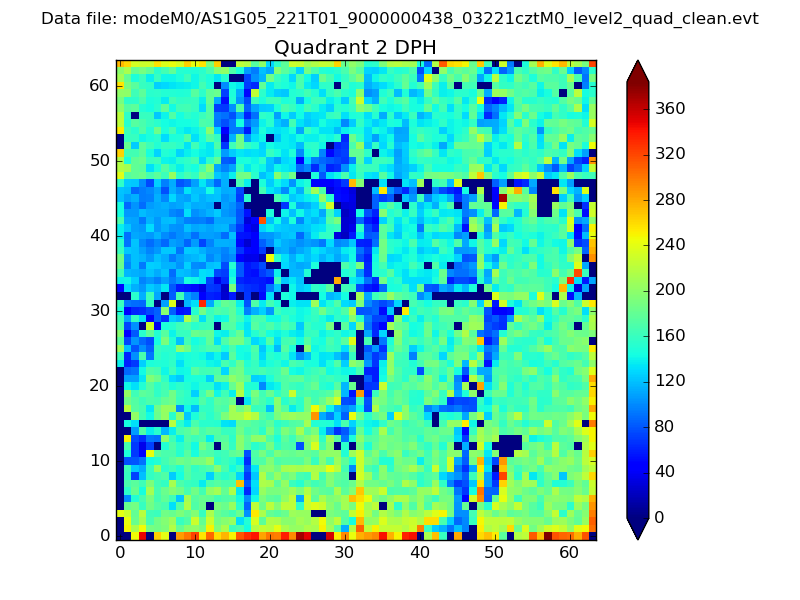 |
Quadrant C |
| Plot type | Count rate plots | Images |
|---|---|---|
| Comparison with Poisson distribution Blue bars denote a histogram of data divided into 1 sec bins. Red curve is a Poisson curve with rate = median count rate of data. |
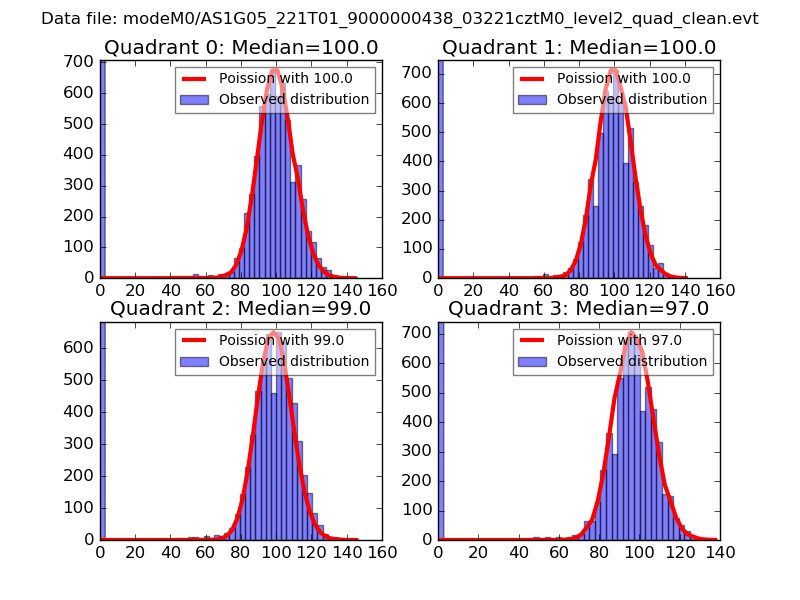 |
 |
| Quadrant-wise count rates Data is divided into 100 sec bins |
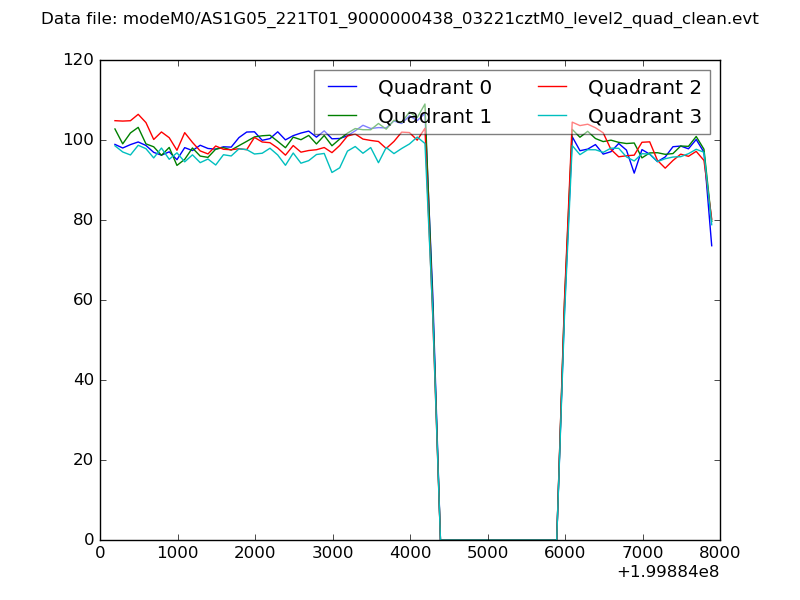 |
|
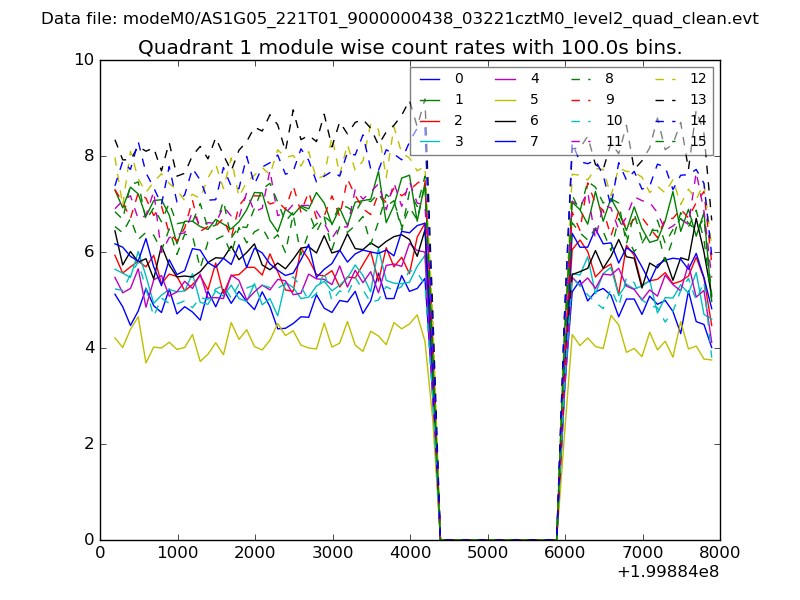
| Module-wise count rates for Quadrant A Data is divided into 100 sec bins |
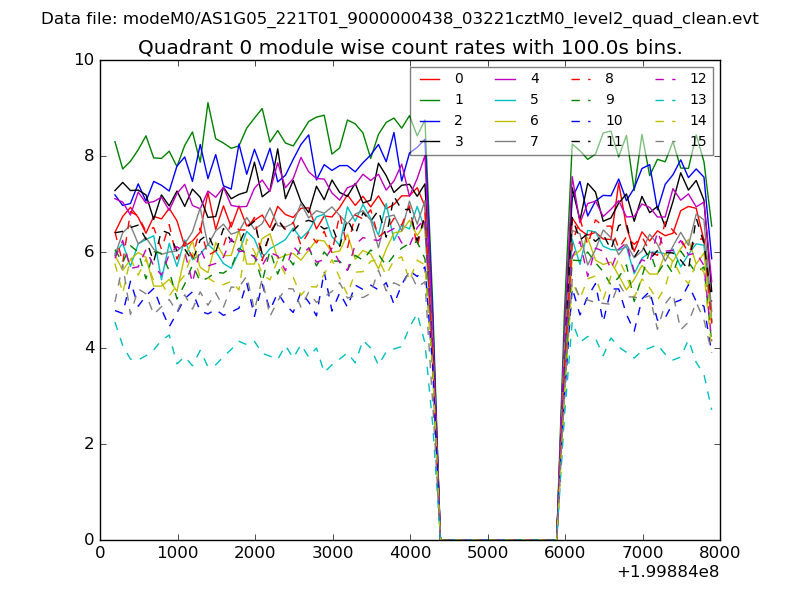 |
 |
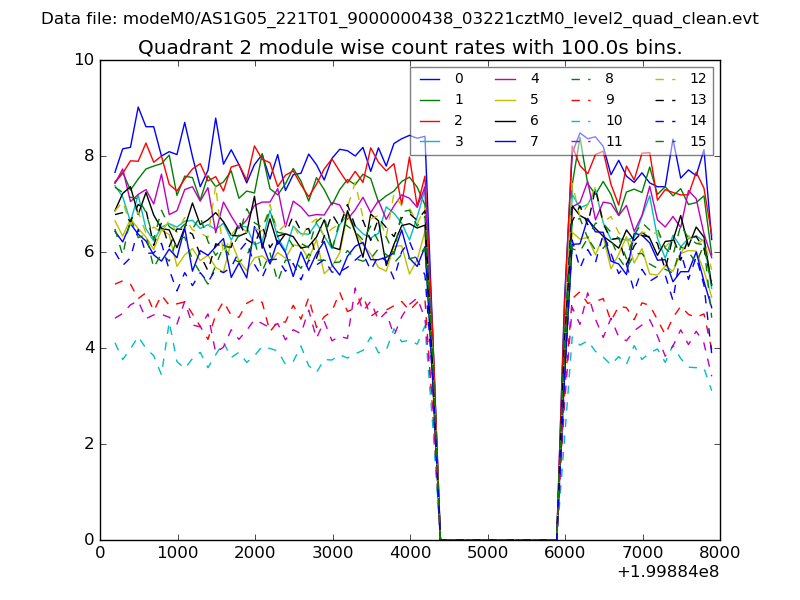
| Module-wise count rates for Quadrant B Data is divided into 100 sec bins |
 |
 |
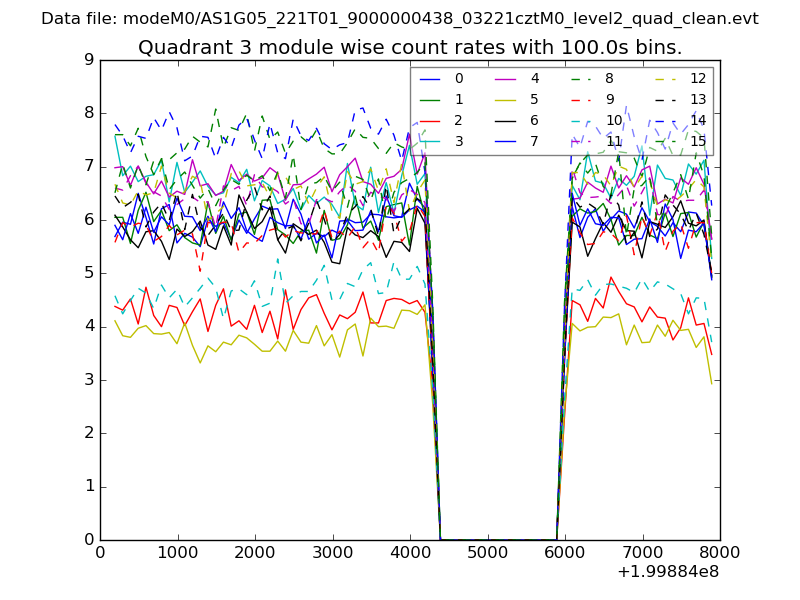
| Module-wise count rates for Quadrant C Data is divided into 100 sec bins |
 |
 |
| Module-wise count rates for Quadrant D Data is divided into 100 sec bins |
 |
 |
| Parameter | Plot |
|---|---|
| CZT HV Monitor | 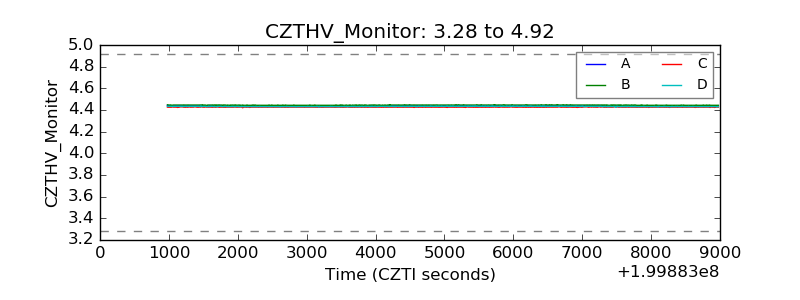 |
| D_VDD | 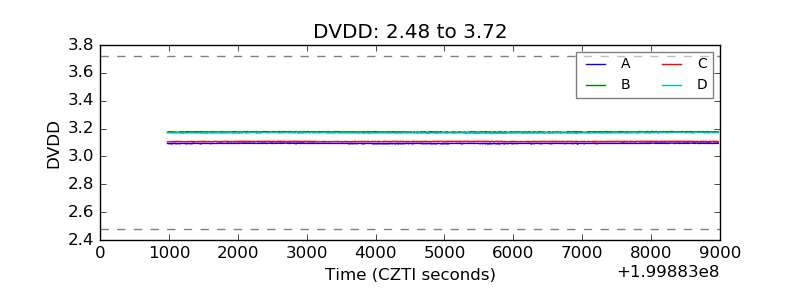 |
| Temperature 1 | 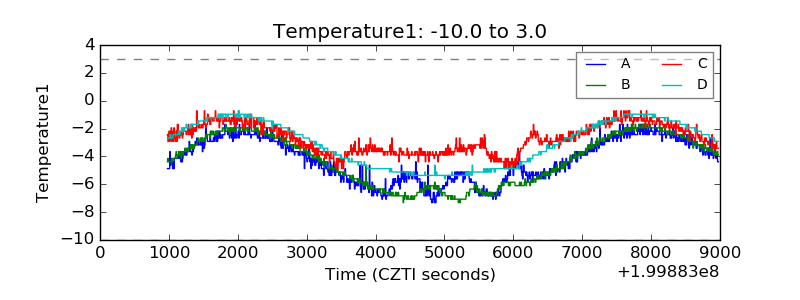 |
| Veto HV Monitor | 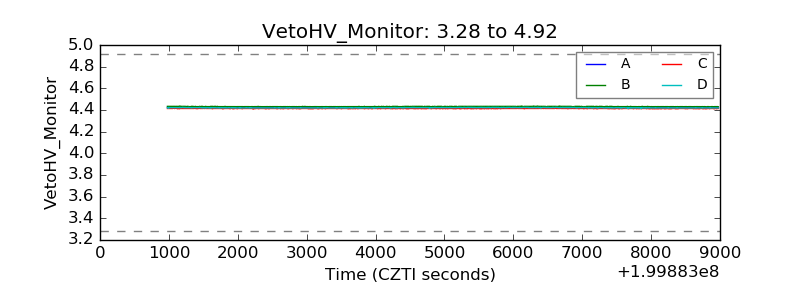 |
| Veto LLD | 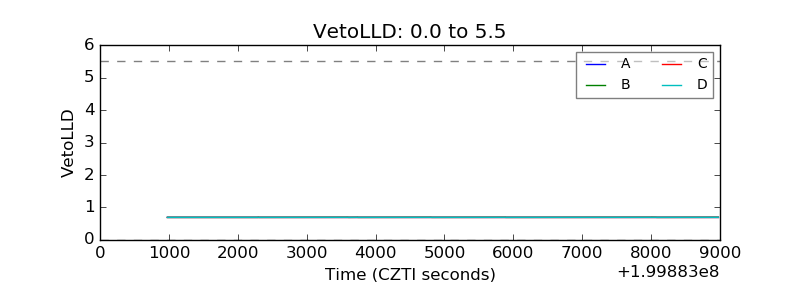 |
| Alpha Counter | 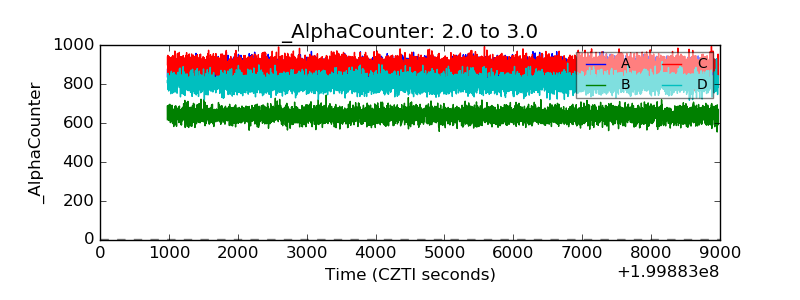 |
| _CPM_Rate | 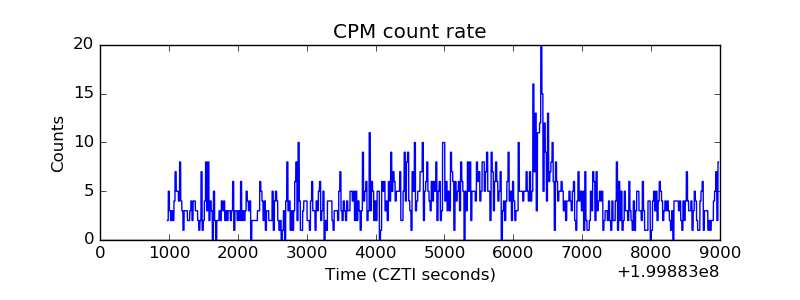 |
| CZT Counter | 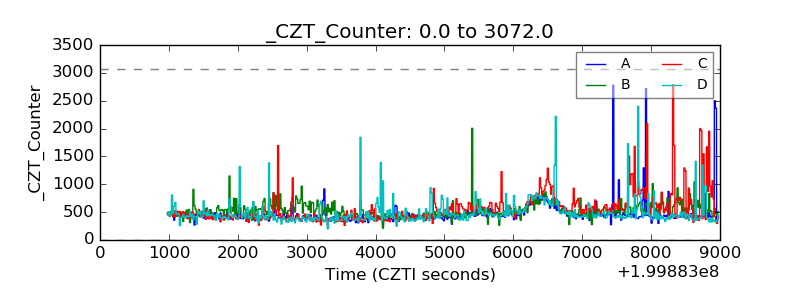 |
| +2.5 Volts monitor | 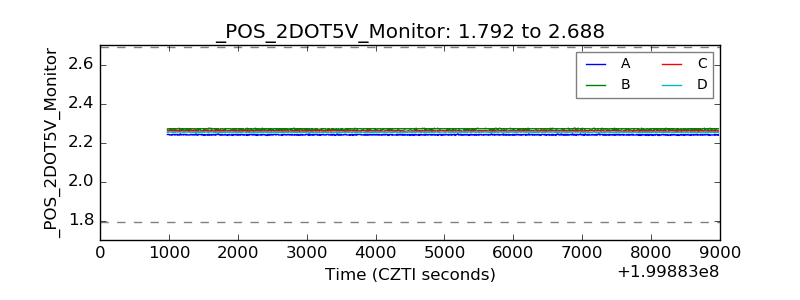 |
| +5 Volts monitor |  |
| _ROLL_ROT | 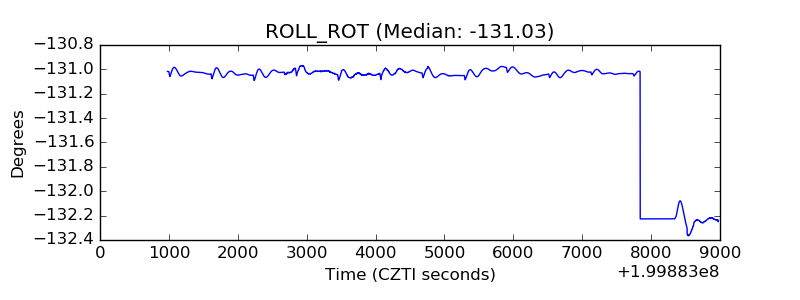 |
| _Roll_DEC | 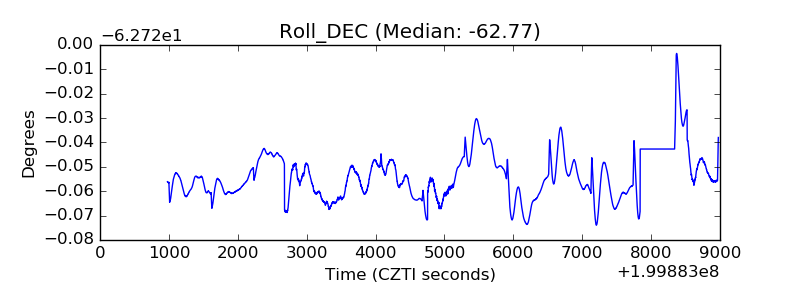 |
| _Roll_RA |  |
| Veto Counter | 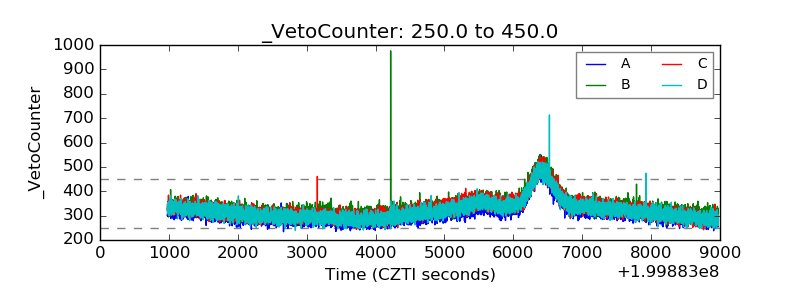 |