| Param | Original file | Final file |
|---|---|---|
| Filename | modeM0/AS1G05_221T01_9000000438_03223cztM0_level2.evt | modeM0/AS1G05_221T01_9000000438_03223cztM0_level2_quad_clean.evt |
| Size (bytes) | 536,515,200 | 90,362,880 |
| Size | 511.7 MB | 86.2 MB |
| Events in quadrant A | 4,318,044 | 574,798 |
| Events in quadrant B | 3,696,055 | 576,411 |
| Events in quadrant C | 4,463,459 | 558,973 |
| Events in quadrant D | 3,305,379 | 547,884 |
| Mode SS | |||
|---|---|---|---|
| Quadrant | BADHDUFLAG | Total packets | Discarded packets |
| A | 0 | 138 | 0 |
| B | 0 | 138 | 0 |
| C | 0 | 138 | 0 |
| D | 0 | 138 | 0 |
| Mode M0 | |||
|---|---|---|---|
| Quadrant | BADHDUFLAG | Total packets | Discarded packets |
| A | 0 | 17678 | 2 |
| B | 0 | 15626 | 1 |
| C | 0 | 18262 | 1 |
| D | 0 | 14933 | 1 |
| Mode M9 | |||
|---|---|---|---|
| Quadrant | BADHDUFLAG | Total packets | Discarded packets |
| A | 0 | 16 | 0 |
| B | 0 | 16 | 0 |
| C | 0 | 16 | 0 |
| D | 0 | 17 | 0 |
| Quadrant | Total seconds | Saturated seconds | Saturation percentage |
|---|---|---|---|
| A | 6868 | 210 | 3.057659% |
| B | 6868 | 78 | 1.135702% |
| C | 6868 | 196 | 2.853815% |
| D | 6868 | 61 | 0.888177% |
Noise dominated data is calculated using 1-second bins in cleaned event files. If a bin has >2000 counts, and if more than 50% of those come from <1% of pixels, then it is considered to be noise-dominated and hence unusable.
| Quadrant | # 1 sec bins | Bins with >0 counts | Bins with >2000 counts | High rate bins dominated by noise | Noise dominated (total time) | Noise dominated (detector-on time) | Marked lightcurve |
|---|---|---|---|---|---|---|---|
| A | 7868 | 6869 | 146 | 146 | 1.86% | 2.13% | 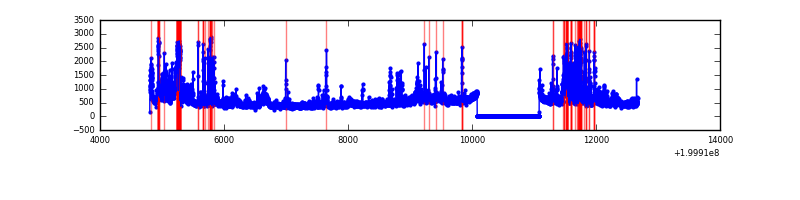 |
| B | 7868 | 6868 | 49 | 49 | 0.62% | 0.71% | 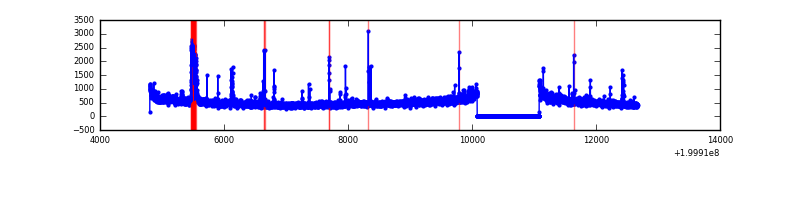 |
| C | 7868 | 6869 | 181 | 181 | 2.30% | 2.64% | 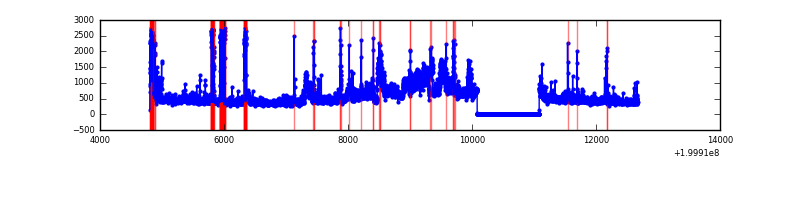 |
| D | 7868 | 6869 | 51 | 51 | 0.65% | 0.74% | 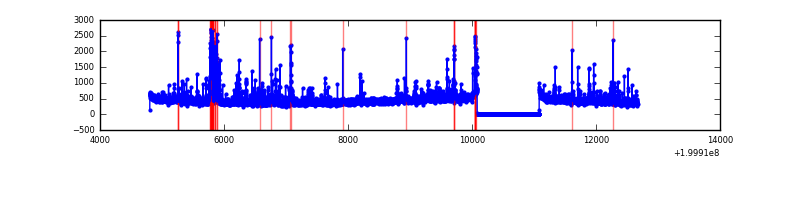 |
Top three noisy pixels from each quadrant. If the there are fewer than three noisy pixels in the level2.evt file, extra rows are filled as -1
| Pixel properties | Quadrant properties | ||||||
|---|---|---|---|---|---|---|---|
| Quadrant | DetID | PixID | Counts | Sigma | Mean | Median | Sigma |
| A | 0 | 199 | 795362 | 4973.13 | 770 | 757 | 159.8 |
| A | 0 | 118 | 386119 | 2411.83 | 770 | 757 | 159.8 |
| A | 0 | 226 | 119861 | 745.43 | 770 | 757 | 159.8 |
| B | 15 | 204 | 377601 | 2449.79 | 791 | 774 | 153.8 |
| B | 2 | 249 | 201942 | 1307.82 | 791 | 774 | 153.8 |
| B | 15 | 186 | 13637 | 83.62 | 791 | 774 | 153.8 |
| C | 1 | 192 | 1299240 | 7448.95 | 743 | 748 | 174.3 |
| C | 14 | 223 | 143635 | 819.69 | 743 | 748 | 174.3 |
| C | 6 | 80 | 75831 | 430.72 | 743 | 748 | 174.3 |
| D | 13 | 223 | 268195 | 1468.45 | 742 | 722 | 182.1 |
| D | 13 | 120 | 98301 | 535.72 | 742 | 722 | 182.1 |
| D | 5 | 233 | 48132 | 260.28 | 742 | 722 | 182.1 |
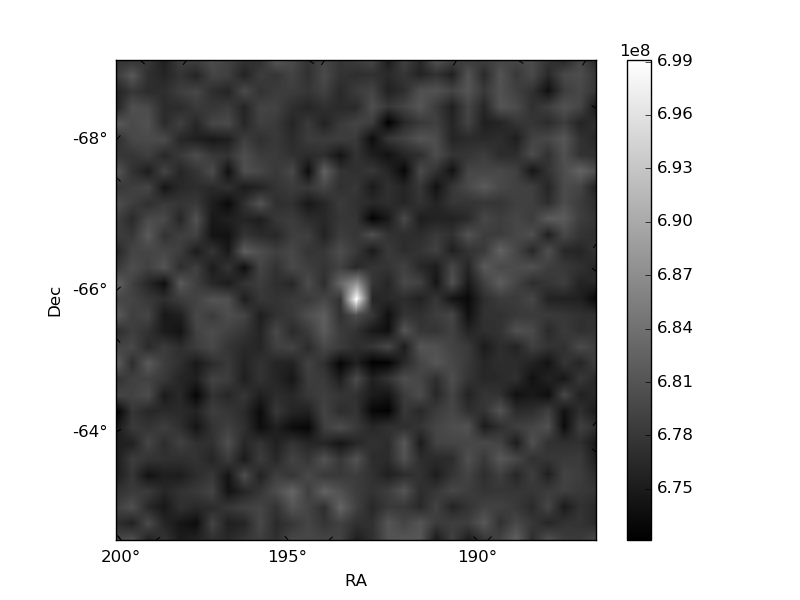
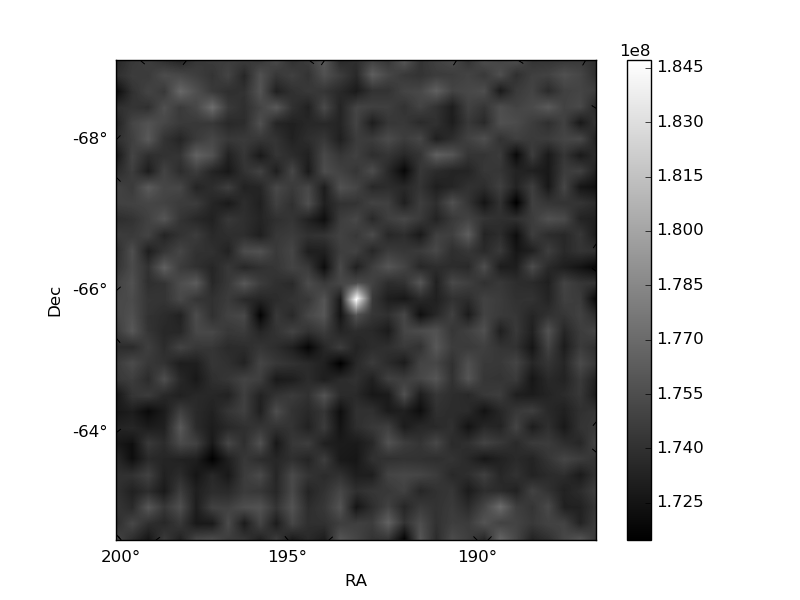
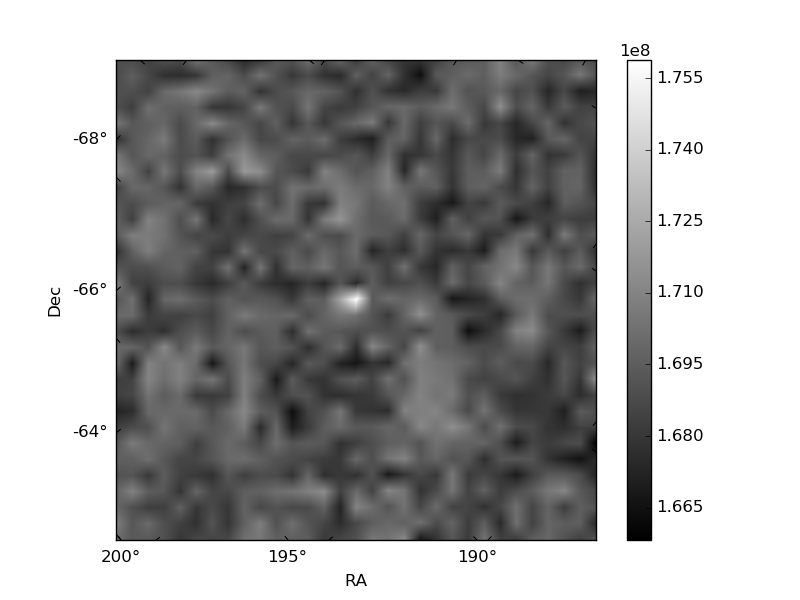
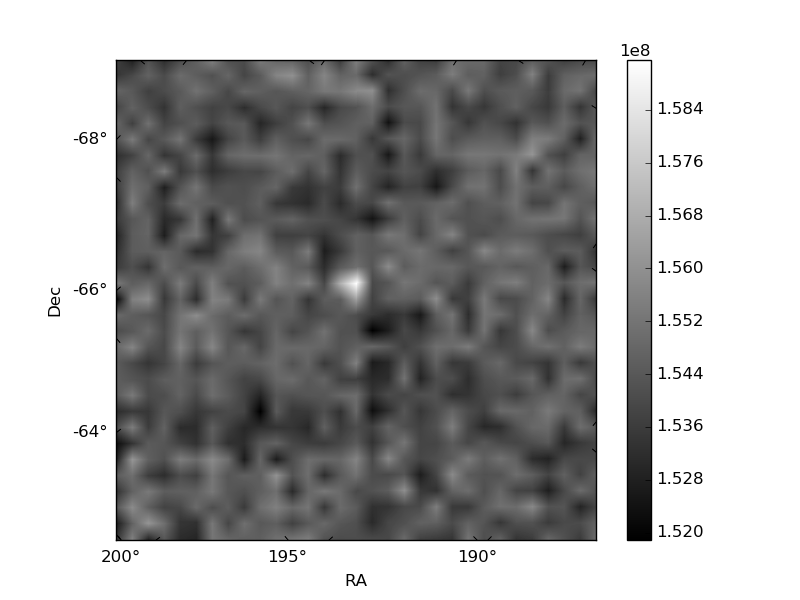
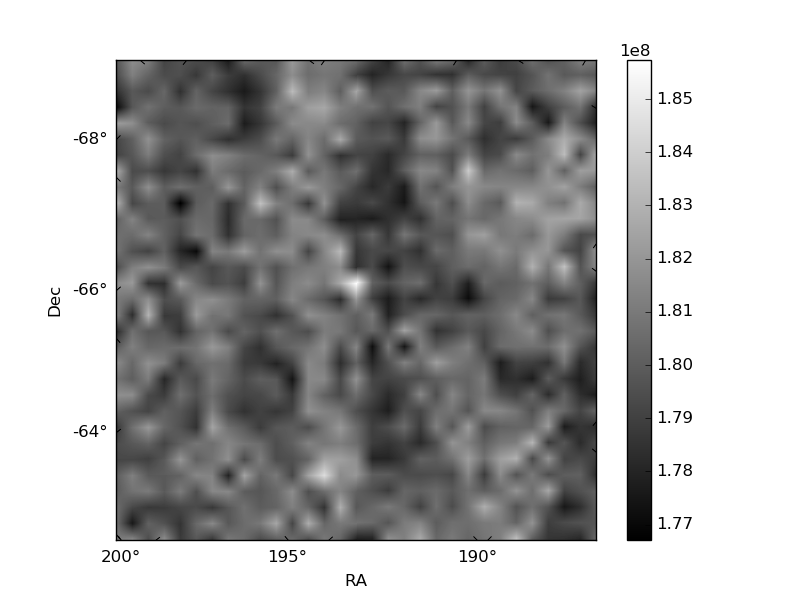
Histogram calculated using DETX and DETY for each event in the final _common_clean file
| Quadrant A | 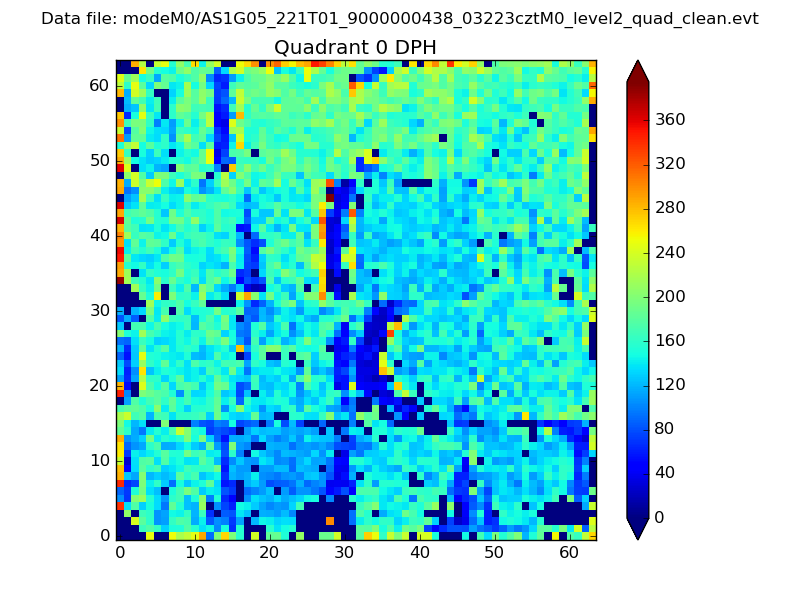 |
 |
Quadrant B |
|---|---|---|---|
| Quadrant D | 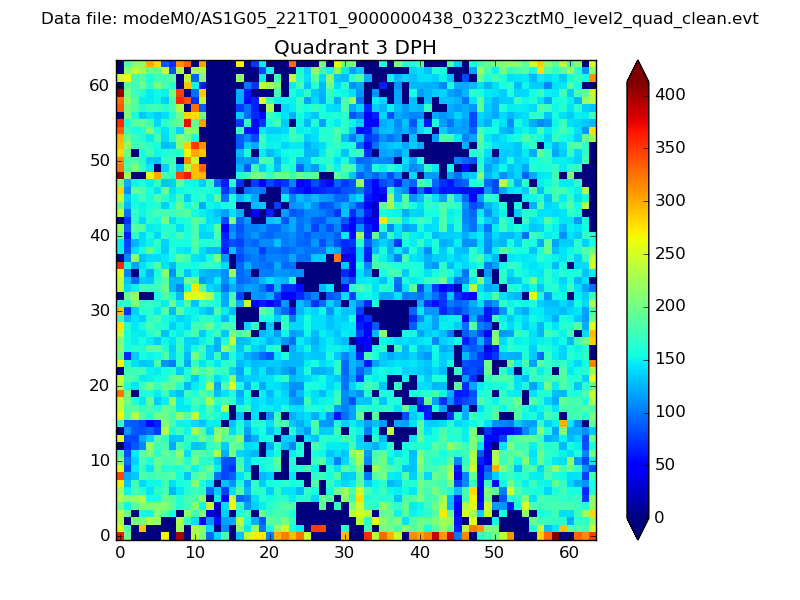 |
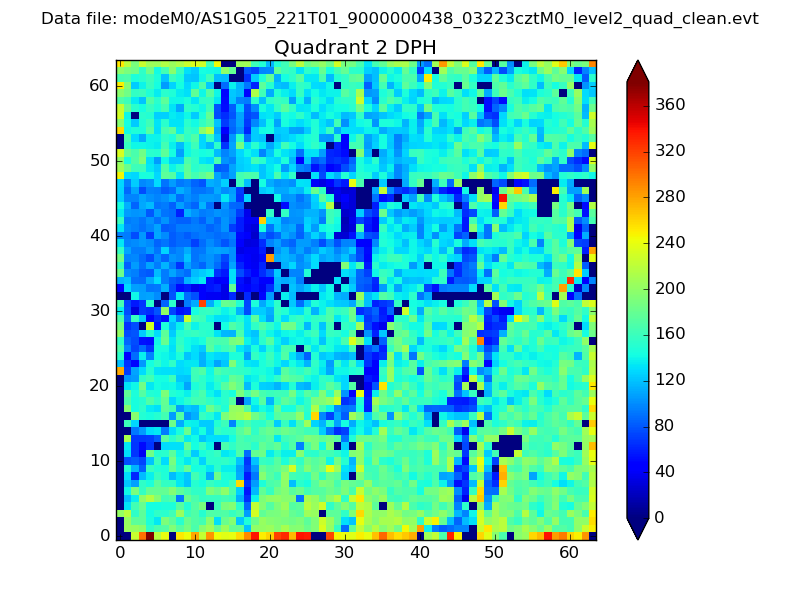 |
Quadrant C |
| Plot type | Count rate plots | Images |
|---|---|---|
| Comparison with Poisson distribution Blue bars denote a histogram of data divided into 1 sec bins. Red curve is a Poisson curve with rate = median count rate of data. |
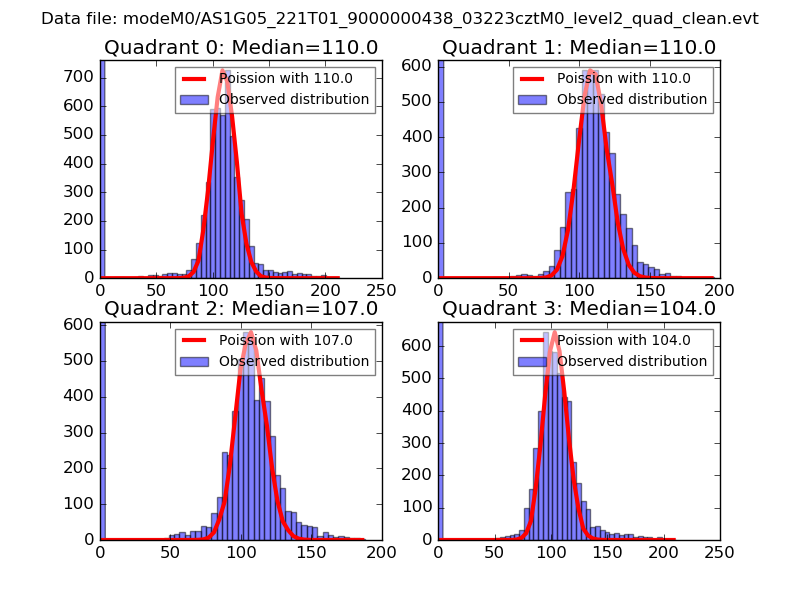 |
 |
| Quadrant-wise count rates Data is divided into 100 sec bins |
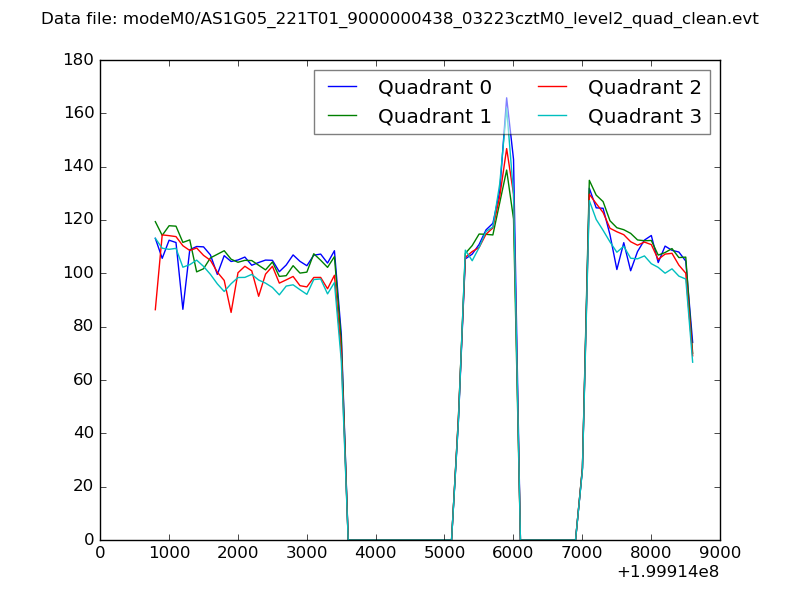 |
|
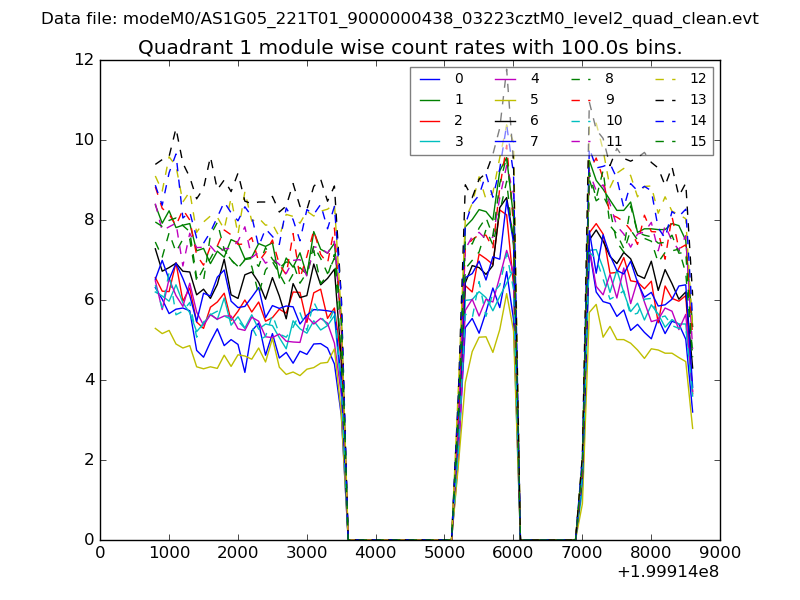
| Module-wise count rates for Quadrant A Data is divided into 100 sec bins |
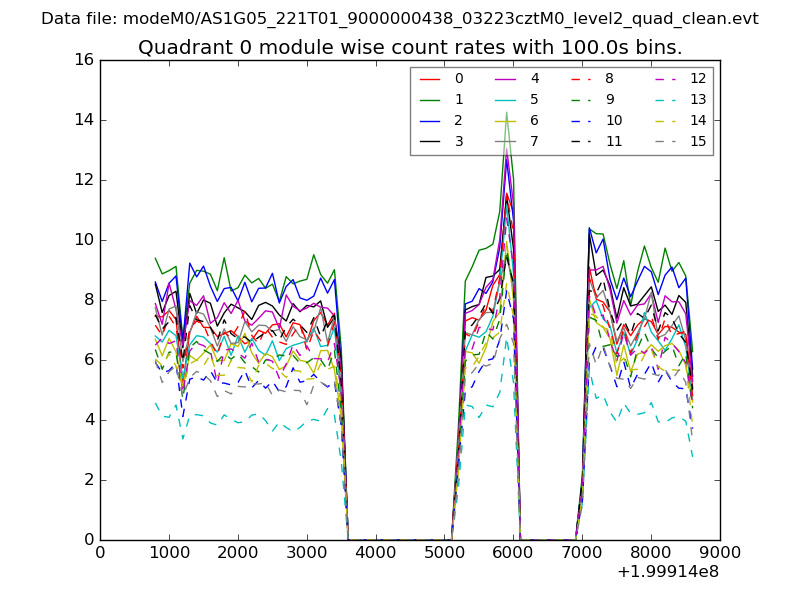 |
 |
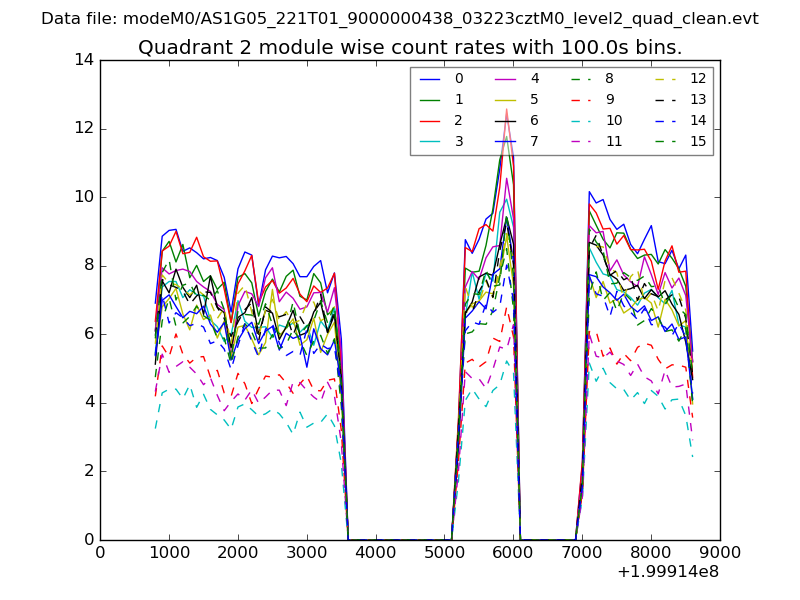
| Module-wise count rates for Quadrant B Data is divided into 100 sec bins |
 |
 |
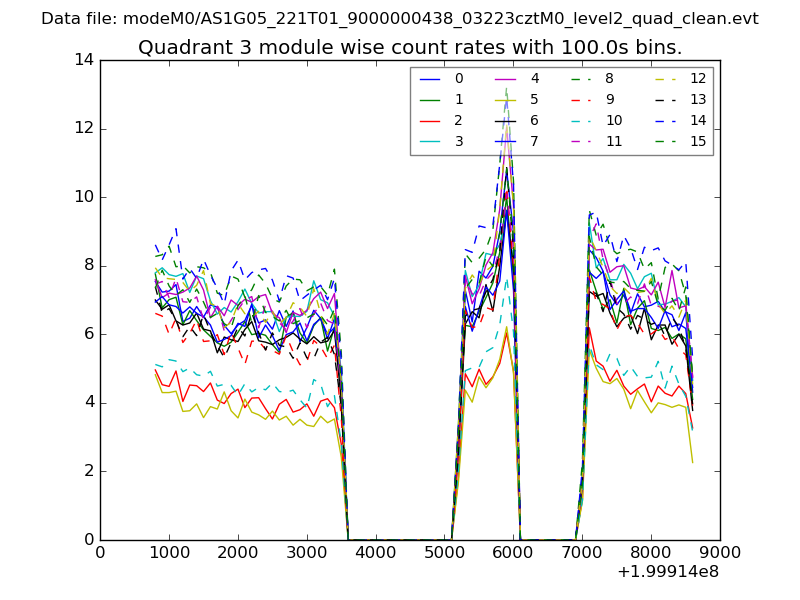
| Module-wise count rates for Quadrant C Data is divided into 100 sec bins |
 |
 |
| Module-wise count rates for Quadrant D Data is divided into 100 sec bins |
 |
 |
| Parameter | Plot |
|---|---|
| CZT HV Monitor | 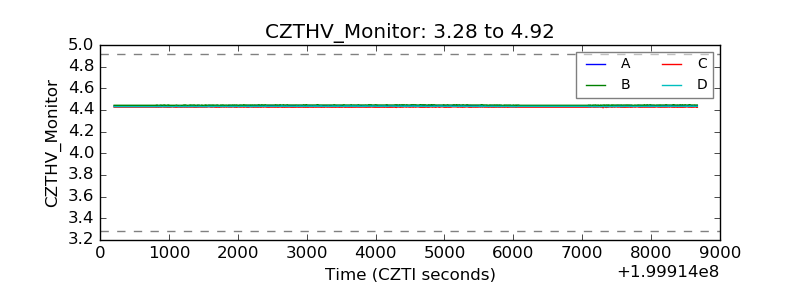 |
| D_VDD | 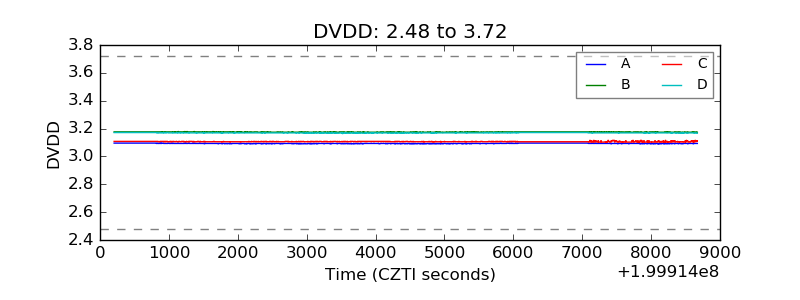 |
| Temperature 1 | 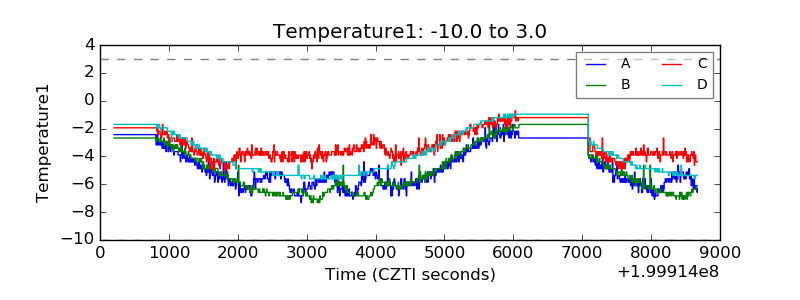 |
| Veto HV Monitor |  |
| Veto LLD | 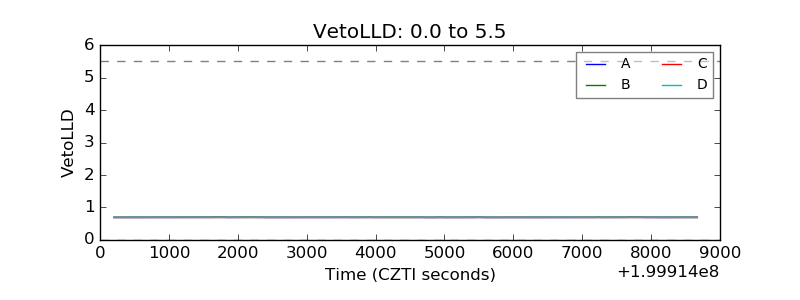 |
| Alpha Counter | 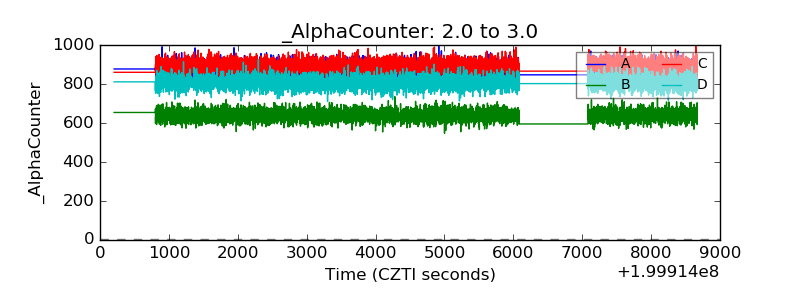 |
| _CPM_Rate | 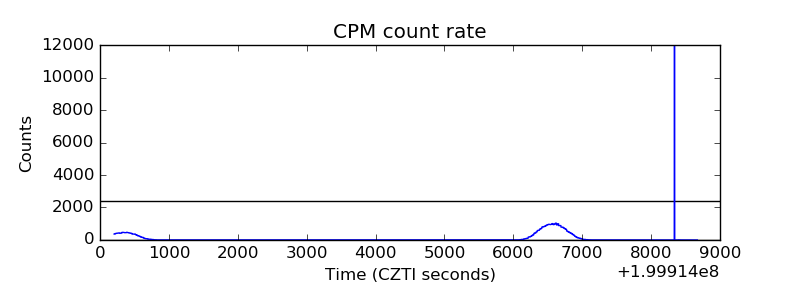 |
| CZT Counter | 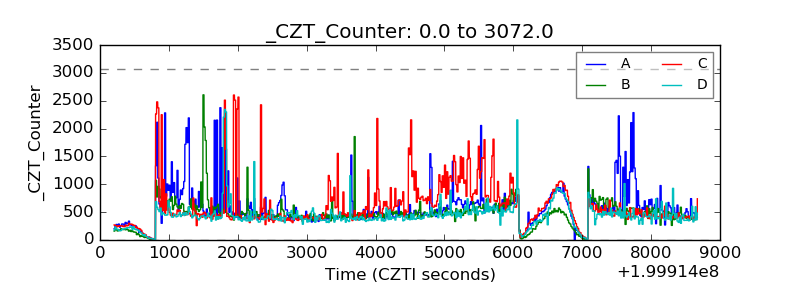 |
| +2.5 Volts monitor |  |
| +5 Volts monitor |  |
| _ROLL_ROT | 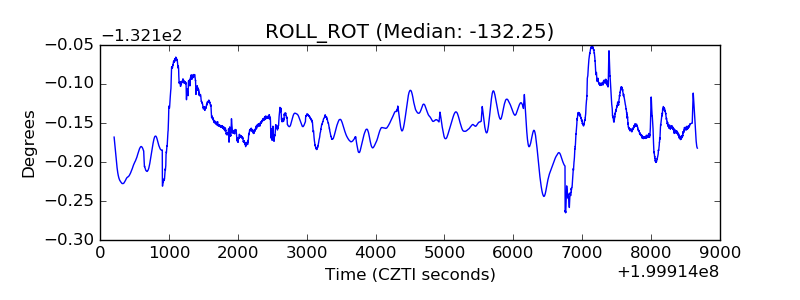 |
| _Roll_DEC | 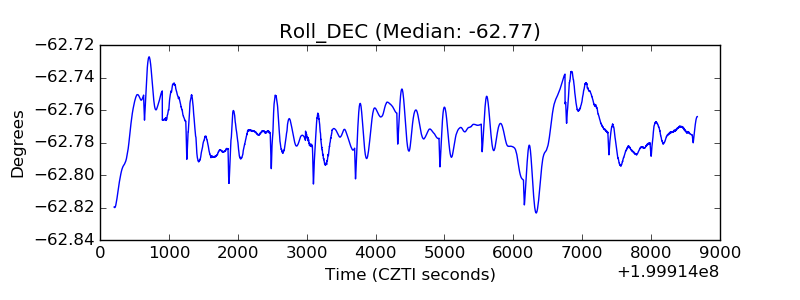 |
| _Roll_RA | 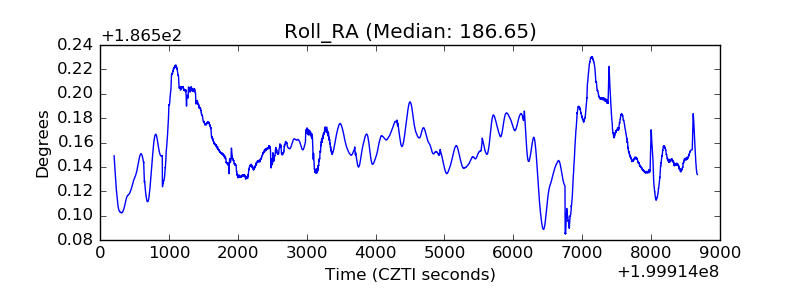 |
| Veto Counter | 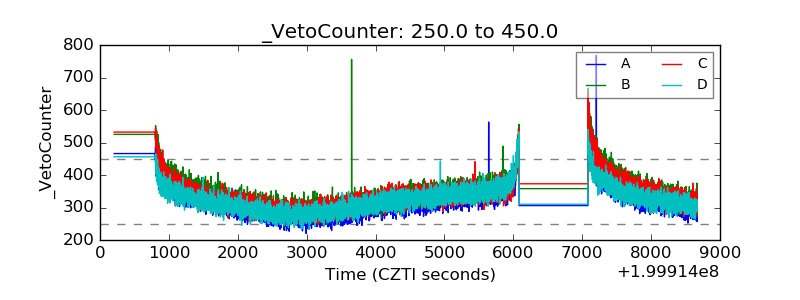 |