| Param | Original file | Final file |
|---|---|---|
| Filename | modeM0/AS1G05_221T01_9000000438_03226cztM0_level2.evt | modeM0/AS1G05_221T01_9000000438_03226cztM0_level2_quad_clean.evt |
| Size (bytes) | 485,084,160 | 89,847,360 |
| Size | 462.6 MB | 85.7 MB |
| Events in quadrant A | 4,242,965 | 556,610 |
| Events in quadrant B | 3,603,602 | 584,001 |
| Events in quadrant C | 3,117,432 | 576,866 |
| Events in quadrant D | 3,283,227 | 547,873 |
| Mode SS | |||
|---|---|---|---|
| Quadrant | BADHDUFLAG | Total packets | Discarded packets |
| A | 0 | 132 | 0 |
| B | 0 | 132 | 0 |
| C | 0 | 132 | 0 |
| D | 0 | 132 | 0 |
| Mode M0 | |||
|---|---|---|---|
| Quadrant | BADHDUFLAG | Total packets | Discarded packets |
| A | 0 | 16787 | 2 |
| B | 0 | 15130 | 1 |
| C | 0 | 13617 | 1 |
| D | 0 | 14455 | 1 |
| Mode M9 | |||
|---|---|---|---|
| Quadrant | BADHDUFLAG | Total packets | Discarded packets |
| A | 0 | 12 | 0 |
| B | 0 | 12 | 0 |
| C | 0 | 12 | 0 |
| D | 0 | 12 | 0 |
| Quadrant | Total seconds | Saturated seconds | Saturation percentage |
|---|---|---|---|
| A | 6532 | 387 | 5.924679% |
| B | 6532 | 66 | 1.010410% |
| C | 6532 | 30 | 0.459277% |
| D | 6532 | 40 | 0.612370% |
Noise dominated data is calculated using 1-second bins in cleaned event files. If a bin has >2000 counts, and if more than 50% of those come from <1% of pixels, then it is considered to be noise-dominated and hence unusable.
| Quadrant | # 1 sec bins | Bins with >0 counts | Bins with >2000 counts | High rate bins dominated by noise | Noise dominated (total time) | Noise dominated (detector-on time) | Marked lightcurve |
|---|---|---|---|---|---|---|---|
| A | 7742 | 6532 | 299 | 299 | 3.86% | 4.58% | 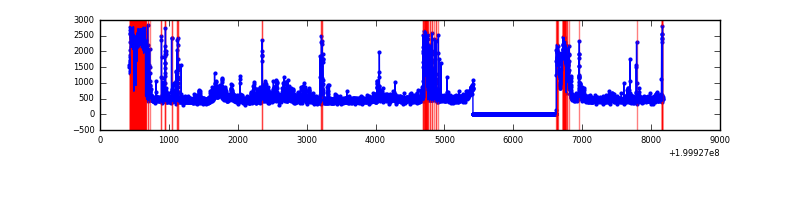 |
| B | 7742 | 6532 | 23 | 23 | 0.30% | 0.35% | 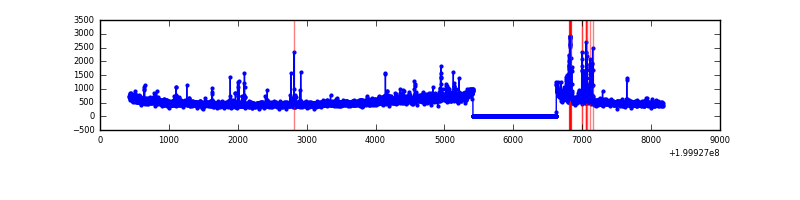 |
| C | 7742 | 6532 | 10 | 10 | 0.13% | 0.15% | 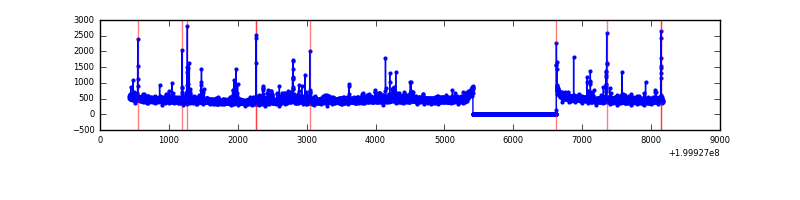 |
| D | 7742 | 6533 | 38 | 38 | 0.49% | 0.58% | 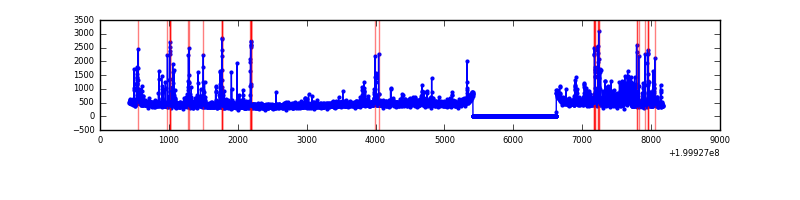 |
Top three noisy pixels from each quadrant. If the there are fewer than three noisy pixels in the level2.evt file, extra rows are filled as -1
| Pixel properties | Quadrant properties | ||||||
|---|---|---|---|---|---|---|---|
| Quadrant | DetID | PixID | Counts | Sigma | Mean | Median | Sigma |
| A | 0 | 199 | 916994 | 6026.45 | 738 | 723 | 152.0 |
| A | 0 | 118 | 266419 | 1747.52 | 738 | 723 | 152.0 |
| A | 0 | 226 | 120721 | 789.25 | 738 | 723 | 152.0 |
| B | 15 | 204 | 339095 | 2293.22 | 781 | 766 | 147.5 |
| B | 5 | 200 | 151173 | 1019.47 | 781 | 766 | 147.5 |
| B | 2 | 249 | 61501 | 411.67 | 781 | 766 | 147.5 |
| C | 14 | 223 | 67986 | 384.1 | 749 | 755 | 175.0 |
| C | 6 | 80 | 61512 | 347.12 | 749 | 755 | 175.0 |
| C | 1 | 192 | 27344 | 151.91 | 749 | 755 | 175.0 |
| D | 13 | 223 | 166793 | 930.1 | 734 | 716 | 178.6 |
| D | 13 | 120 | 156069 | 870.04 | 734 | 716 | 178.6 |
| D | 13 | 239 | 89981 | 499.92 | 734 | 716 | 178.6 |
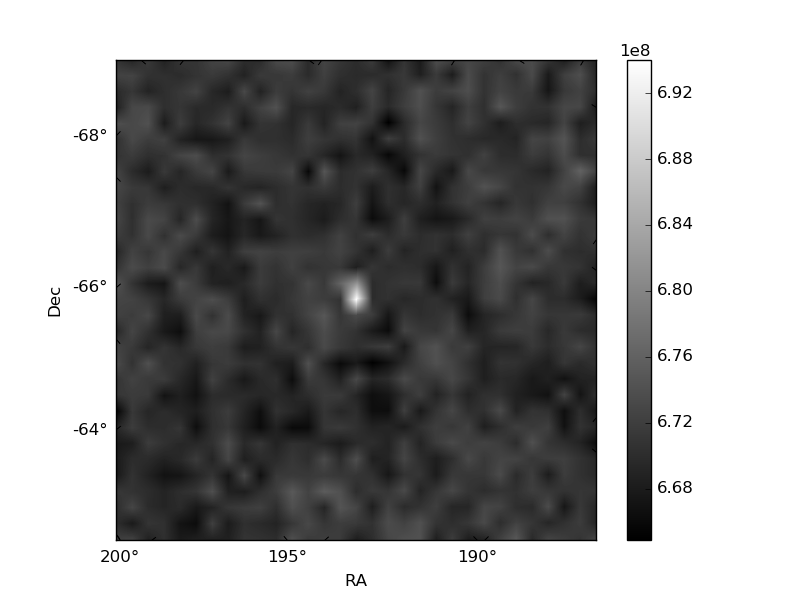
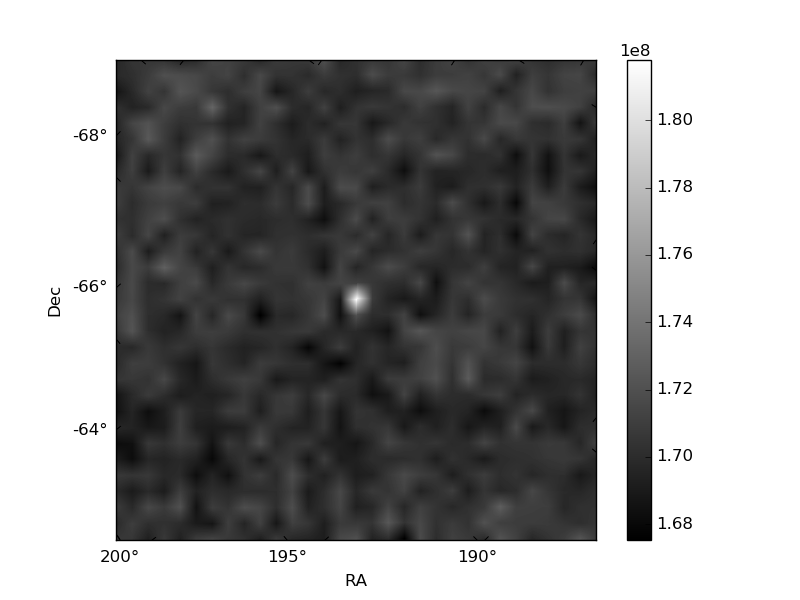
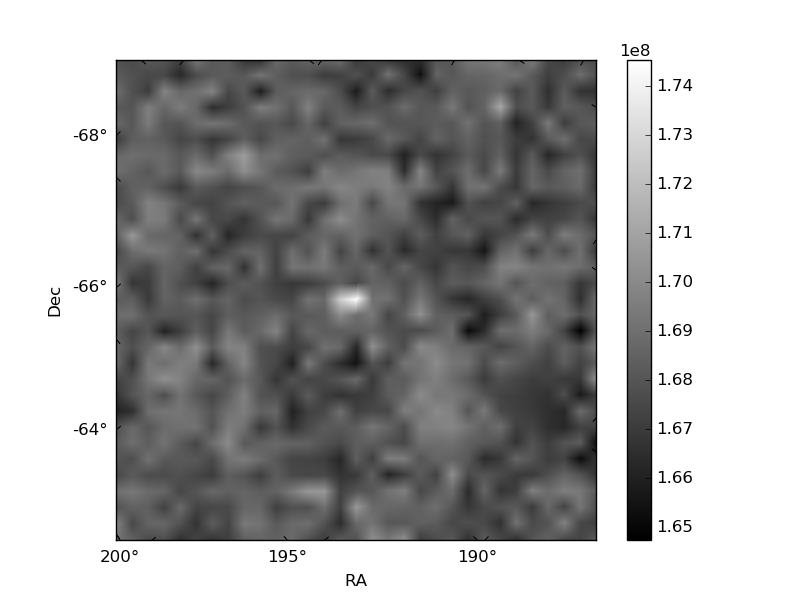
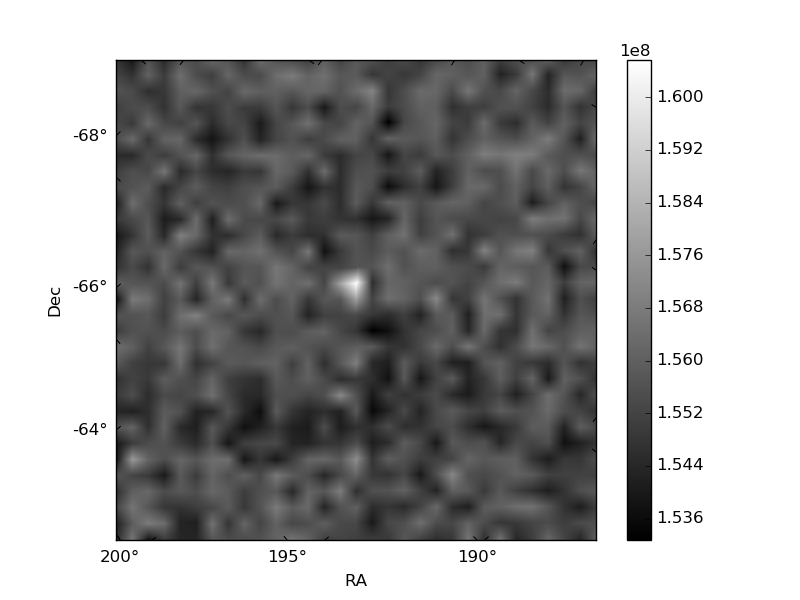
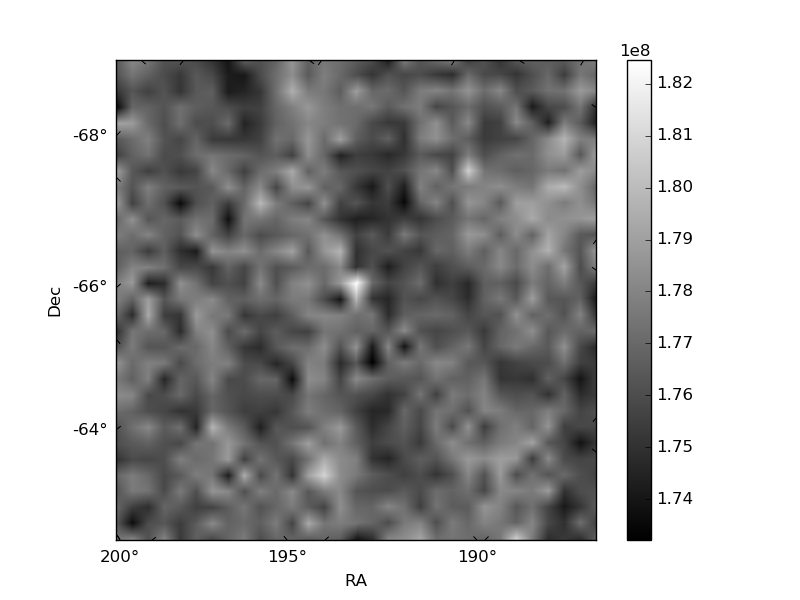
Histogram calculated using DETX and DETY for each event in the final _common_clean file
| Quadrant A | 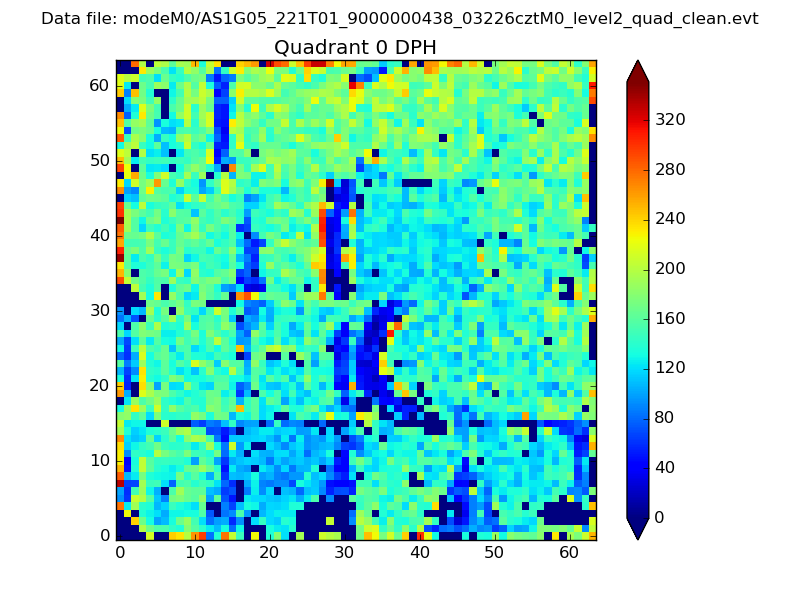 |
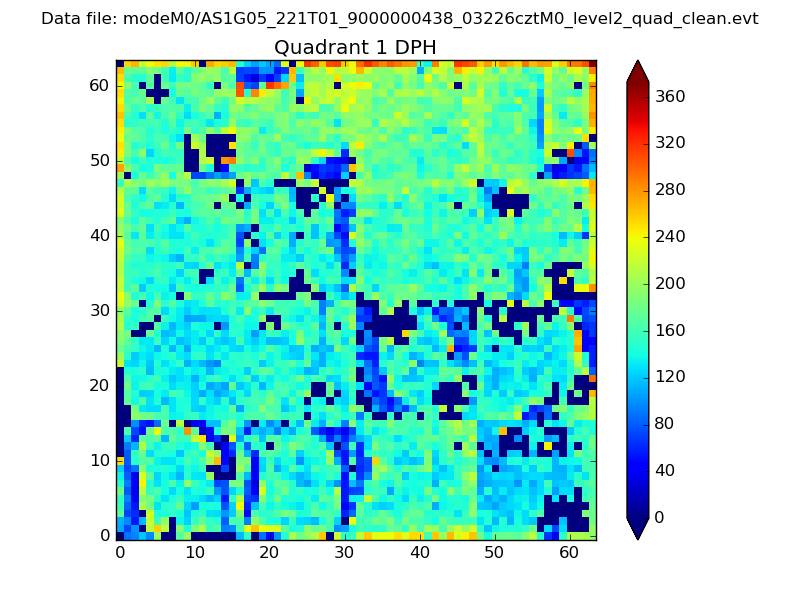 |
Quadrant B |
|---|---|---|---|
| Quadrant D | 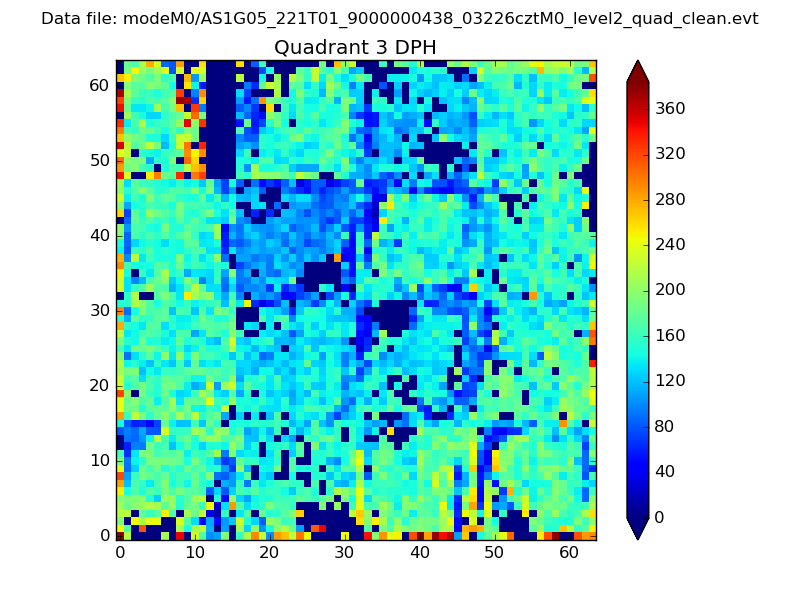 |
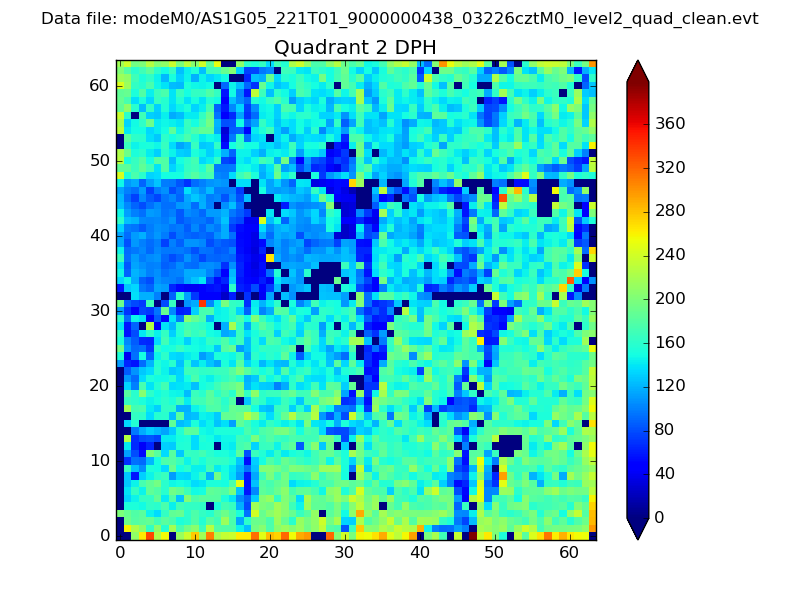 |
Quadrant C |
| Plot type | Count rate plots | Images |
|---|---|---|
| Comparison with Poisson distribution Blue bars denote a histogram of data divided into 1 sec bins. Red curve is a Poisson curve with rate = median count rate of data. |
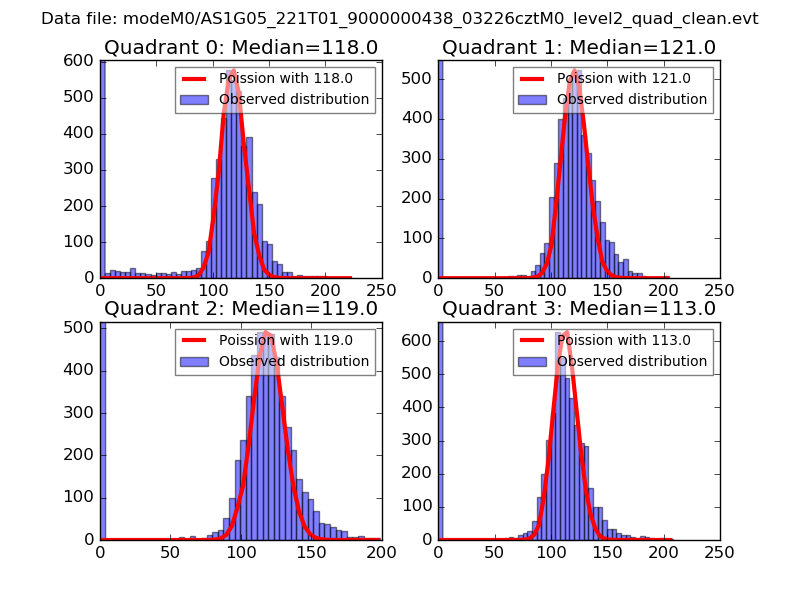 |
 |
| Quadrant-wise count rates Data is divided into 100 sec bins |
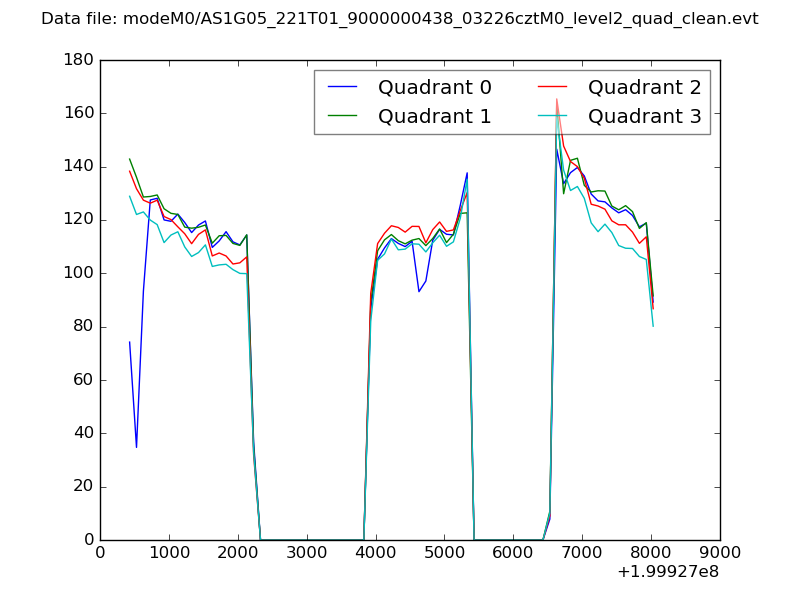 |
|
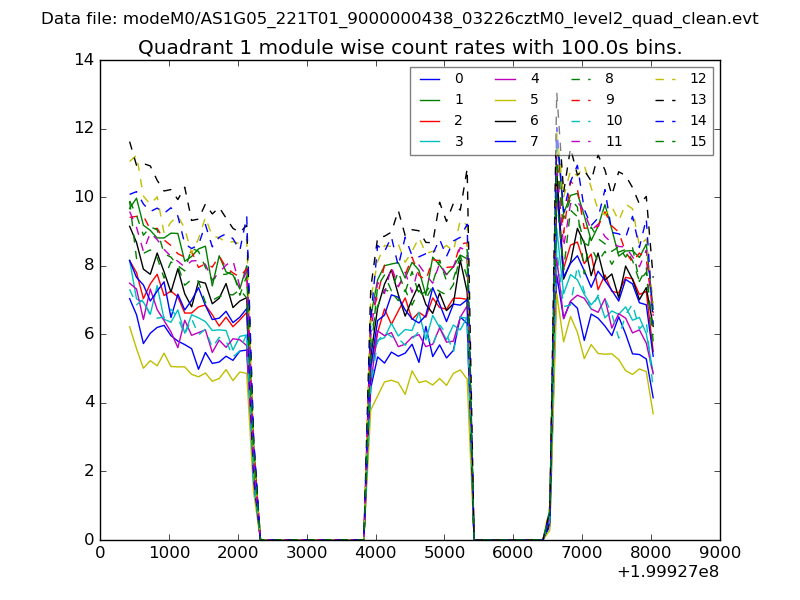
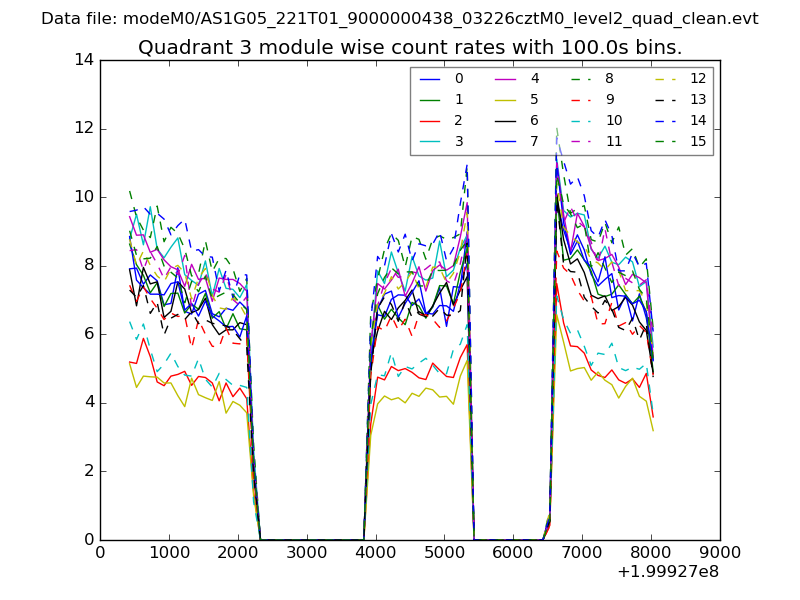
| Module-wise count rates for Quadrant A Data is divided into 100 sec bins |
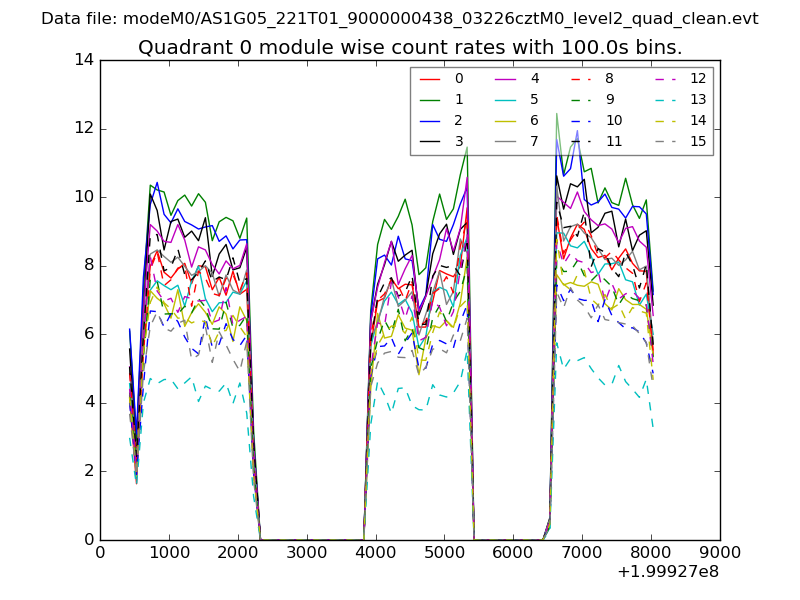 |
 |
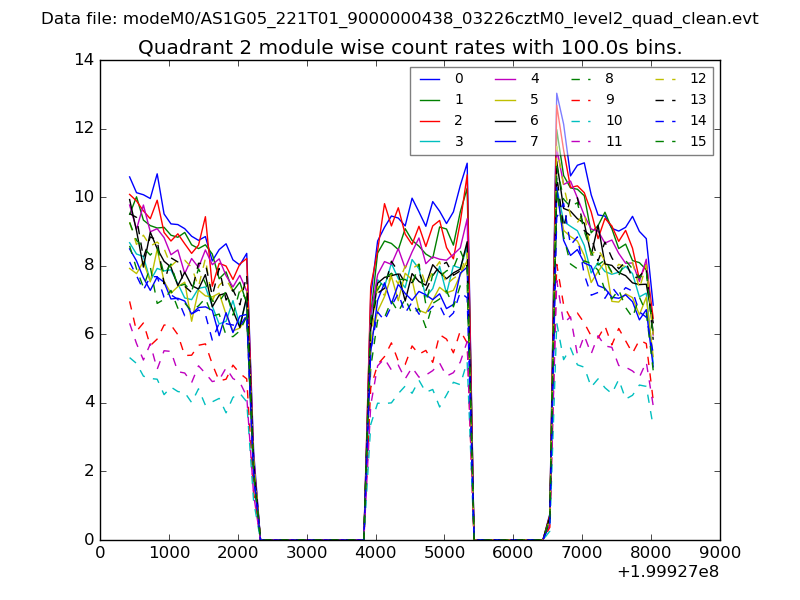
| Module-wise count rates for Quadrant B Data is divided into 100 sec bins |
 |
 |
| Module-wise count rates for Quadrant C Data is divided into 100 sec bins |
 |
 |
| Module-wise count rates for Quadrant D Data is divided into 100 sec bins |
 |
 |
| Parameter | Plot |
|---|---|
| CZT HV Monitor | 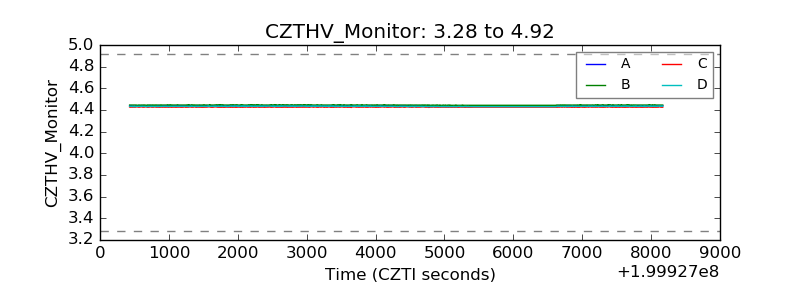 |
| D_VDD | 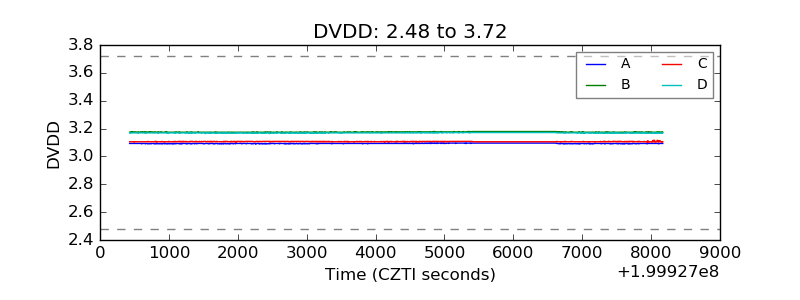 |
| Temperature 1 | 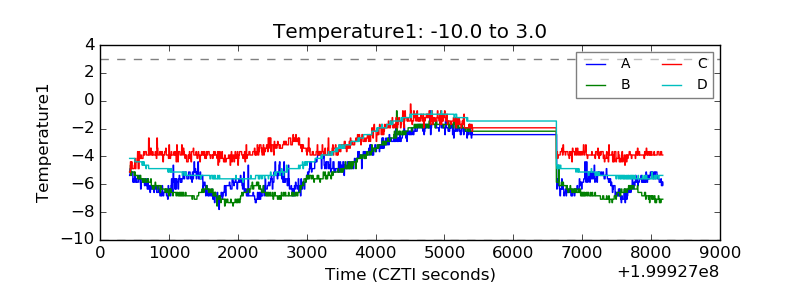 |
| Veto HV Monitor | 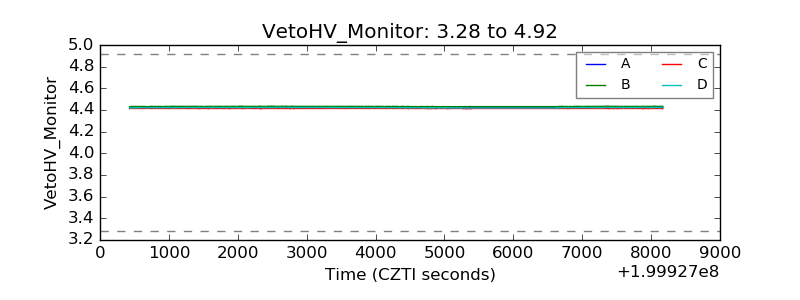 |
| Veto LLD | 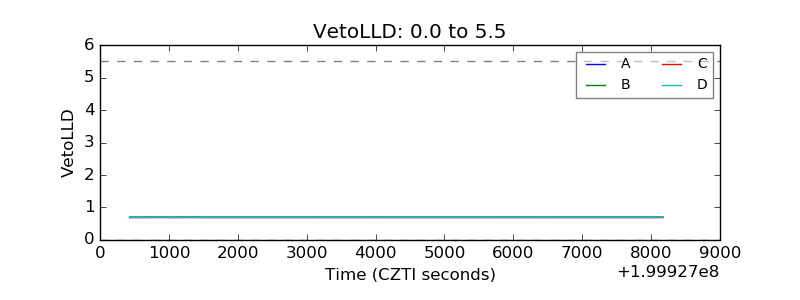 |
| Alpha Counter | 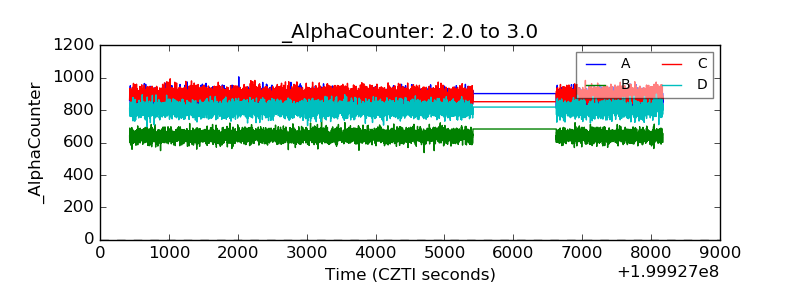 |
| _CPM_Rate | 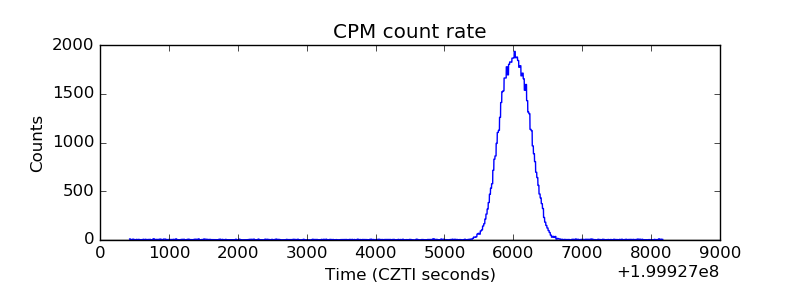 |
| CZT Counter | 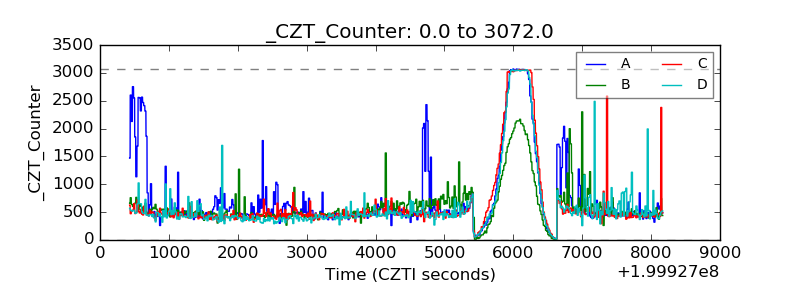 |
| +2.5 Volts monitor |  |
| +5 Volts monitor |  |
| _ROLL_ROT | 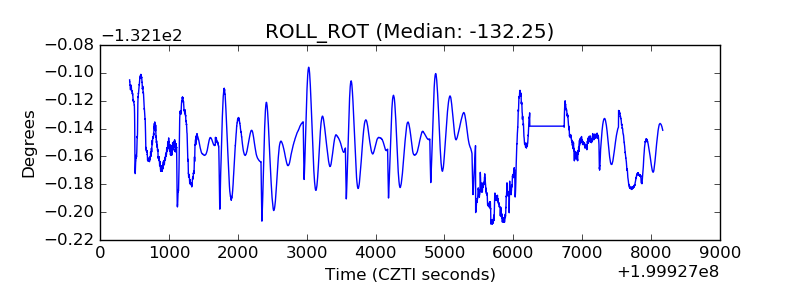 |
| _Roll_DEC | 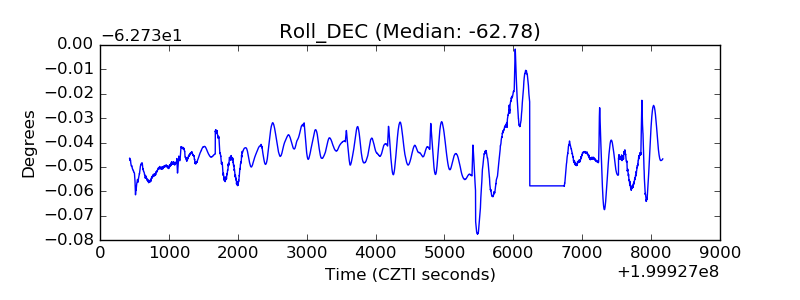 |
| _Roll_RA | 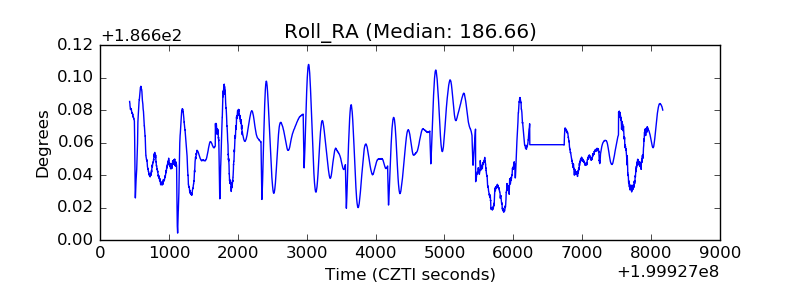 |
| Veto Counter | 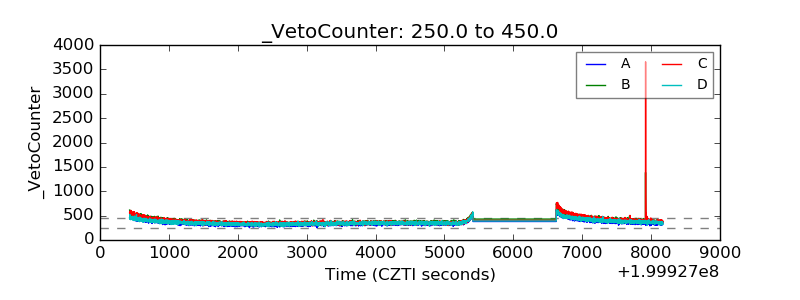 |