| Param | Original file | Final file |
|---|---|---|
| Filename | modeM0/AS1G05_221T01_9000000438_03227cztM0_level2.evt | modeM0/AS1G05_221T01_9000000438_03227cztM0_level2_quad_clean.evt |
| Size (bytes) | 513,679,680 | 84,021,120 |
| Size | 489.9 MB | 80.1 MB |
| Events in quadrant A | 5,110,489 | 514,973 |
| Events in quadrant B | 3,618,208 | 539,314 |
| Events in quadrant C | 3,125,220 | 537,851 |
| Events in quadrant D | 3,269,261 | 506,323 |
| Mode SS | |||
|---|---|---|---|
| Quadrant | BADHDUFLAG | Total packets | Discarded packets |
| A | 0 | 130 | 0 |
| B | 0 | 130 | 0 |
| C | 0 | 130 | 0 |
| D | 0 | 130 | 0 |
| Mode M0 | |||
|---|---|---|---|
| Quadrant | BADHDUFLAG | Total packets | Discarded packets |
| A | 0 | 19382 | 2 |
| B | 0 | 14905 | 1 |
| C | 0 | 13373 | 1 |
| D | 0 | 14159 | 1 |
| Mode M9 | |||
|---|---|---|---|
| Quadrant | BADHDUFLAG | Total packets | Discarded packets |
| A | 0 | 13 | 0 |
| B | 0 | 13 | 0 |
| C | 0 | 13 | 0 |
| D | 0 | 13 | 0 |
| Quadrant | Total seconds | Saturated seconds | Saturation percentage |
|---|---|---|---|
| A | 6390 | 697 | 10.907668% |
| B | 6390 | 70 | 1.095462% |
| C | 6390 | 24 | 0.375587% |
| D | 6390 | 57 | 0.892019% |
Noise dominated data is calculated using 1-second bins in cleaned event files. If a bin has >2000 counts, and if more than 50% of those come from <1% of pixels, then it is considered to be noise-dominated and hence unusable.
| Quadrant | # 1 sec bins | Bins with >0 counts | Bins with >2000 counts | High rate bins dominated by noise | Noise dominated (total time) | Noise dominated (detector-on time) | Marked lightcurve |
|---|---|---|---|---|---|---|---|
| A | 7674 | 6390 | 628 | 628 | 8.18% | 9.83% | 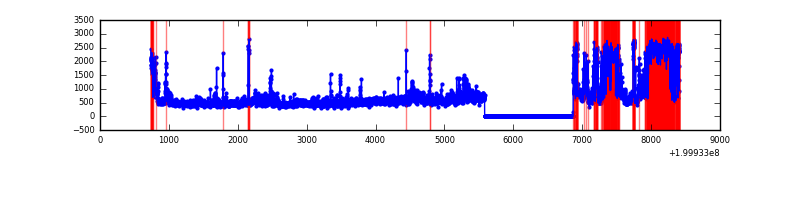 |
| B | 7675 | 6391 | 25 | 25 | 0.33% | 0.39% | 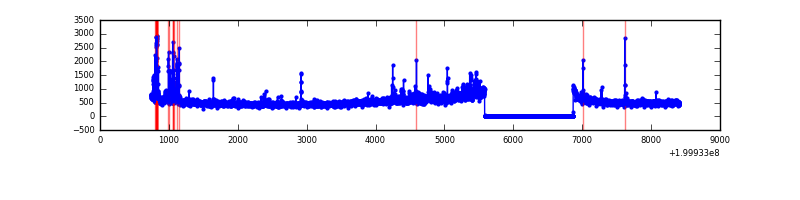 |
| C | 7675 | 6391 | 11 | 11 | 0.14% | 0.17% | 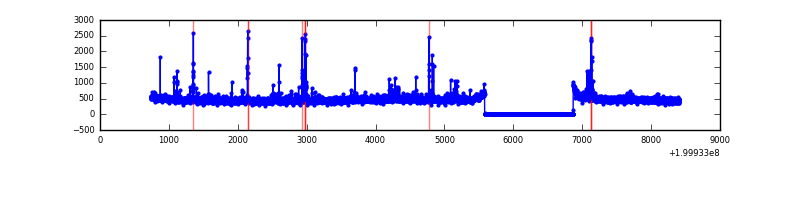 |
| D | 7675 | 6391 | 52 | 52 | 0.68% | 0.81% | 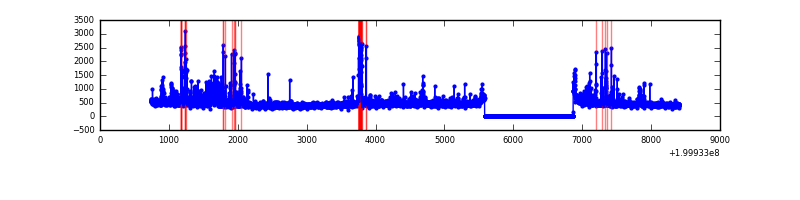 |
Top three noisy pixels from each quadrant. If the there are fewer than three noisy pixels in the level2.evt file, extra rows are filled as -1
| Pixel properties | Quadrant properties | ||||||
|---|---|---|---|---|---|---|---|
| Quadrant | DetID | PixID | Counts | Sigma | Mean | Median | Sigma |
| A | 0 | 199 | 1040548 | 7040.2 | 721 | 709 | 147.7 |
| A | 0 | 50 | 1003760 | 6791.13 | 721 | 709 | 147.7 |
| A | 0 | 118 | 122240 | 822.82 | 721 | 709 | 147.7 |
| B | 15 | 204 | 367123 | 2505.57 | 779 | 765 | 146.2 |
| B | 5 | 200 | 140257 | 954.0 | 779 | 765 | 146.2 |
| B | 2 | 249 | 40301 | 270.39 | 779 | 765 | 146.2 |
| C | 6 | 80 | 77916 | 441.43 | 751 | 758 | 174.8 |
| C | 14 | 223 | 66061 | 373.6 | 751 | 758 | 174.8 |
| C | 1 | 192 | 29710 | 165.64 | 751 | 758 | 174.8 |
| D | 13 | 223 | 165846 | 922.7 | 735 | 713 | 179.0 |
| D | 13 | 120 | 153904 | 855.97 | 735 | 713 | 179.0 |
| D | 13 | 239 | 62522 | 345.37 | 735 | 713 | 179.0 |
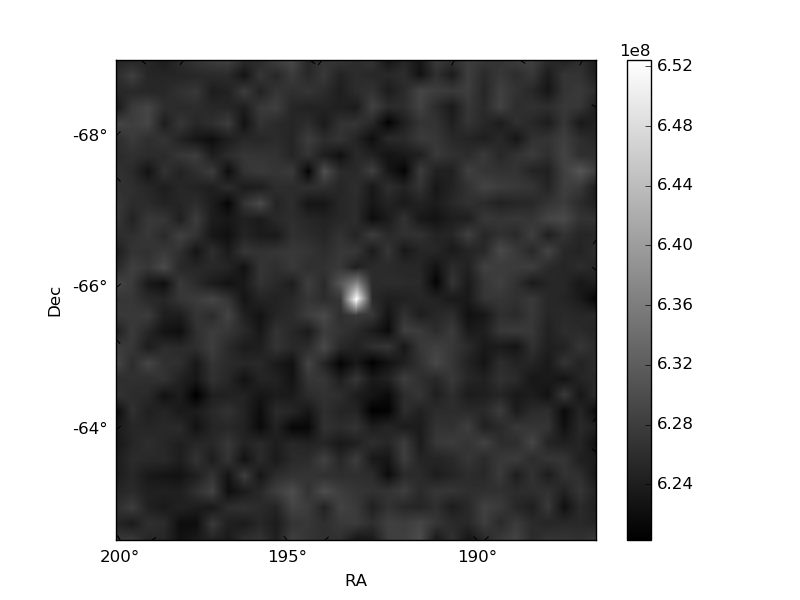
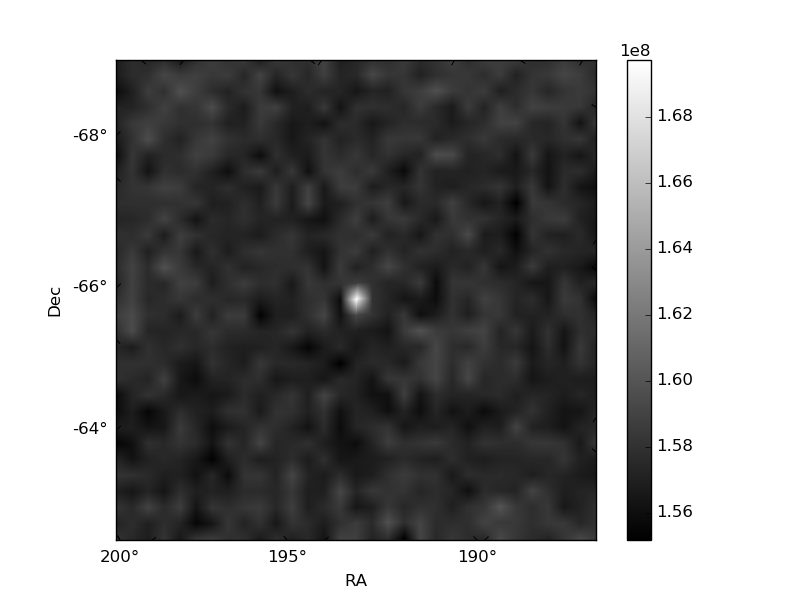
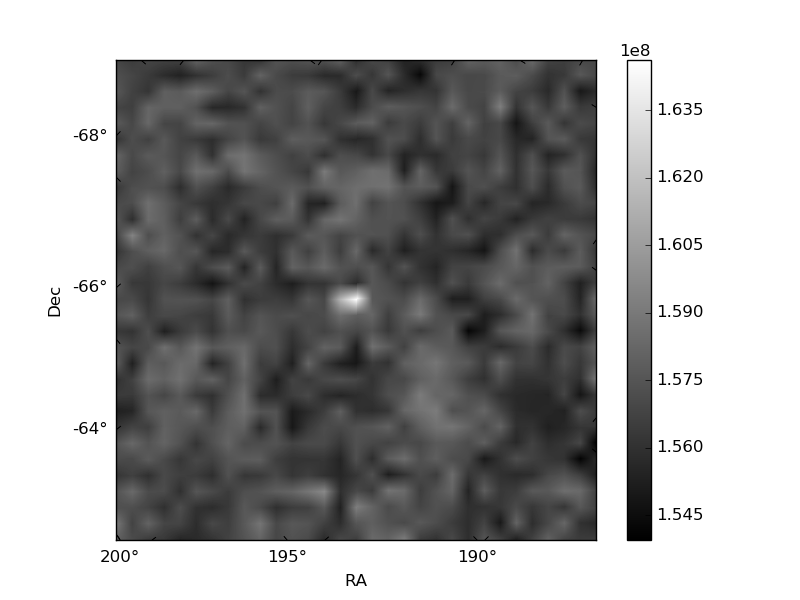
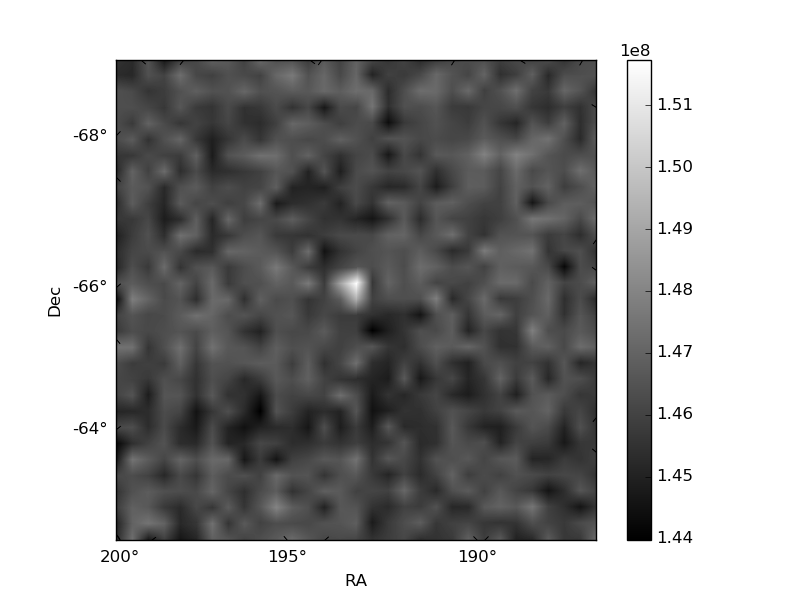
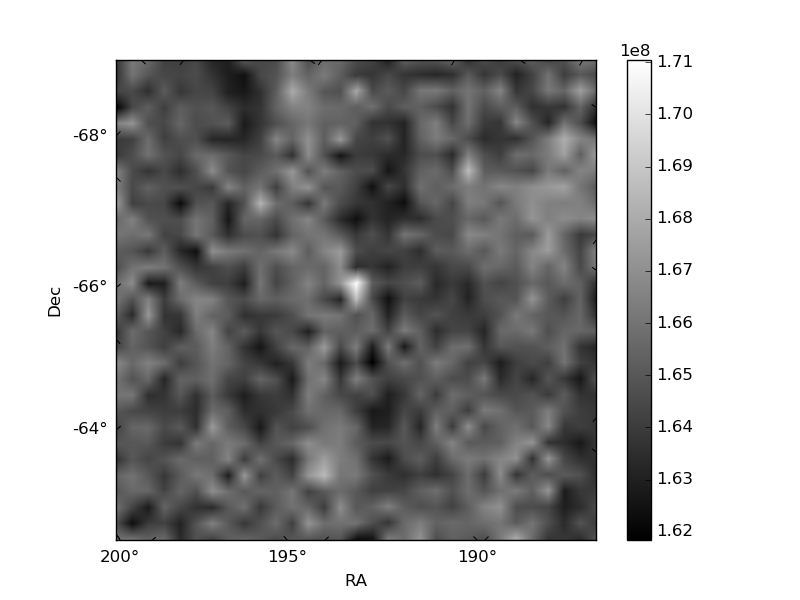
Histogram calculated using DETX and DETY for each event in the final _common_clean file
| Quadrant A | 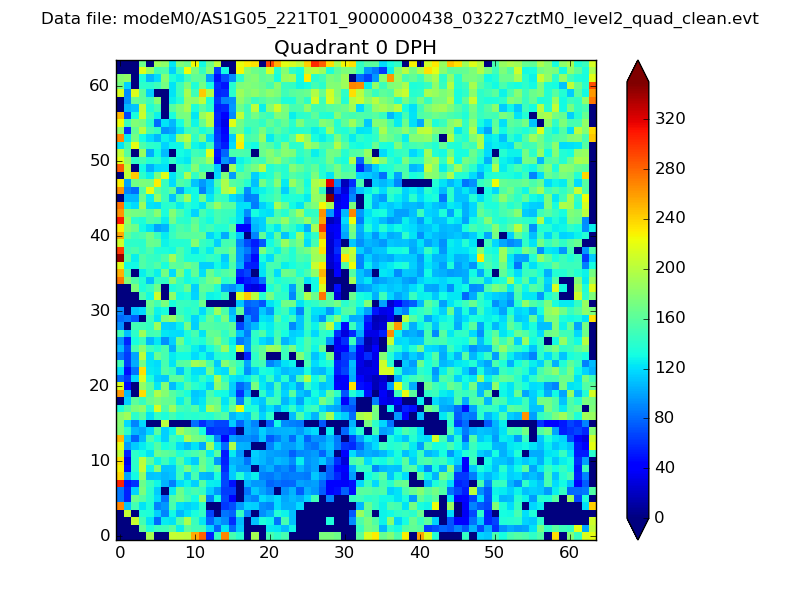 |
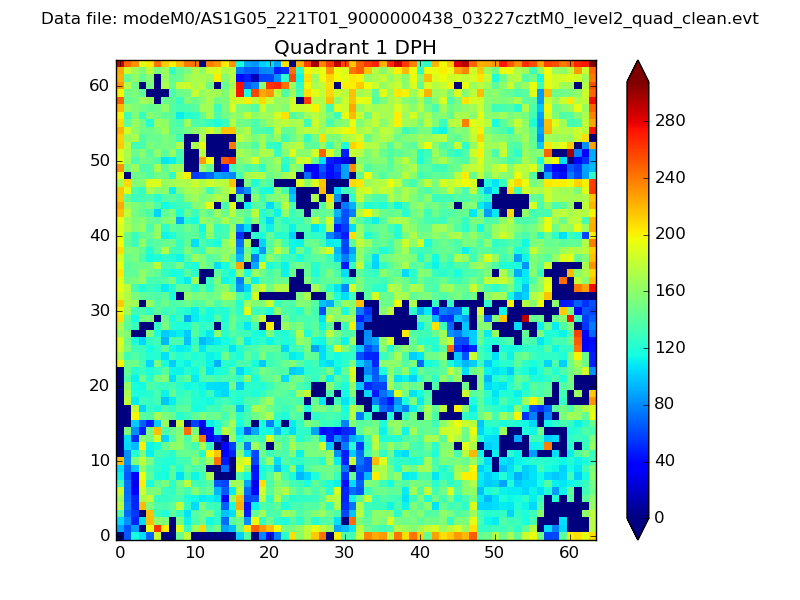 |
Quadrant B |
|---|---|---|---|
| Quadrant D | 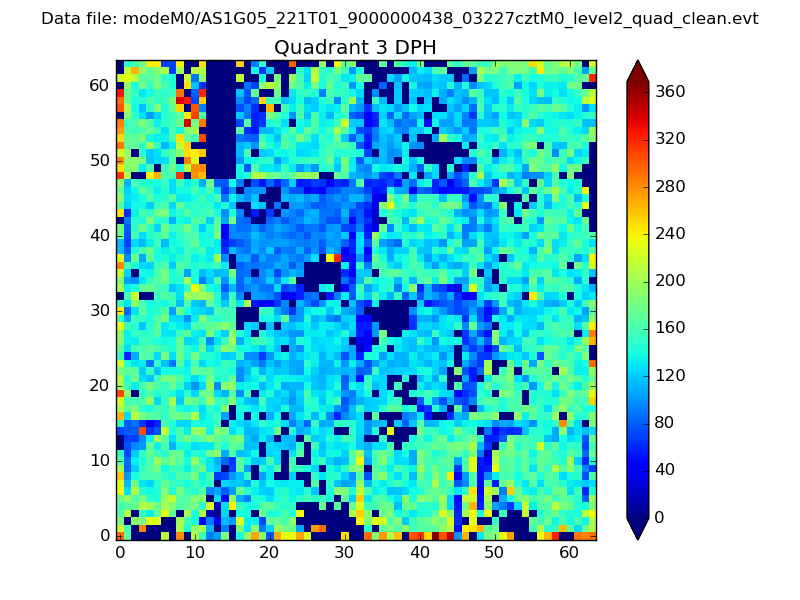 |
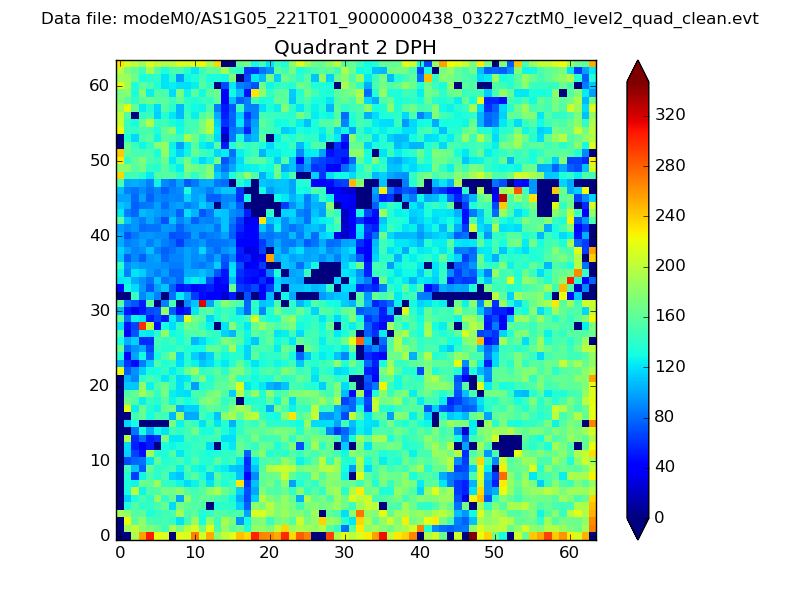 |
Quadrant C |
| Plot type | Count rate plots | Images |
|---|---|---|
| Comparison with Poisson distribution Blue bars denote a histogram of data divided into 1 sec bins. Red curve is a Poisson curve with rate = median count rate of data. |
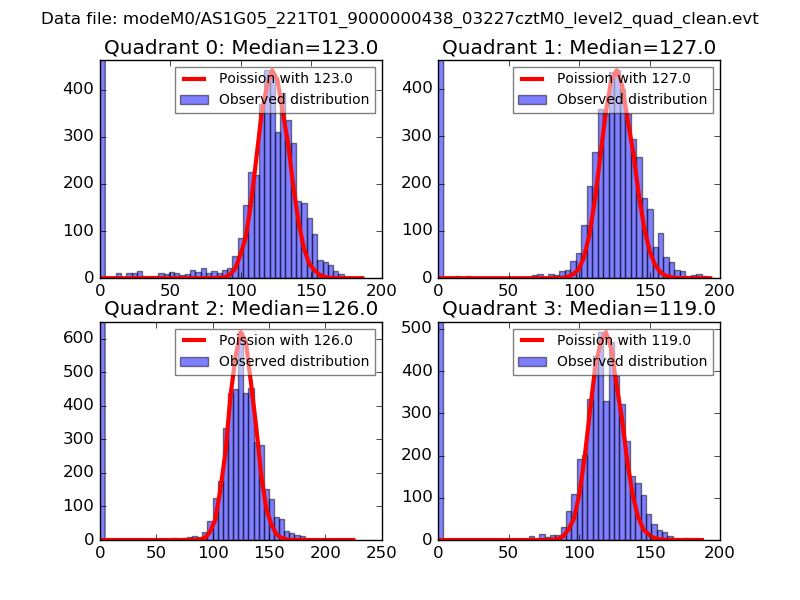 |
 |
| Quadrant-wise count rates Data is divided into 100 sec bins |
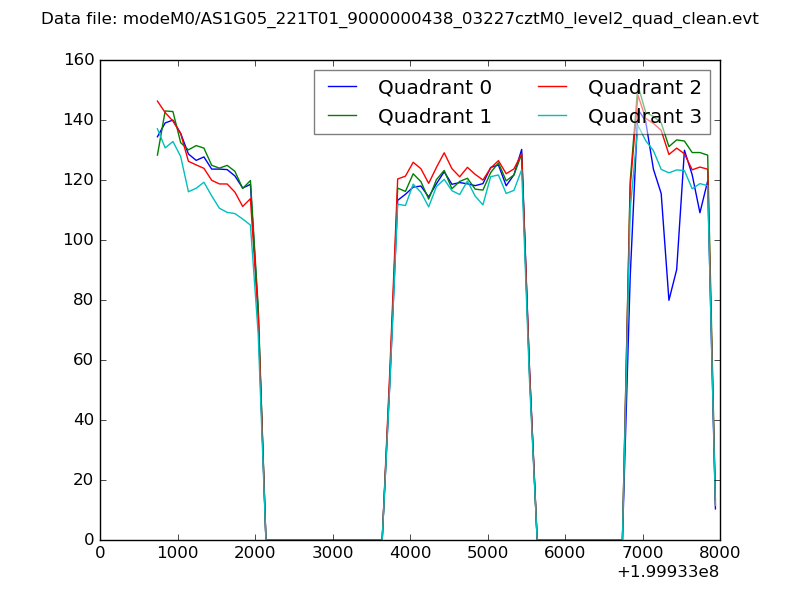 |
|
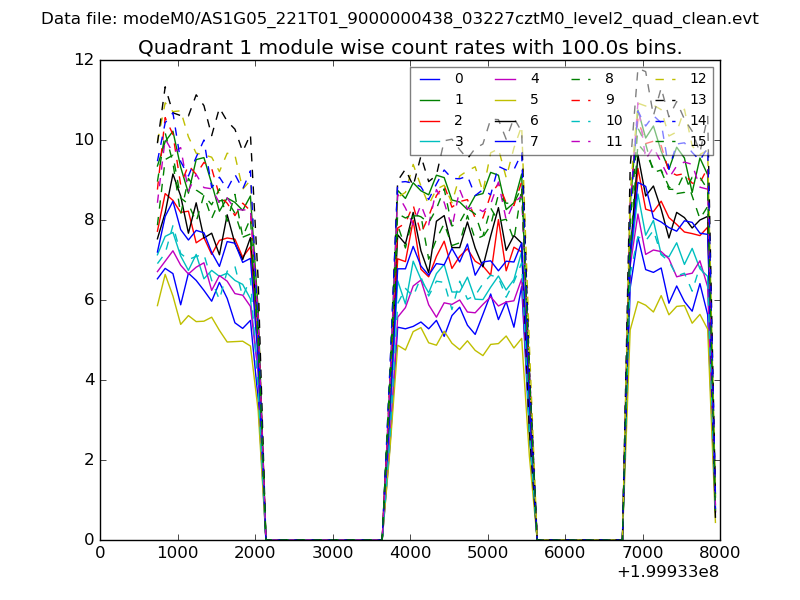
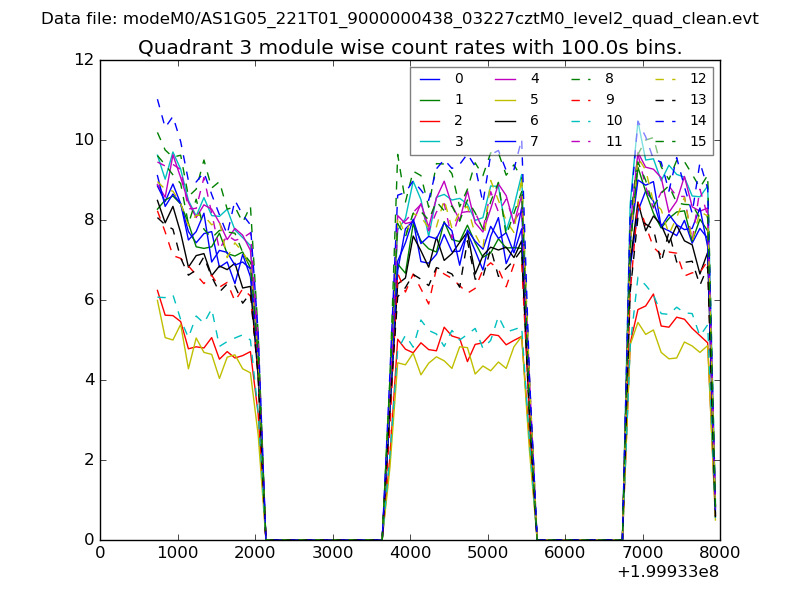
| Module-wise count rates for Quadrant A Data is divided into 100 sec bins |
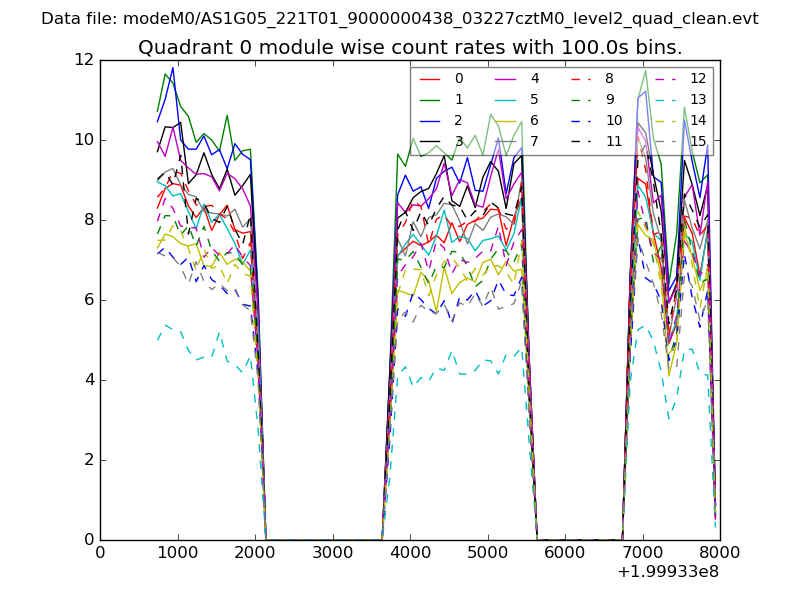 |
 |
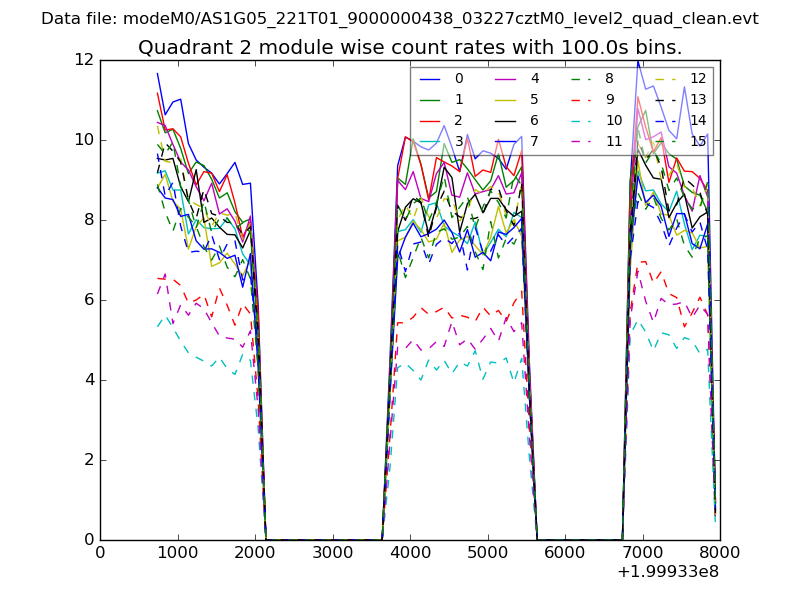
| Module-wise count rates for Quadrant B Data is divided into 100 sec bins |
 |
 |
| Module-wise count rates for Quadrant C Data is divided into 100 sec bins |
 |
 |
| Module-wise count rates for Quadrant D Data is divided into 100 sec bins |
 |
 |
| Parameter | Plot |
|---|---|
| CZT HV Monitor | 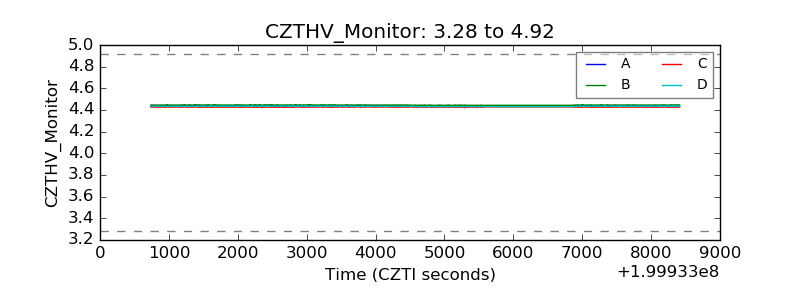 |
| D_VDD | 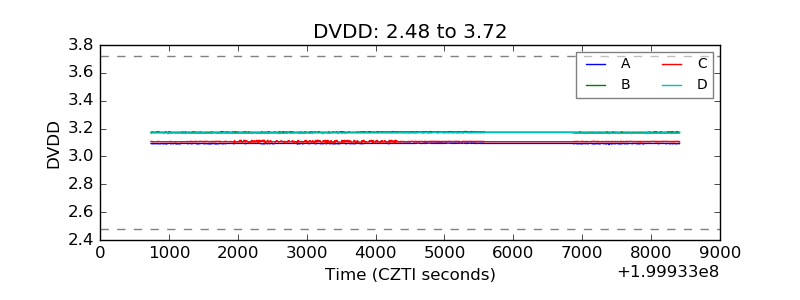 |
| Temperature 1 | 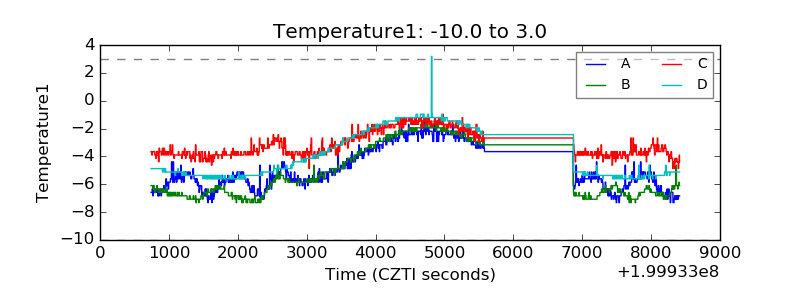 |
| Veto HV Monitor | 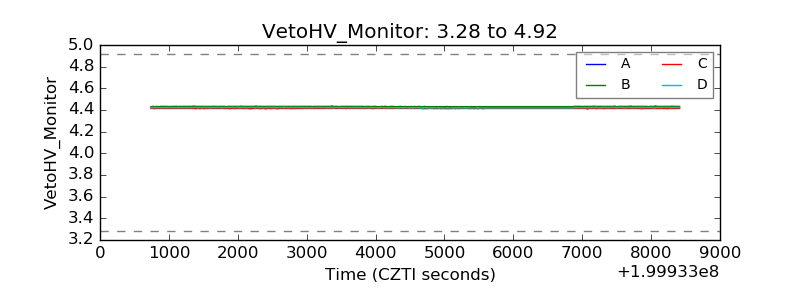 |
| Veto LLD | 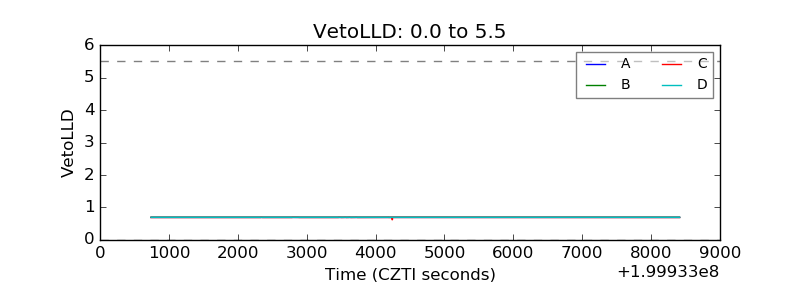 |
| Alpha Counter | 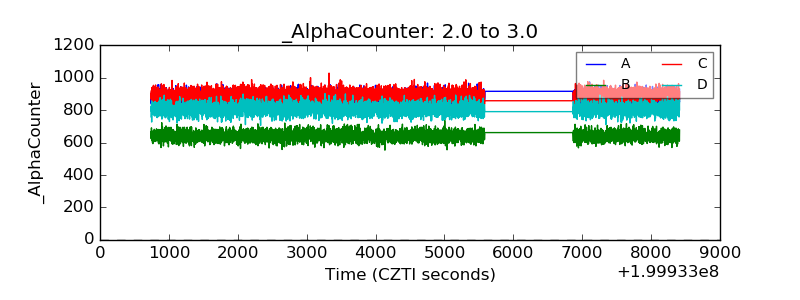 |
| _CPM_Rate | 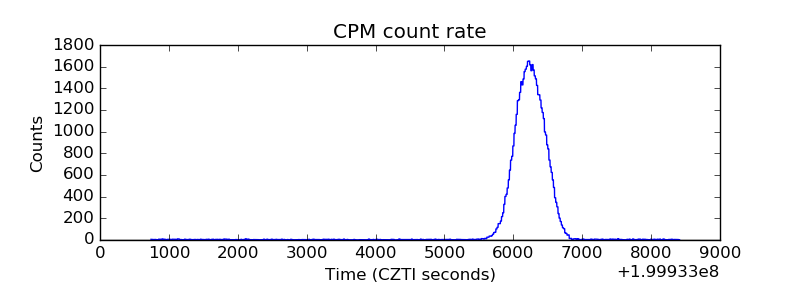 |
| CZT Counter | 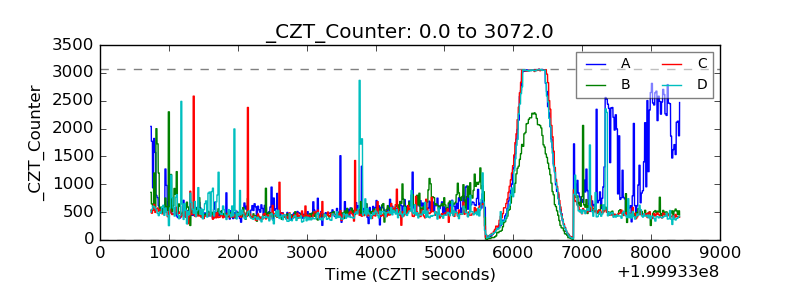 |
| +2.5 Volts monitor |  |
| +5 Volts monitor |  |
| _ROLL_ROT | 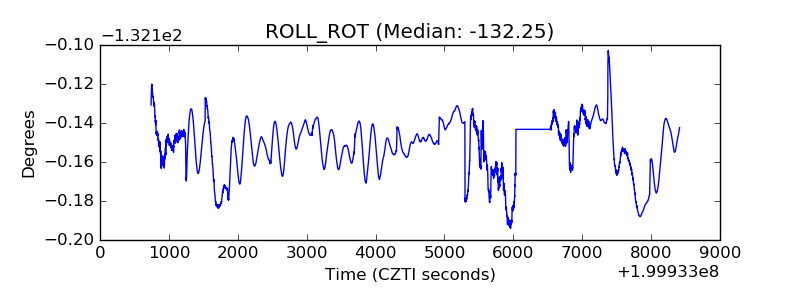 |
| _Roll_DEC | 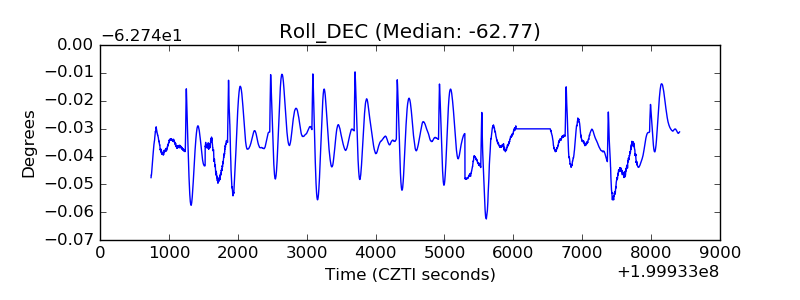 |
| _Roll_RA | 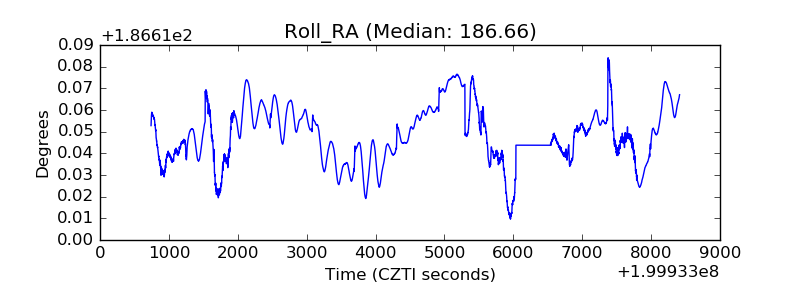 |
| Veto Counter | 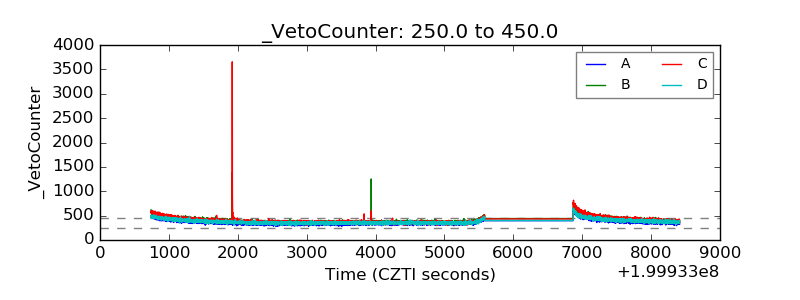 |