| Param | Original file | Final file |
|---|---|---|
| Filename | modeM0/AS1G05_221T01_9000000438_03228cztM0_level2.evt | modeM0/AS1G05_221T01_9000000438_03228cztM0_level2_quad_clean.evt |
| Size (bytes) | 563,284,800 | 77,454,720 |
| Size | 537.2 MB | 73.9 MB |
| Events in quadrant A | 6,856,964 | 447,569 |
| Events in quadrant B | 3,489,131 | 494,431 |
| Events in quadrant C | 3,181,494 | 492,544 |
| Events in quadrant D | 3,099,179 | 465,669 |
| Mode SS | |||
|---|---|---|---|
| Quadrant | BADHDUFLAG | Total packets | Discarded packets |
| A | 0 | 130 | 0 |
| B | 0 | 130 | 0 |
| C | 0 | 130 | 0 |
| D | 0 | 130 | 0 |
| Mode M0 | |||
|---|---|---|---|
| Quadrant | BADHDUFLAG | Total packets | Discarded packets |
| A | 0 | 24562 | 3 |
| B | 0 | 14421 | 2 |
| C | 0 | 13552 | 2 |
| D | 0 | 13666 | 2 |
| Mode M9 | |||
|---|---|---|---|
| Quadrant | BADHDUFLAG | Total packets | Discarded packets |
| A | 0 | 15 | 0 |
| B | 0 | 15 | 0 |
| C | 0 | 15 | 0 |
| D | 0 | 16 | 0 |
| Quadrant | Total seconds | Saturated seconds | Saturation percentage |
|---|---|---|---|
| A | 6375 | 1324 | 20.768627% |
| B | 6375 | 45 | 0.705882% |
| C | 6375 | 51 | 0.800000% |
| D | 6375 | 36 | 0.564706% |
Noise dominated data is calculated using 1-second bins in cleaned event files. If a bin has >2000 counts, and if more than 50% of those come from <1% of pixels, then it is considered to be noise-dominated and hence unusable.
| Quadrant | # 1 sec bins | Bins with >0 counts | Bins with >2000 counts | High rate bins dominated by noise | Noise dominated (total time) | Noise dominated (detector-on time) | Marked lightcurve |
|---|---|---|---|---|---|---|---|
| A | 7645 | 6376 | 1224 | 1224 | 16.01% | 19.20% |  |
| B | 7645 | 6376 | 2 | 2 | 0.03% | 0.03% | 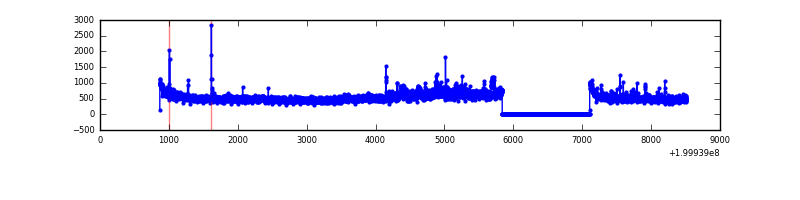 |
| C | 7645 | 6375 | 24 | 24 | 0.31% | 0.38% | 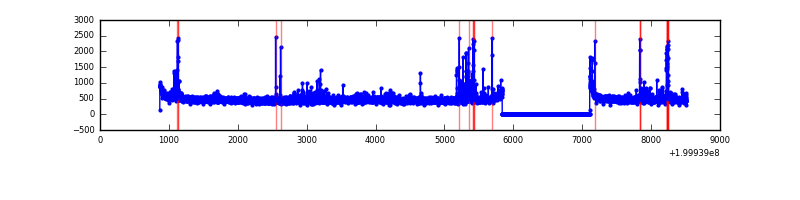 |
| D | 7645 | 6376 | 16 | 16 | 0.21% | 0.25% | 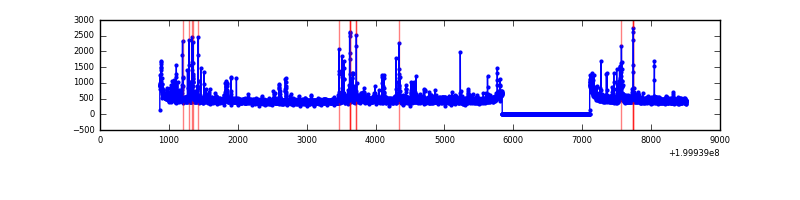 |
Top three noisy pixels from each quadrant. If the there are fewer than three noisy pixels in the level2.evt file, extra rows are filled as -1
| Pixel properties | Quadrant properties | ||||||
|---|---|---|---|---|---|---|---|
| Quadrant | DetID | PixID | Counts | Sigma | Mean | Median | Sigma |
| A | 0 | 50 | 1872890 | 13137.84 | 698 | 685 | 142.5 |
| A | 0 | 199 | 1446806 | 10147.87 | 698 | 685 | 142.5 |
| A | 0 | 118 | 616314 | 4320.06 | 698 | 685 | 142.5 |
| B | 15 | 204 | 373956 | 2540.28 | 782 | 766 | 146.9 |
| B | 3 | 0 | 24430 | 161.08 | 782 | 766 | 146.9 |
| B | 7 | 252 | 21134 | 138.64 | 782 | 766 | 146.9 |
| C | 14 | 223 | 123206 | 704.15 | 754 | 760 | 173.9 |
| C | 6 | 80 | 63903 | 363.12 | 754 | 760 | 173.9 |
| C | 14 | 48 | 34999 | 196.9 | 754 | 760 | 173.9 |
| D | 13 | 223 | 107469 | 601.47 | 741 | 721 | 177.5 |
| D | 2 | 107 | 39346 | 217.63 | 741 | 721 | 177.5 |
| D | 5 | 233 | 38228 | 211.33 | 741 | 721 | 177.5 |
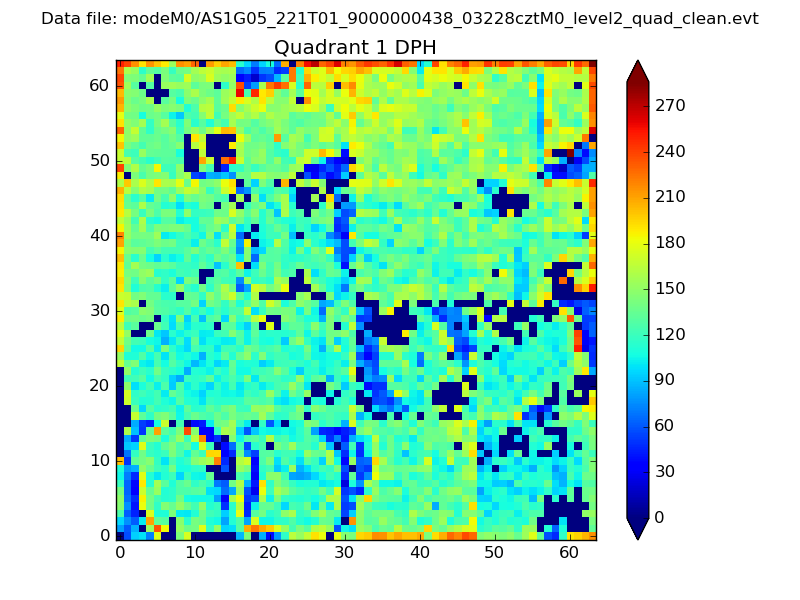
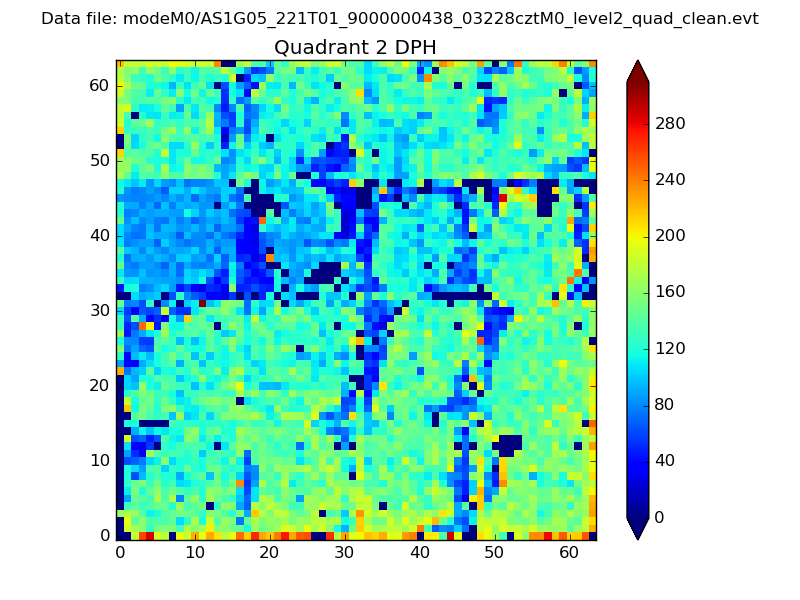
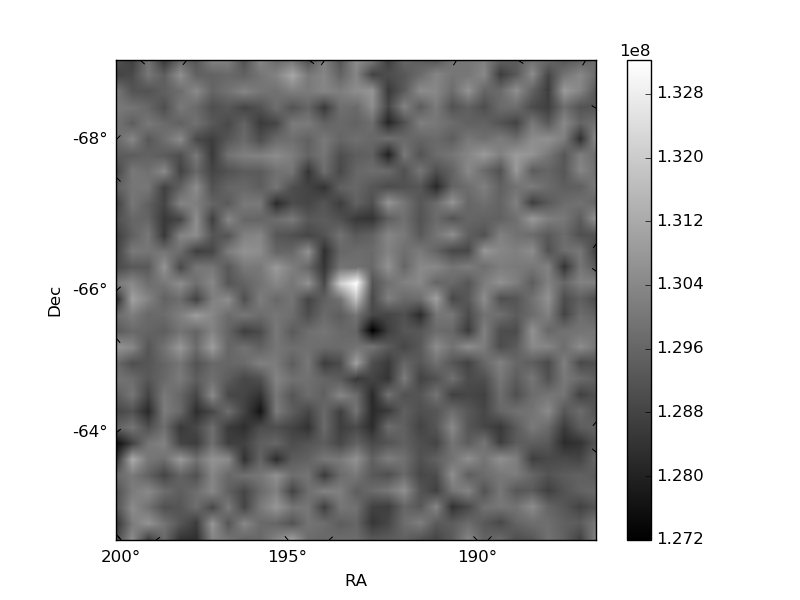
Histogram calculated using DETX and DETY for each event in the final _common_clean file
| Quadrant A | 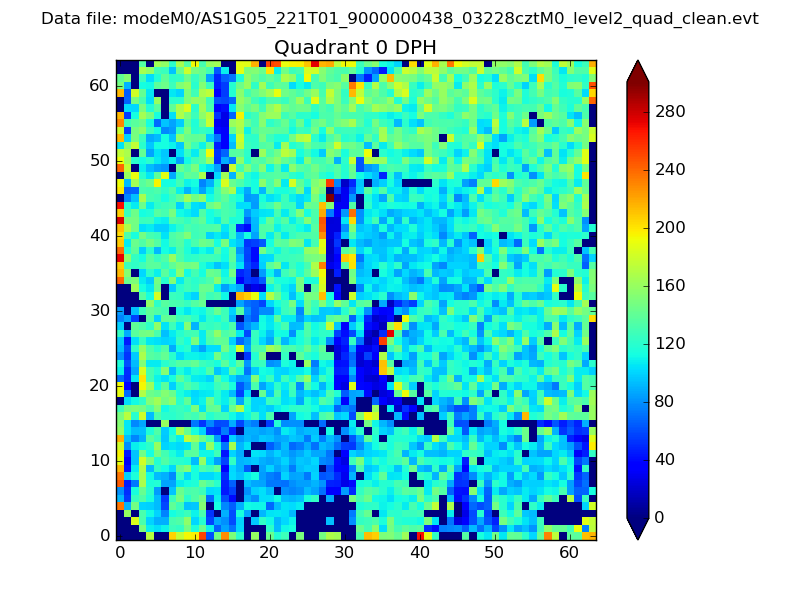 |
 |
Quadrant B |
|---|---|---|---|
| Quadrant D | 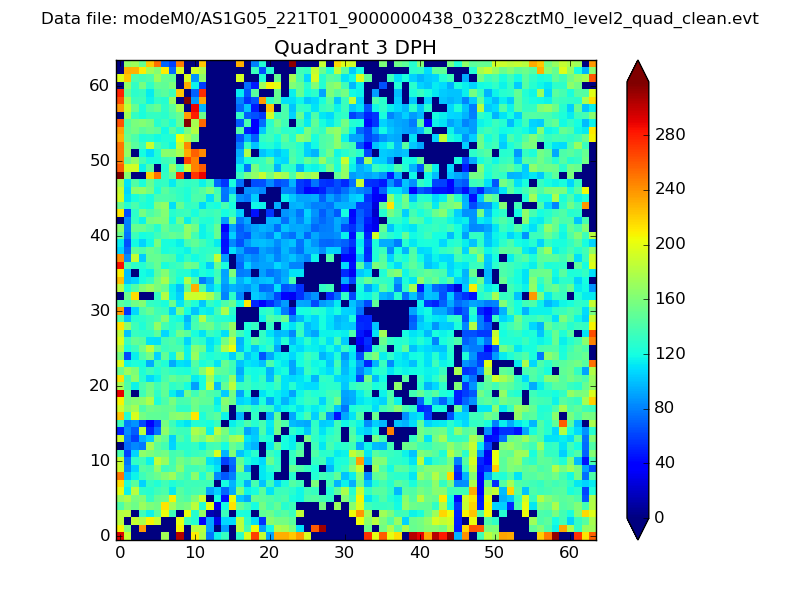 |
 |
Quadrant C |
| Plot type | Count rate plots | Images |
|---|---|---|
| Comparison with Poisson distribution Blue bars denote a histogram of data divided into 1 sec bins. Red curve is a Poisson curve with rate = median count rate of data. |
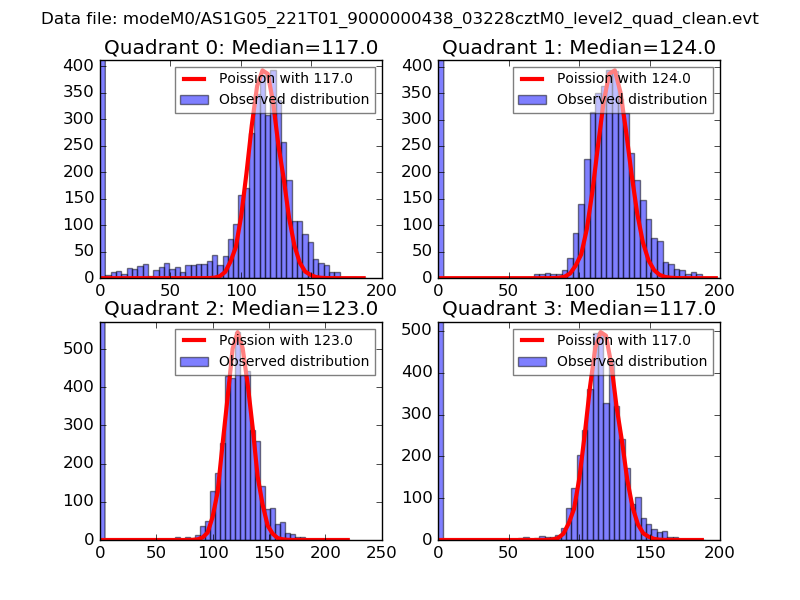 |
 |
| Quadrant-wise count rates Data is divided into 100 sec bins |
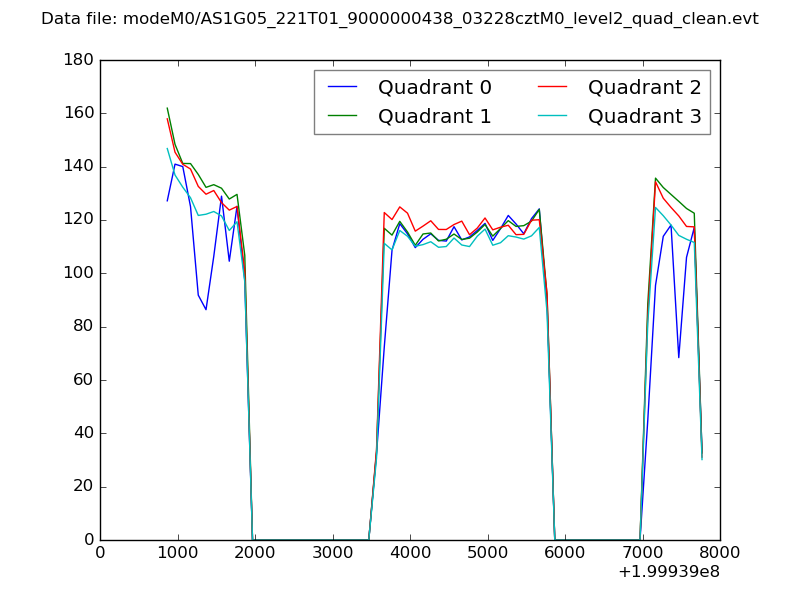 |
|
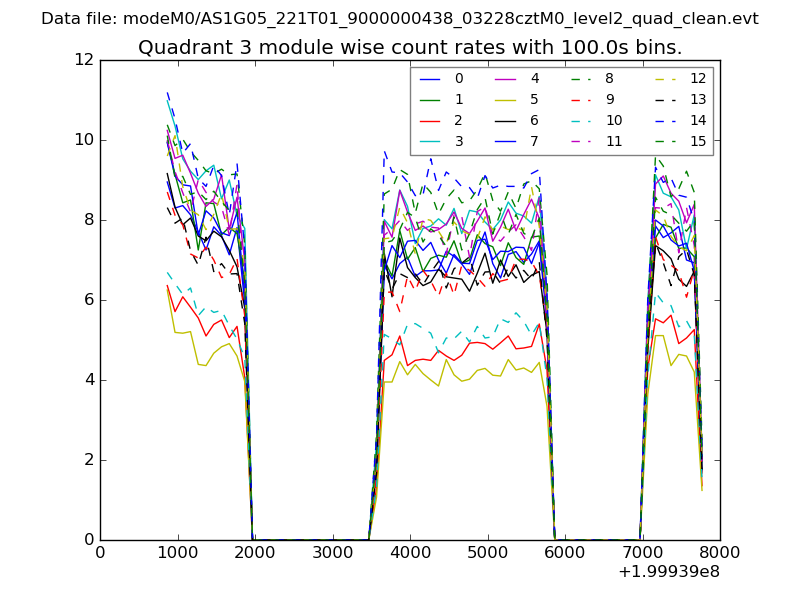
| Module-wise count rates for Quadrant A Data is divided into 100 sec bins |
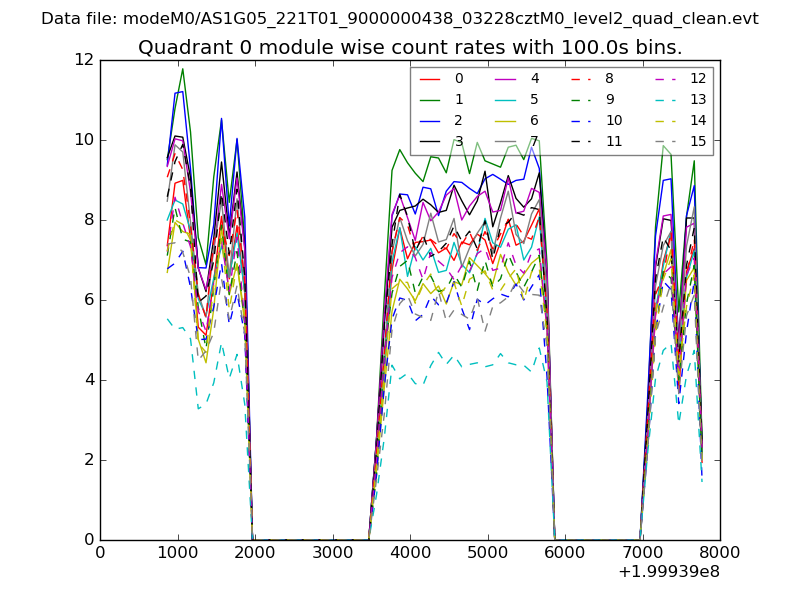 |
 |
| Module-wise count rates for Quadrant B Data is divided into 100 sec bins |
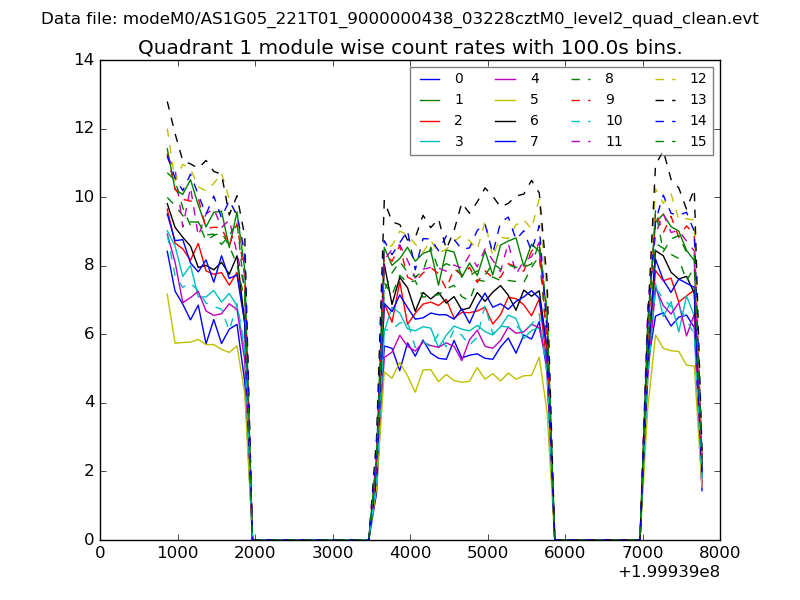 |
 |
| Module-wise count rates for Quadrant C Data is divided into 100 sec bins |
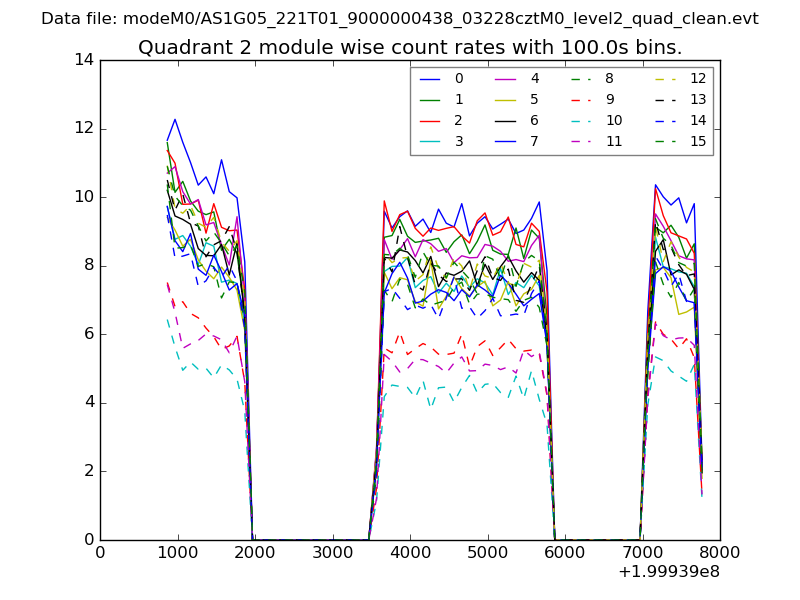 |
 |
| Module-wise count rates for Quadrant D Data is divided into 100 sec bins |
 |
 |
| Parameter | Plot |
|---|---|
| CZT HV Monitor | 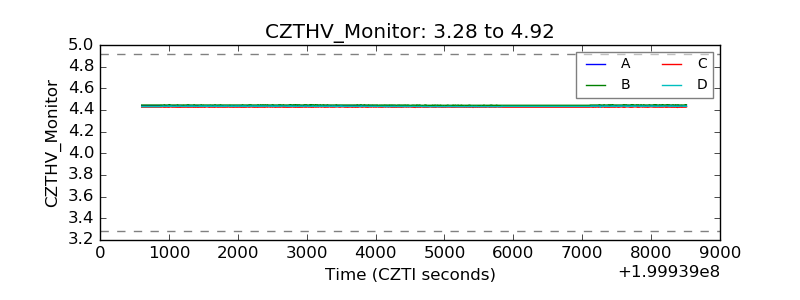 |
| D_VDD | 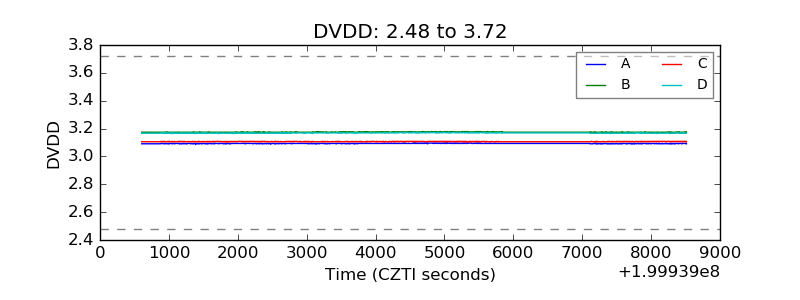 |
| Temperature 1 | 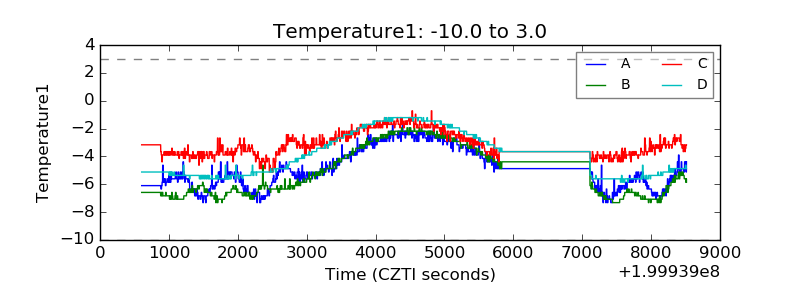 |
| Veto HV Monitor | 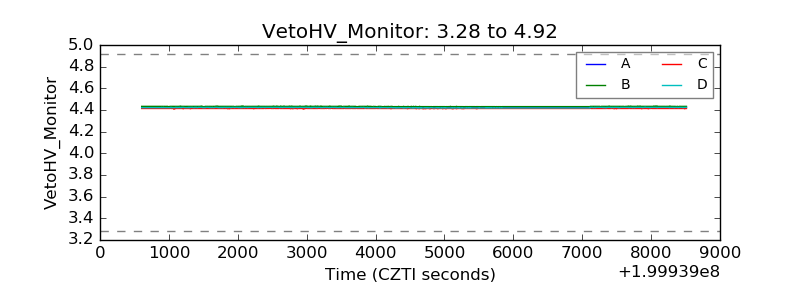 |
| Veto LLD | 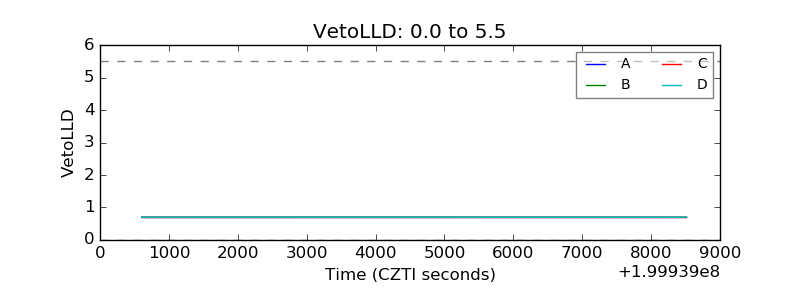 |
| Alpha Counter | 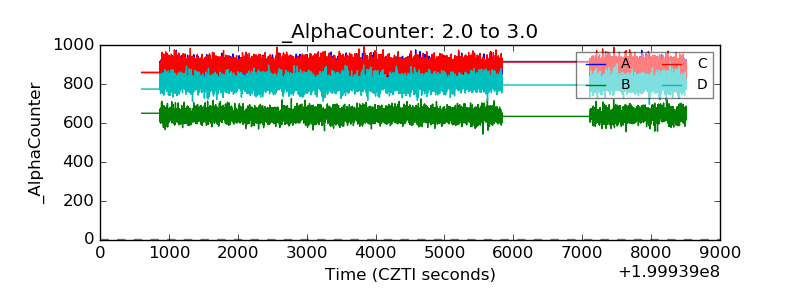 |
| _CPM_Rate | 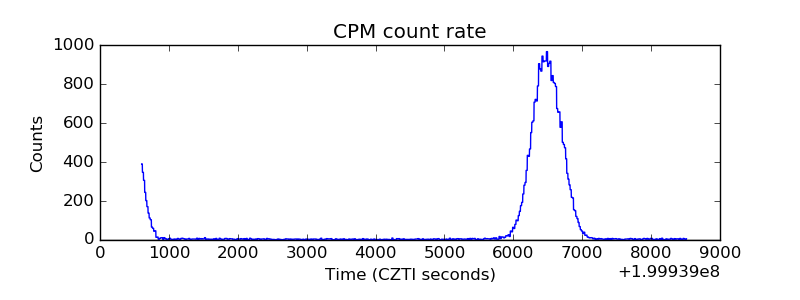 |
| CZT Counter | 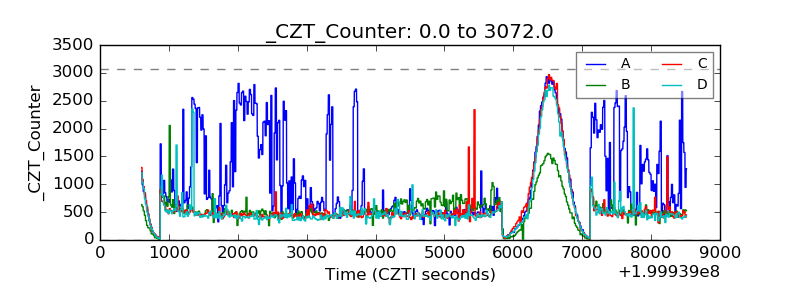 |
| +2.5 Volts monitor | 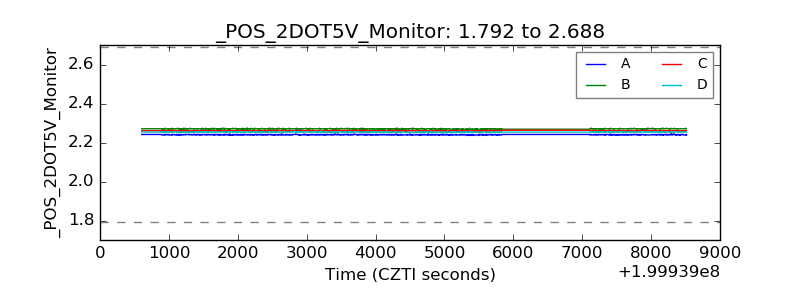 |
| +5 Volts monitor |  |
| _ROLL_ROT | 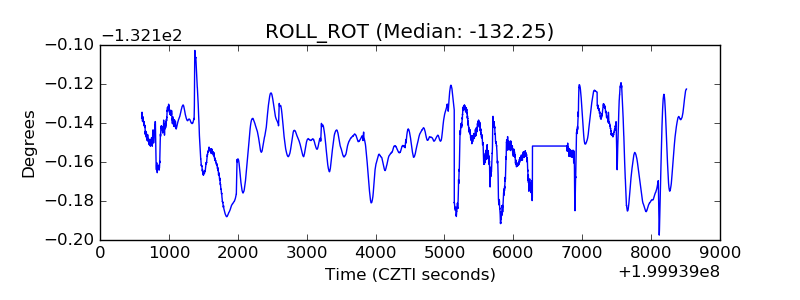 |
| _Roll_DEC | 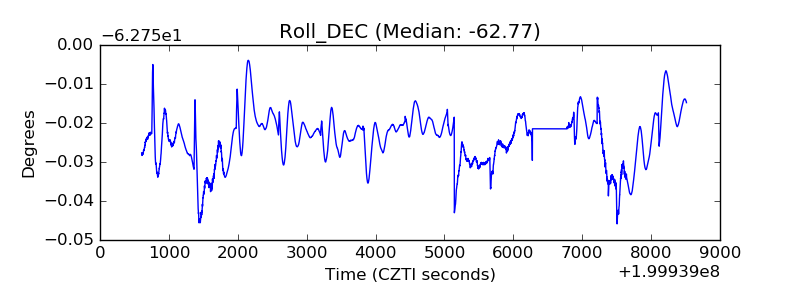 |
| _Roll_RA | 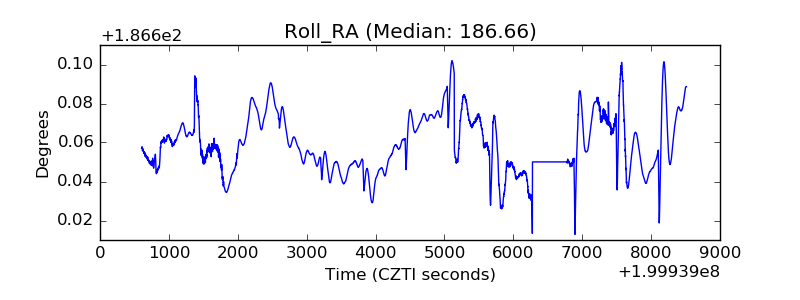 |
| Veto Counter | 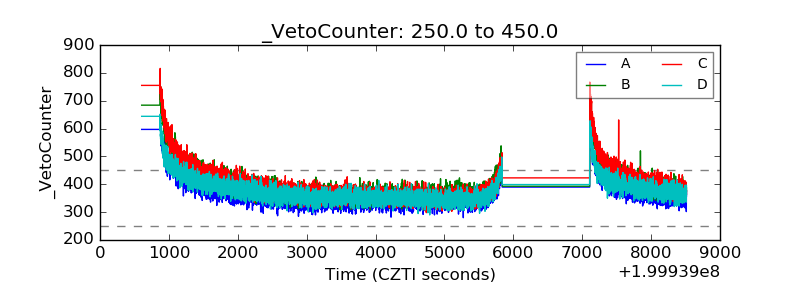 |