| Param | Original file | Final file |
|---|---|---|
| Filename | modeM0/AS1G05_221T01_9000000438_03229cztM0_level2.evt | modeM0/AS1G05_221T01_9000000438_03229cztM0_level2_quad_clean.evt |
| Size (bytes) | 501,825,600 | 72,725,760 |
| Size | 478.6 MB | 69.4 MB |
| Events in quadrant A | 4,887,559 | 424,258 |
| Events in quadrant B | 3,537,445 | 449,091 |
| Events in quadrant C | 3,146,903 | 450,409 |
| Events in quadrant D | 3,187,686 | 427,934 |
| Mode SS | |||
|---|---|---|---|
| Quadrant | BADHDUFLAG | Total packets | Discarded packets |
| A | 0 | 130 | 0 |
| B | 0 | 130 | 0 |
| C | 0 | 130 | 0 |
| D | 0 | 130 | 0 |
| Mode M0 | |||
|---|---|---|---|
| Quadrant | BADHDUFLAG | Total packets | Discarded packets |
| A | 0 | 18731 | 3 |
| B | 0 | 14619 | 2 |
| C | 0 | 13627 | 2 |
| D | 0 | 14050 | 2 |
| Mode M9 | |||
|---|---|---|---|
| Quadrant | BADHDUFLAG | Total packets | Discarded packets |
| A | 0 | 14 | 0 |
| B | 0 | 14 | 0 |
| C | 0 | 14 | 0 |
| D | 0 | 15 | 0 |
| Quadrant | Total seconds | Saturated seconds | Saturation percentage |
|---|---|---|---|
| A | 6453 | 627 | 9.716411% |
| B | 6453 | 170 | 2.634434% |
| C | 6453 | 158 | 2.448474% |
| D | 6453 | 145 | 2.247017% |
Noise dominated data is calculated using 1-second bins in cleaned event files. If a bin has >2000 counts, and if more than 50% of those come from <1% of pixels, then it is considered to be noise-dominated and hence unusable.
| Quadrant | # 1 sec bins | Bins with >0 counts | Bins with >2000 counts | High rate bins dominated by noise | Noise dominated (total time) | Noise dominated (detector-on time) | Marked lightcurve |
|---|---|---|---|---|---|---|---|
| A | 7523 | 6453 | 408 | 408 | 5.42% | 6.32% | 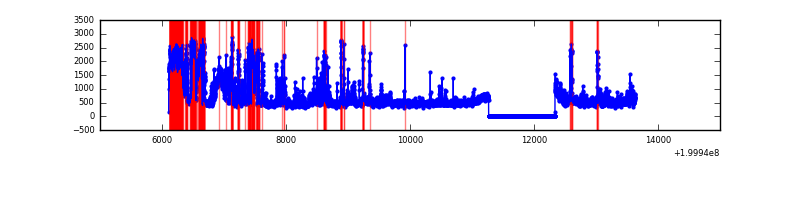 |
| B | 7523 | 6453 | 7 | 7 | 0.09% | 0.11% | 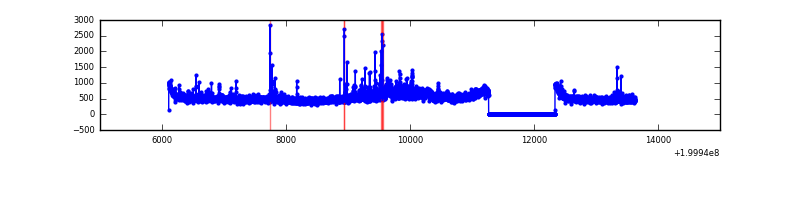 |
| C | 7523 | 6453 | 14 | 14 | 0.19% | 0.22% | 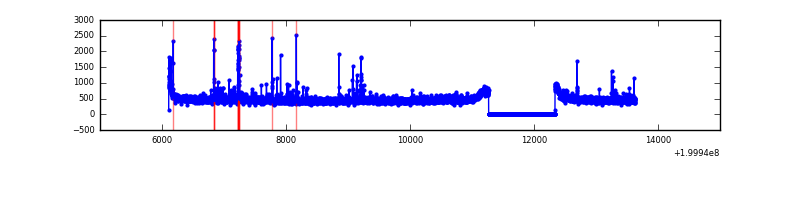 |
| D | 7523 | 6453 | 20 | 20 | 0.27% | 0.31% | 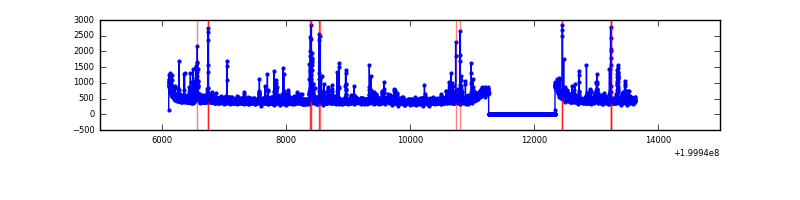 |
Top three noisy pixels from each quadrant. If the there are fewer than three noisy pixels in the level2.evt file, extra rows are filled as -1
| Pixel properties | Quadrant properties | ||||||
|---|---|---|---|---|---|---|---|
| Quadrant | DetID | PixID | Counts | Sigma | Mean | Median | Sigma |
| A | 0 | 50 | 1118378 | 7364.63 | 747 | 732 | 151.8 |
| A | 0 | 118 | 526271 | 3462.99 | 747 | 732 | 151.8 |
| A | 0 | 199 | 235269 | 1545.46 | 747 | 732 | 151.8 |
| B | 15 | 204 | 372256 | 2509.71 | 786 | 767 | 148.0 |
| B | 5 | 200 | 56417 | 375.96 | 786 | 767 | 148.0 |
| B | 2 | 249 | 45859 | 304.63 | 786 | 767 | 148.0 |
| C | 14 | 223 | 111178 | 627.96 | 759 | 763 | 175.8 |
| C | 6 | 80 | 36657 | 204.14 | 759 | 763 | 175.8 |
| C | 1 | 192 | 24689 | 136.07 | 759 | 763 | 175.8 |
| D | 13 | 223 | 155950 | 868.2 | 748 | 728 | 178.8 |
| D | 13 | 120 | 67062 | 371.03 | 748 | 728 | 178.8 |
| D | 4 | 80 | 29255 | 159.56 | 748 | 728 | 178.8 |
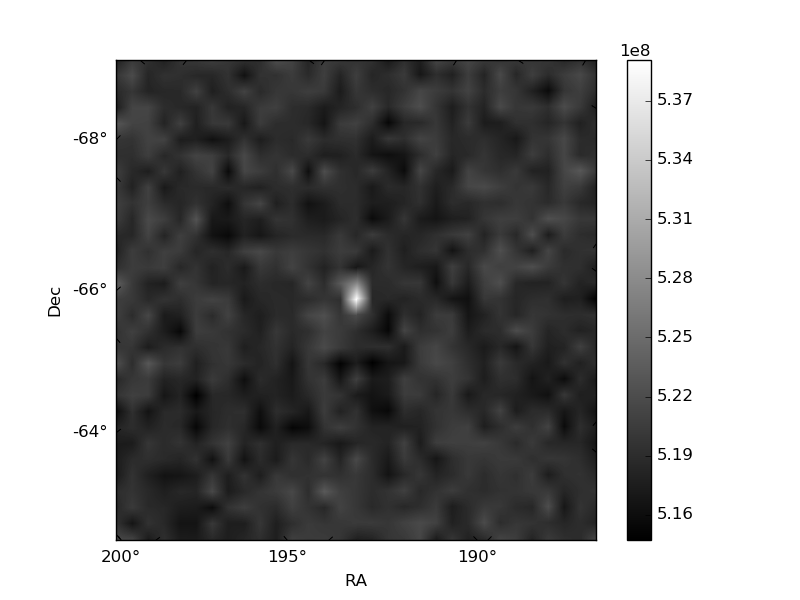
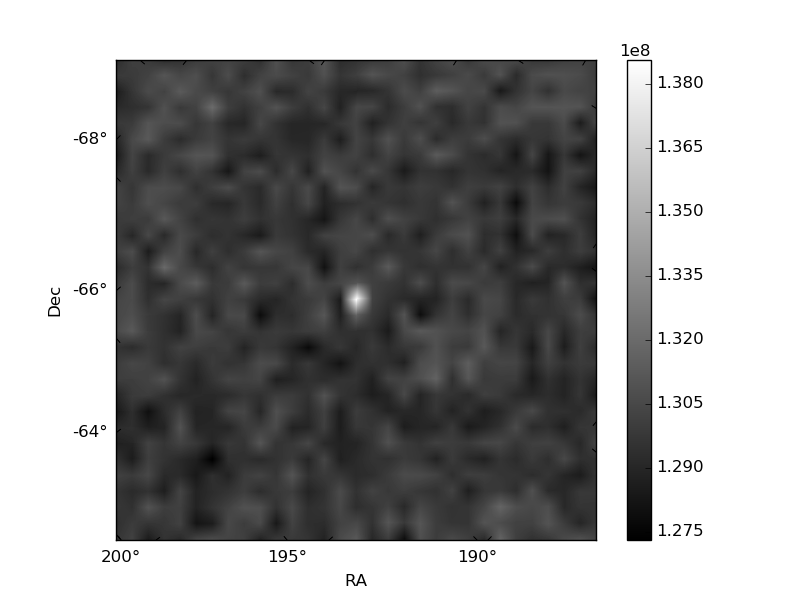
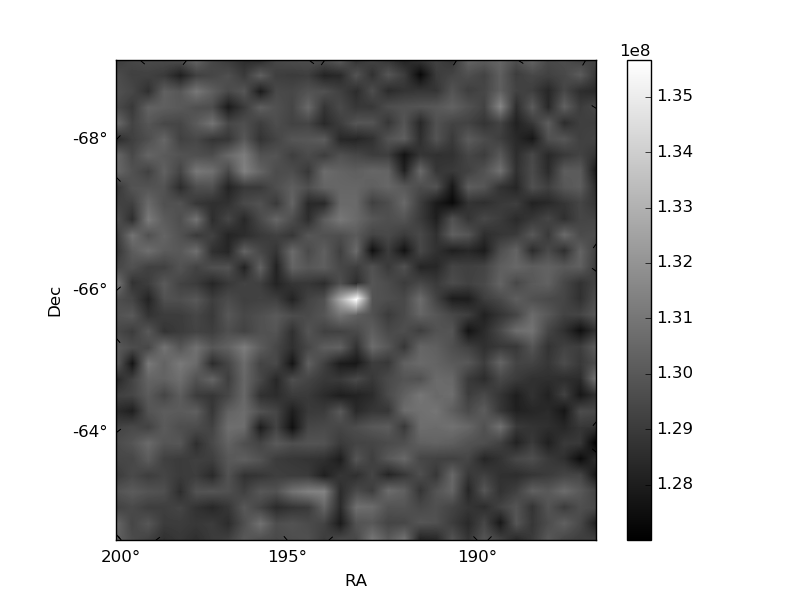
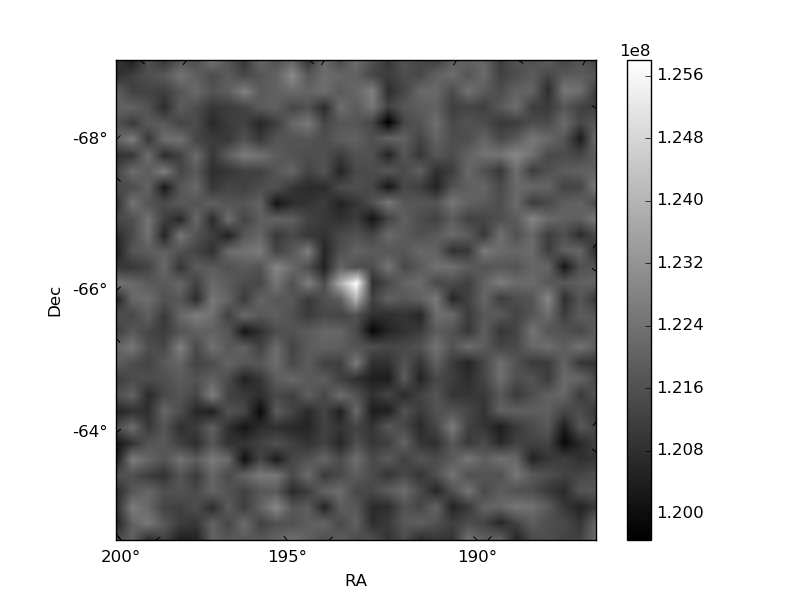
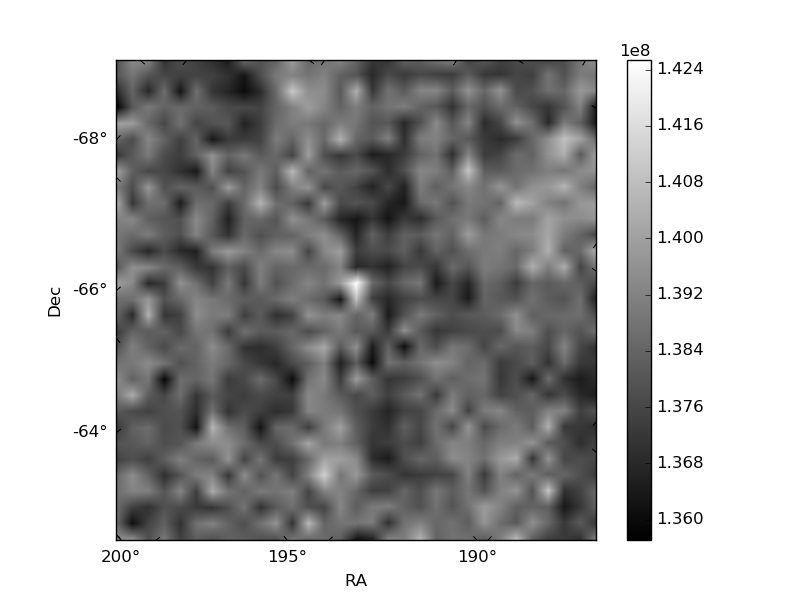
Histogram calculated using DETX and DETY for each event in the final _common_clean file
| Quadrant A | 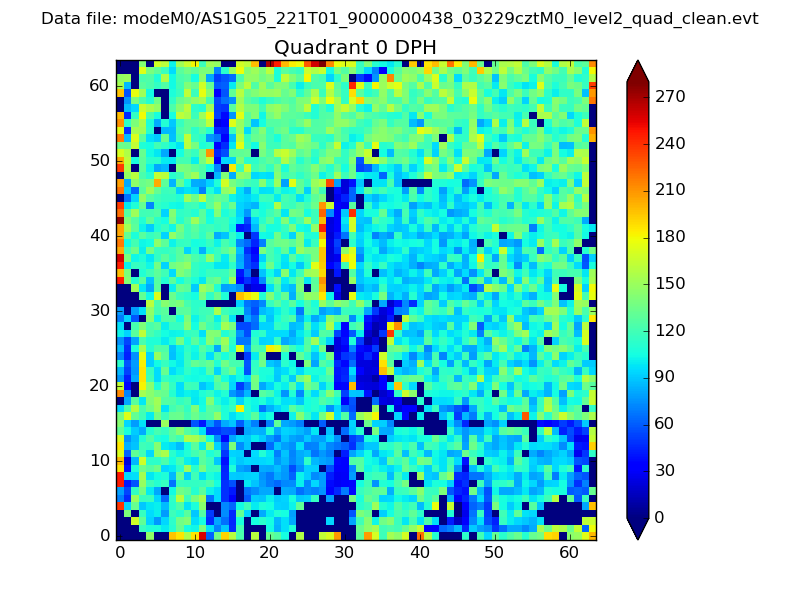 |
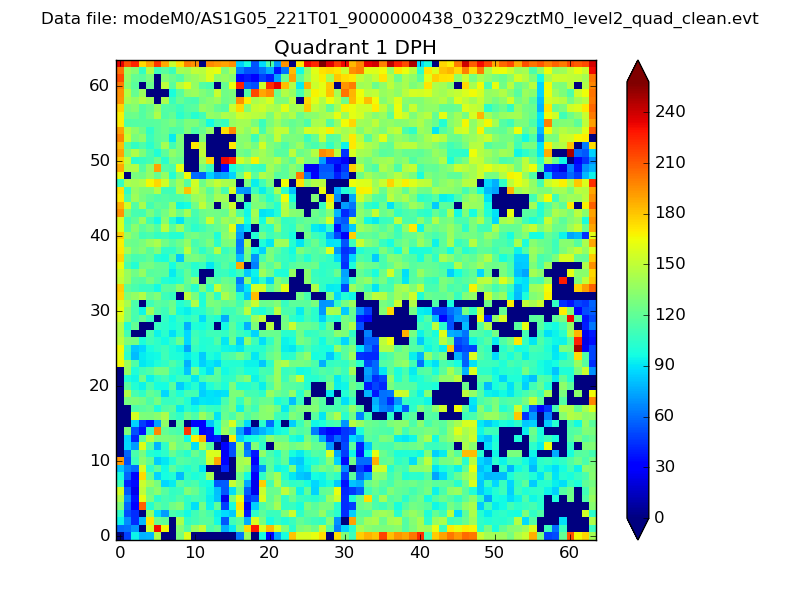 |
Quadrant B |
|---|---|---|---|
| Quadrant D | 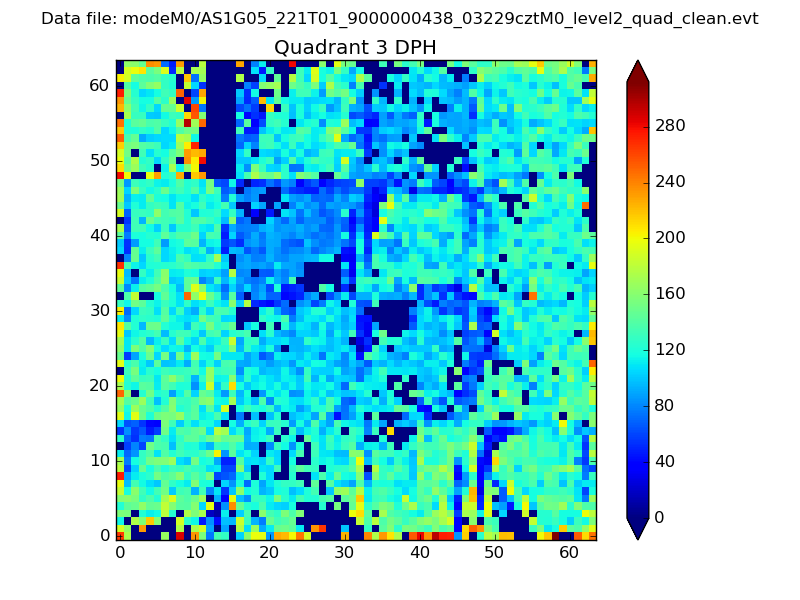 |
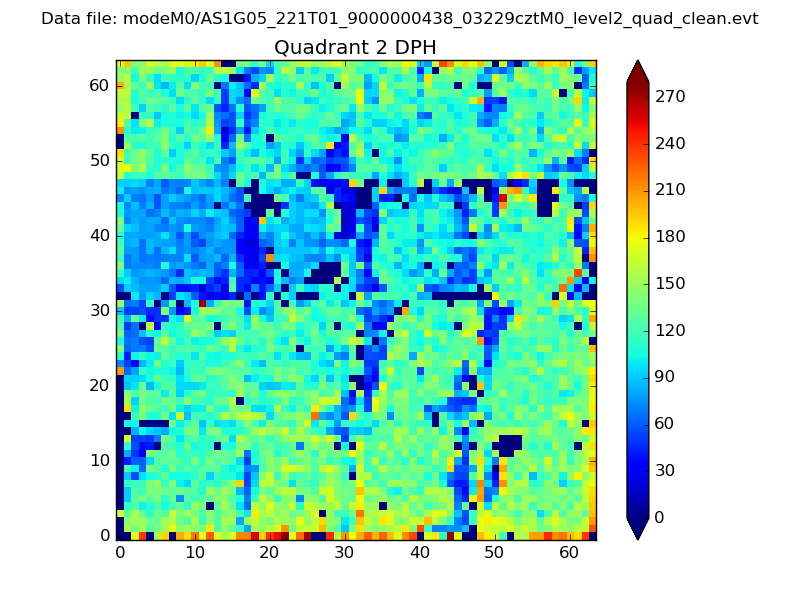 |
Quadrant C |
| Plot type | Count rate plots | Images |
|---|---|---|
| Comparison with Poisson distribution Blue bars denote a histogram of data divided into 1 sec bins. Red curve is a Poisson curve with rate = median count rate of data. |
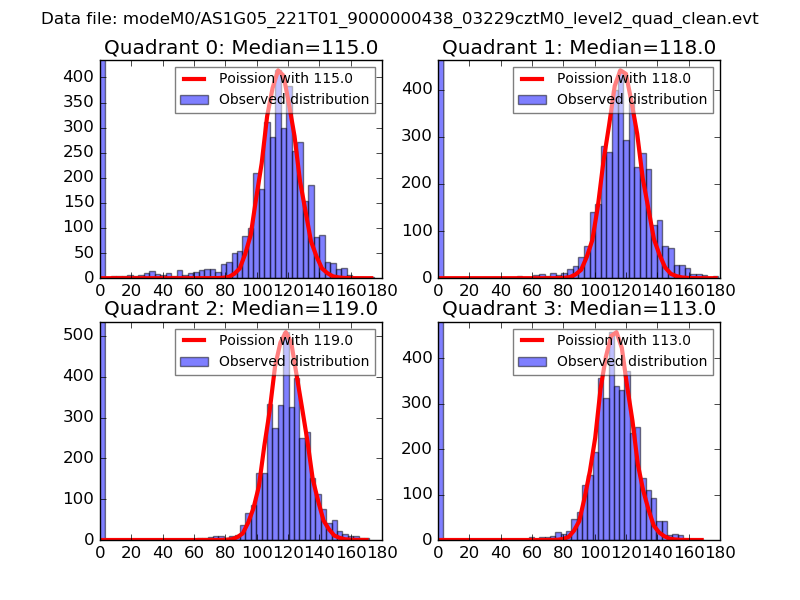 |
 |
| Quadrant-wise count rates Data is divided into 100 sec bins |
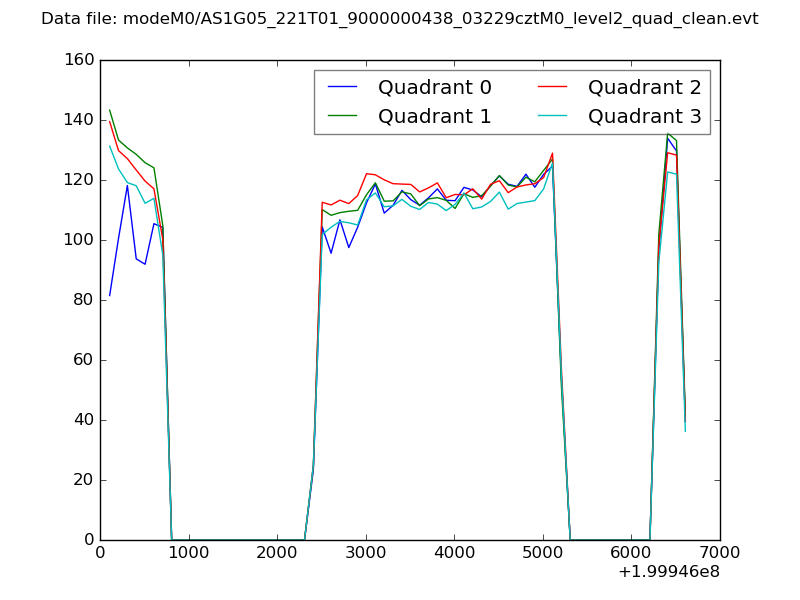 |
|
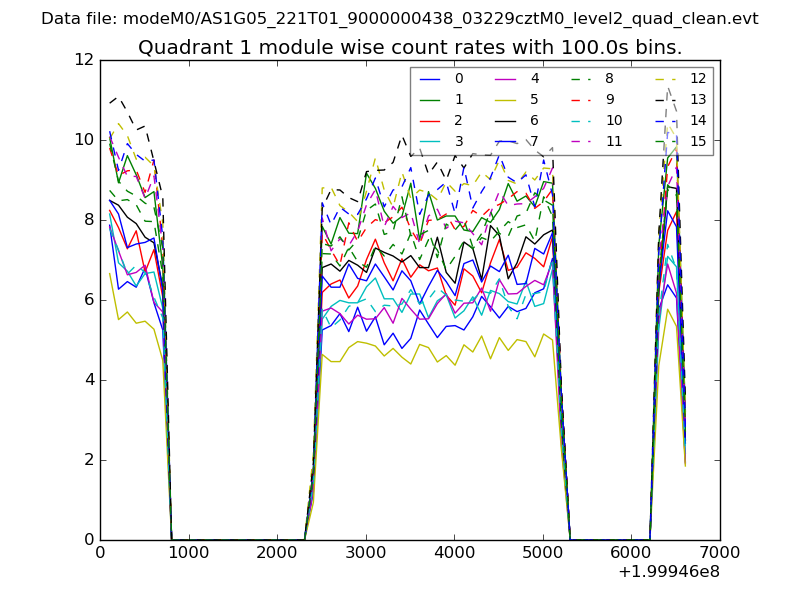
| Module-wise count rates for Quadrant A Data is divided into 100 sec bins |
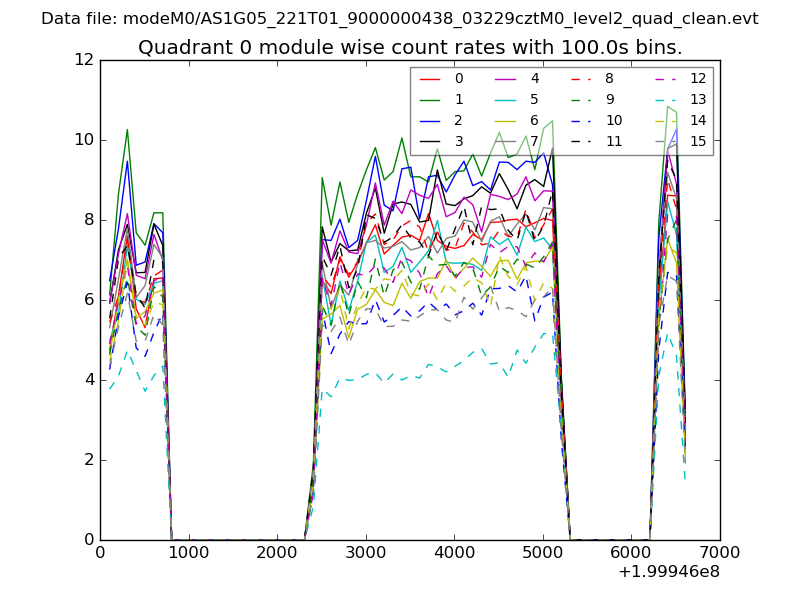 |
 |
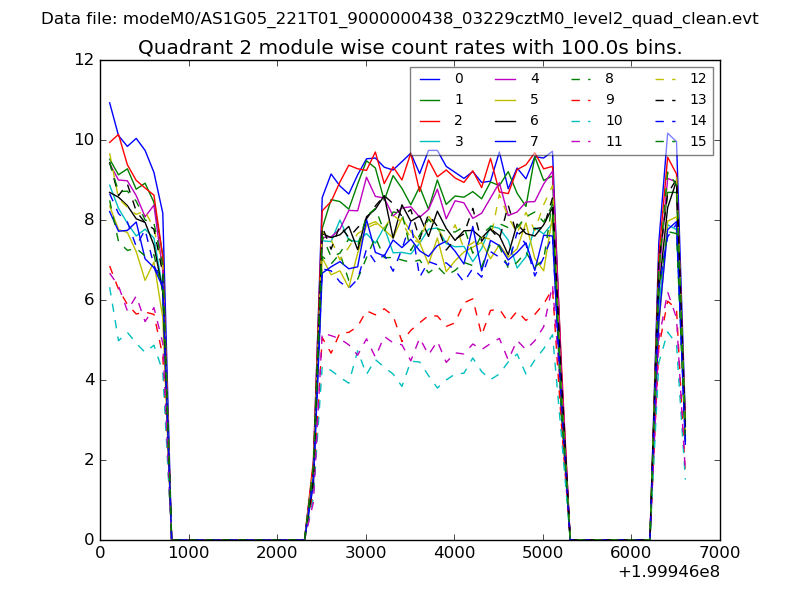
| Module-wise count rates for Quadrant B Data is divided into 100 sec bins |
 |
 |
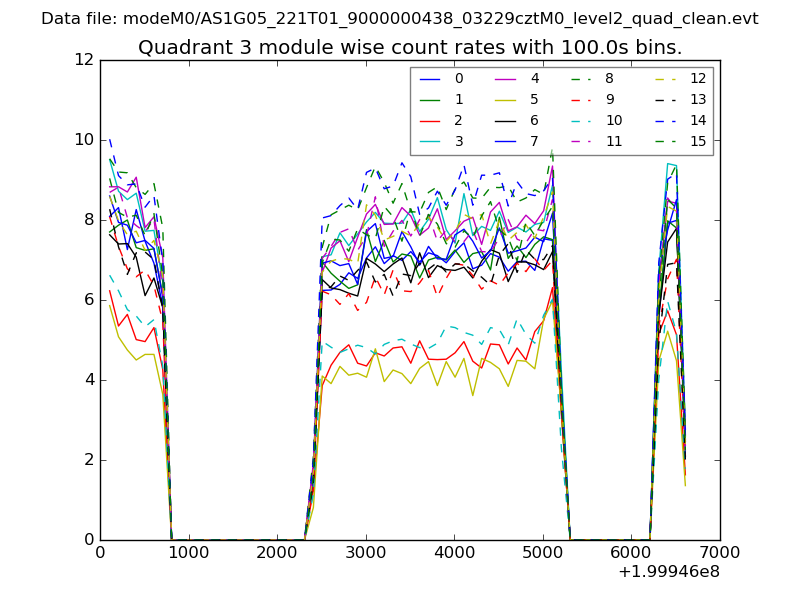
| Module-wise count rates for Quadrant C Data is divided into 100 sec bins |
 |
 |
| Module-wise count rates for Quadrant D Data is divided into 100 sec bins |
 |
 |
| Parameter | Plot |
|---|---|
| CZT HV Monitor | 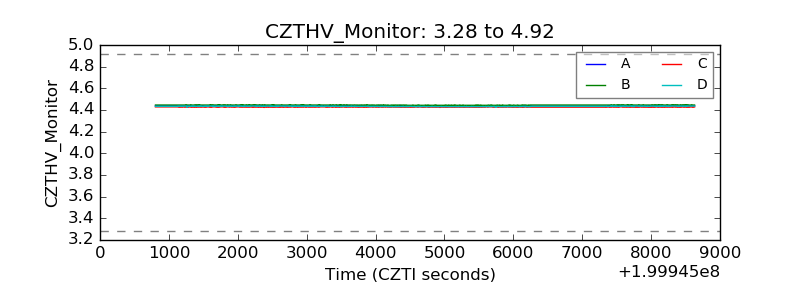 |
| D_VDD | 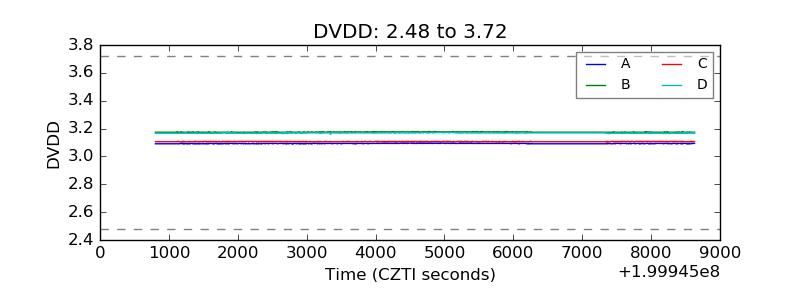 |
| Temperature 1 | 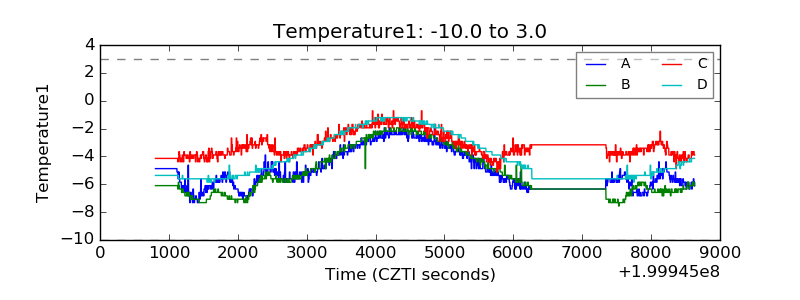 |
| Veto HV Monitor |  |
| Veto LLD | 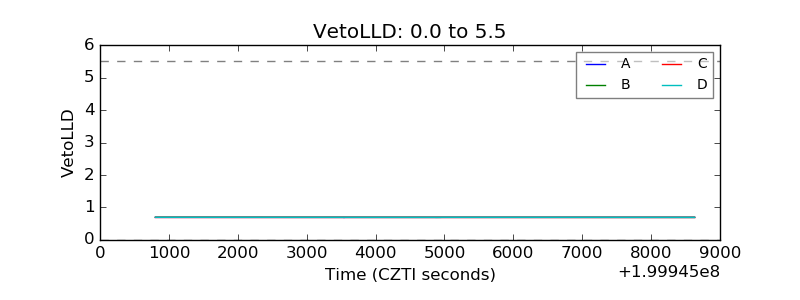 |
| Alpha Counter | 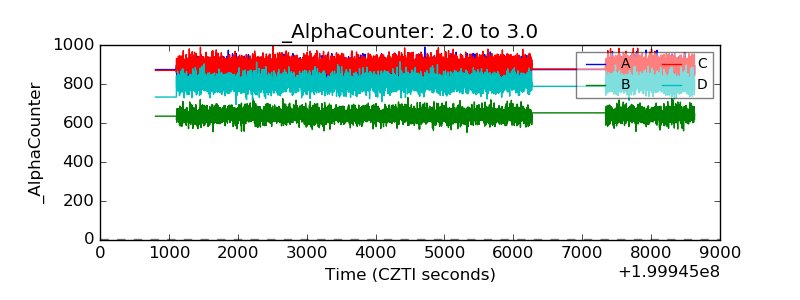 |
| _CPM_Rate | 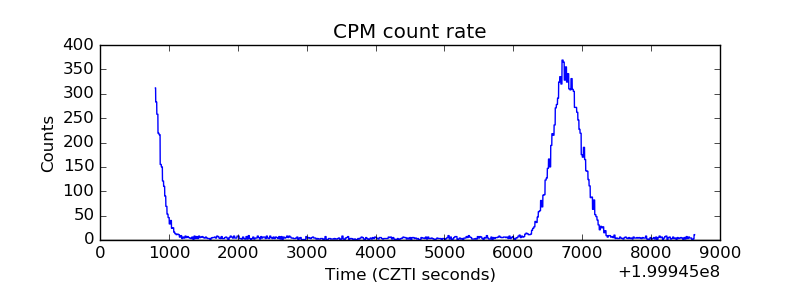 |
| CZT Counter | 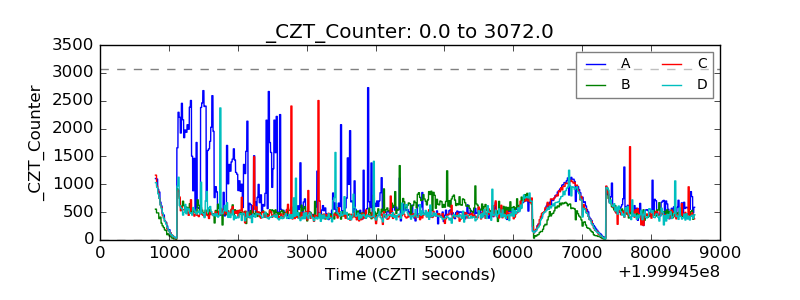 |
| +2.5 Volts monitor |  |
| +5 Volts monitor |  |
| _ROLL_ROT | 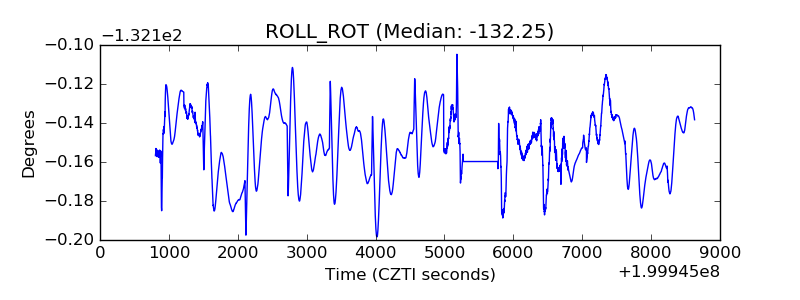 |
| _Roll_DEC | 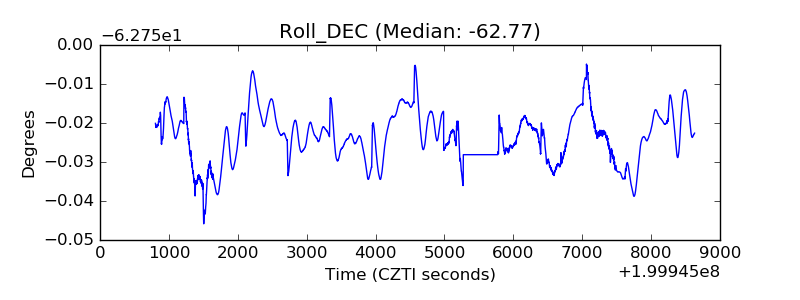 |
| _Roll_RA | 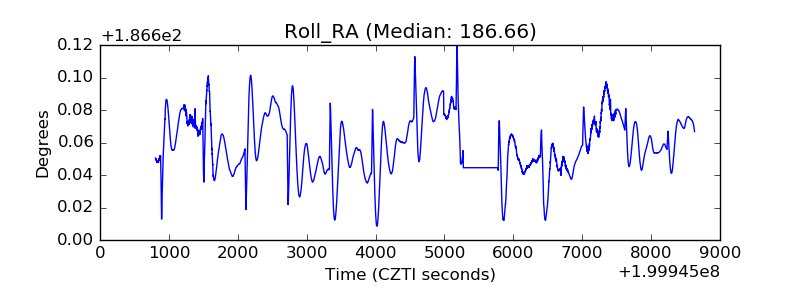 |
| Veto Counter | 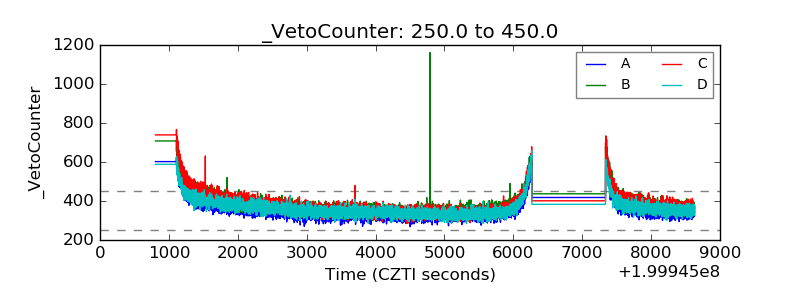 |