| Param | Original file | Final file |
|---|---|---|
| Filename | modeM0/AS1G05_221T01_9000000438_03230cztM0_level2.evt | modeM0/AS1G05_221T01_9000000438_03230cztM0_level2_quad_clean.evt |
| Size (bytes) | 598,127,040 | 80,758,080 |
| Size | 570.4 MB | 77.0 MB |
| Events in quadrant A | 4,271,072 | 486,858 |
| Events in quadrant B | 4,277,792 | 485,384 |
| Events in quadrant C | 5,241,728 | 484,696 |
| Events in quadrant D | 3,822,582 | 474,210 |
| Mode SS | |||
|---|---|---|---|
| Quadrant | BADHDUFLAG | Total packets | Discarded packets |
| A | 0 | 152 | 0 |
| B | 0 | 152 | 0 |
| C | 0 | 152 | 0 |
| D | 0 | 152 | 0 |
| Mode M0 | |||
|---|---|---|---|
| Quadrant | BADHDUFLAG | Total packets | Discarded packets |
| A | 0 | 17584 | 3 |
| B | 0 | 17415 | 2 |
| C | 0 | 20693 | 2 |
| D | 0 | 16724 | 2 |
| Mode M9 | |||
|---|---|---|---|
| Quadrant | BADHDUFLAG | Total packets | Discarded packets |
| A | 0 | 19 | 0 |
| B | 0 | 19 | 0 |
| C | 0 | 19 | 0 |
| D | 0 | 19 | 0 |
| Quadrant | Total seconds | Saturated seconds | Saturation percentage |
|---|---|---|---|
| A | 7383 | 336 | 4.550996% |
| B | 7383 | 315 | 4.266558% |
| C | 7383 | 959 | 12.989300% |
| D | 7383 | 284 | 3.846675% |
Noise dominated data is calculated using 1-second bins in cleaned event files. If a bin has >2000 counts, and if more than 50% of those come from <1% of pixels, then it is considered to be noise-dominated and hence unusable.
| Quadrant | # 1 sec bins | Bins with >0 counts | Bins with >2000 counts | High rate bins dominated by noise | Noise dominated (total time) | Noise dominated (detector-on time) | Marked lightcurve |
|---|---|---|---|---|---|---|---|
| A | 9278 | 7383 | 68 | 68 | 0.73% | 0.92% | 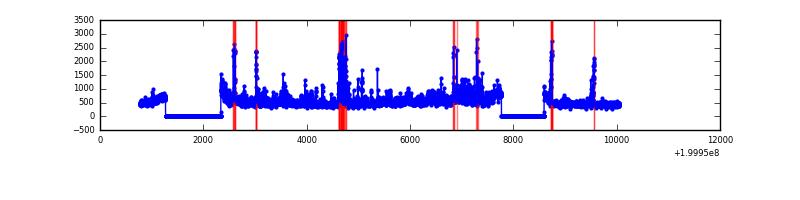 |
| B | 9278 | 7383 | 45 | 45 | 0.49% | 0.61% | 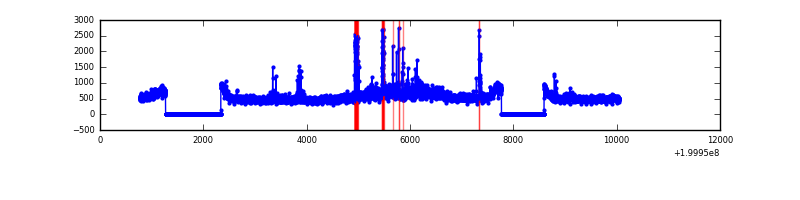 |
| C | 9278 | 7383 | 631 | 631 | 6.80% | 8.55% | 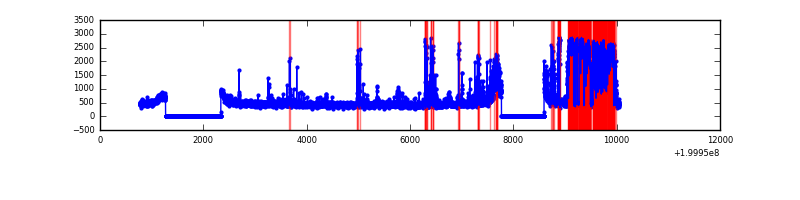 |
| D | 9278 | 7383 | 47 | 47 | 0.51% | 0.64% | 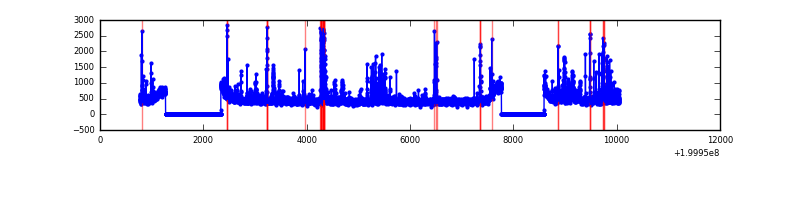 |
Top three noisy pixels from each quadrant. If the there are fewer than three noisy pixels in the level2.evt file, extra rows are filled as -1
| Pixel properties | Quadrant properties | ||||||
|---|---|---|---|---|---|---|---|
| Quadrant | DetID | PixID | Counts | Sigma | Mean | Median | Sigma |
| A | 0 | 199 | 476976 | 2637.02 | 876 | 856 | 180.6 |
| A | 0 | 50 | 272178 | 1502.73 | 876 | 856 | 180.6 |
| A | 0 | 226 | 59354 | 324.0 | 876 | 856 | 180.6 |
| B | 15 | 204 | 578588 | 3382.4 | 892 | 871 | 170.8 |
| B | 4 | 170 | 82215 | 476.25 | 892 | 871 | 170.8 |
| B | 5 | 200 | 62472 | 360.66 | 892 | 871 | 170.8 |
| C | 14 | 223 | 1921868 | 10092.75 | 823 | 826 | 190.3 |
| C | 6 | 80 | 59484 | 308.18 | 823 | 826 | 190.3 |
| C | 15 | 208 | 21987 | 111.18 | 823 | 826 | 190.3 |
| D | 13 | 120 | 259856 | 1241.47 | 855 | 828 | 208.6 |
| D | 13 | 223 | 137819 | 656.57 | 855 | 828 | 208.6 |
| D | 9 | 85 | 74189 | 351.61 | 855 | 828 | 208.6 |
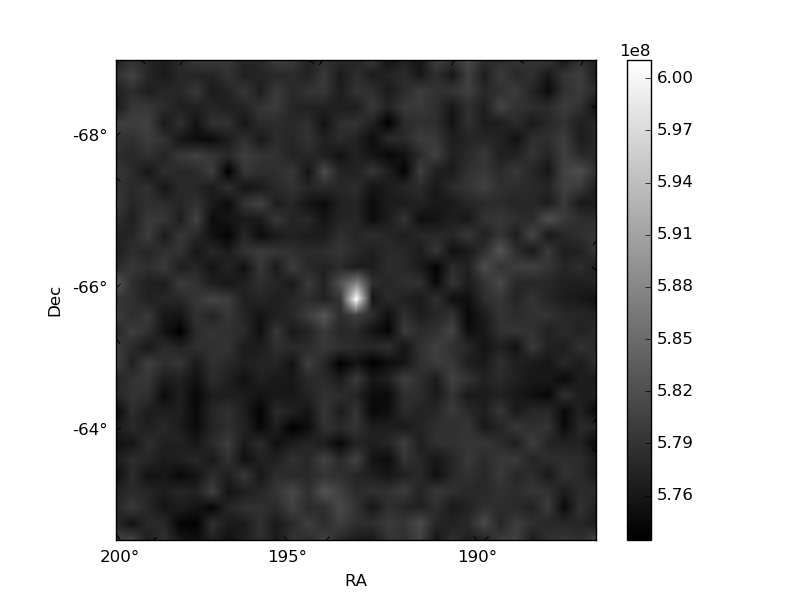
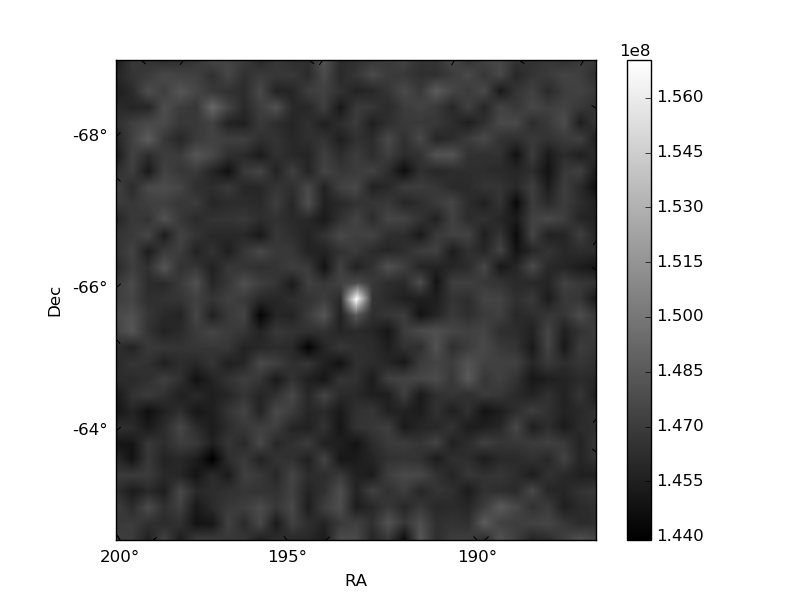
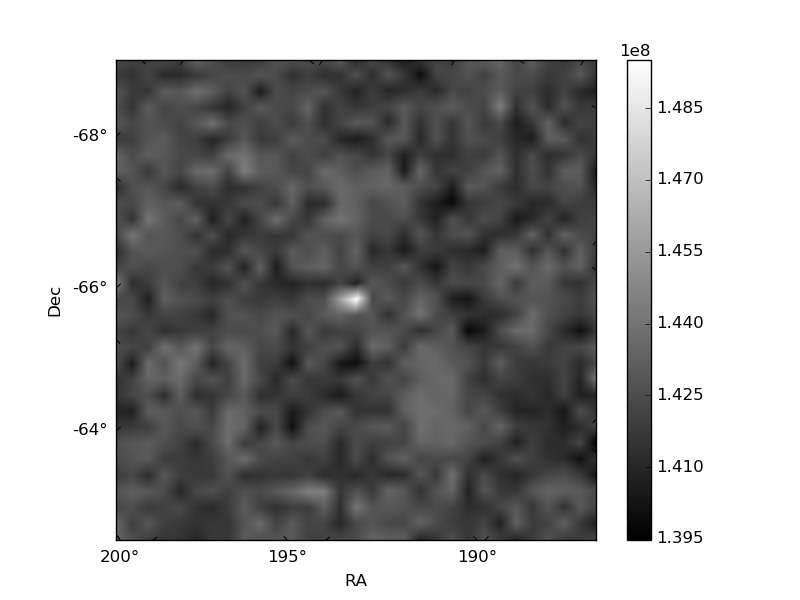
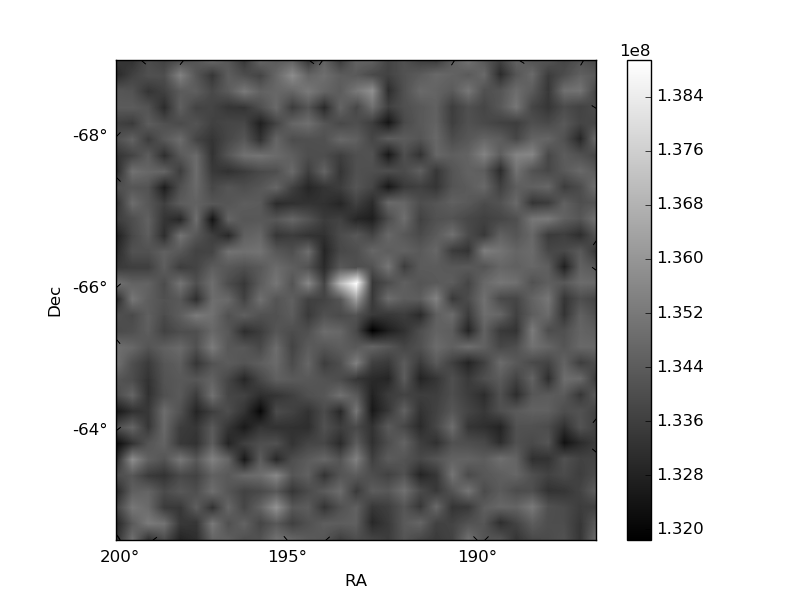
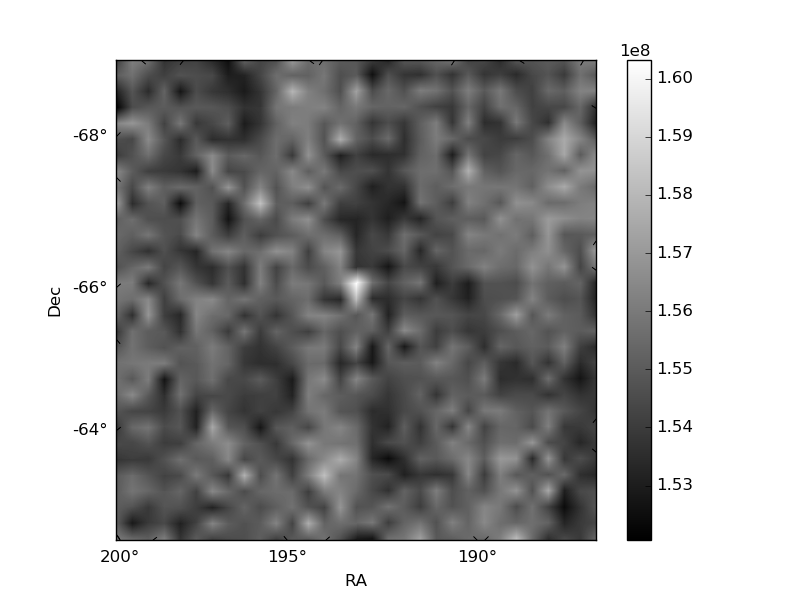
Histogram calculated using DETX and DETY for each event in the final _common_clean file
| Quadrant A | 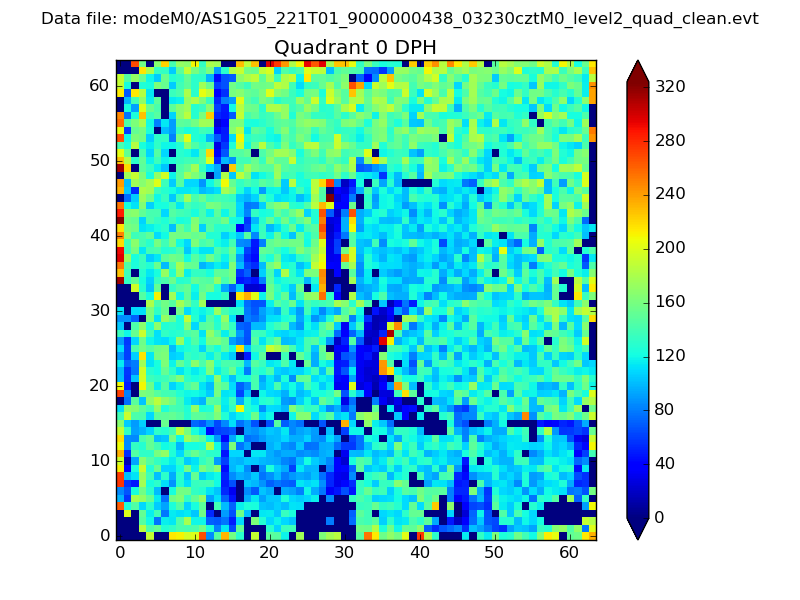 |
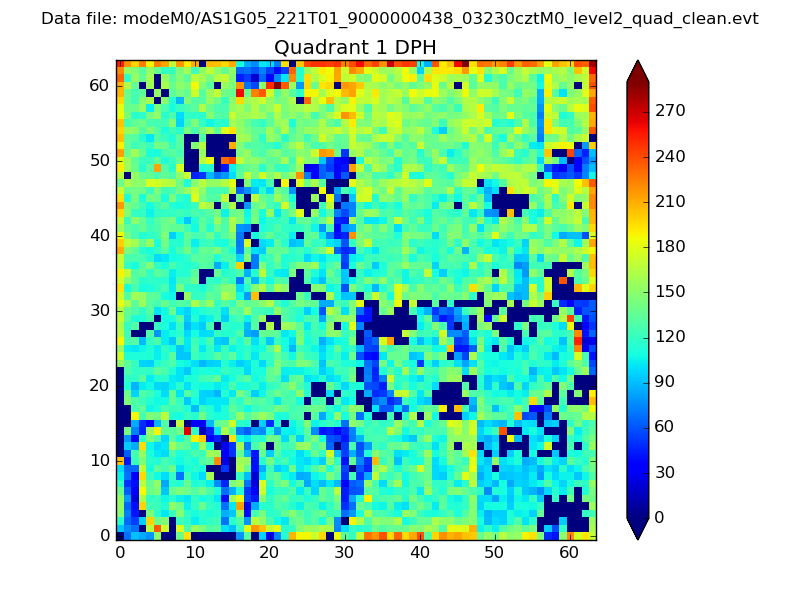 |
Quadrant B |
|---|---|---|---|
| Quadrant D | 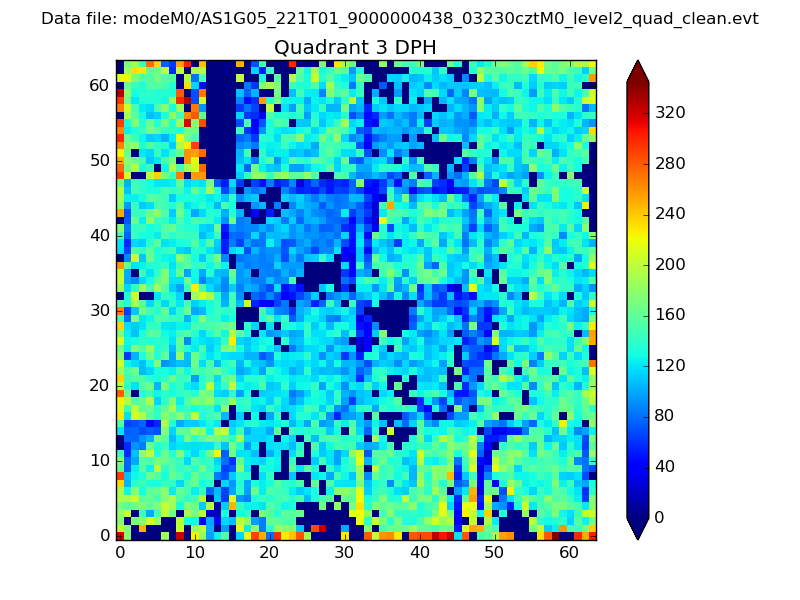 |
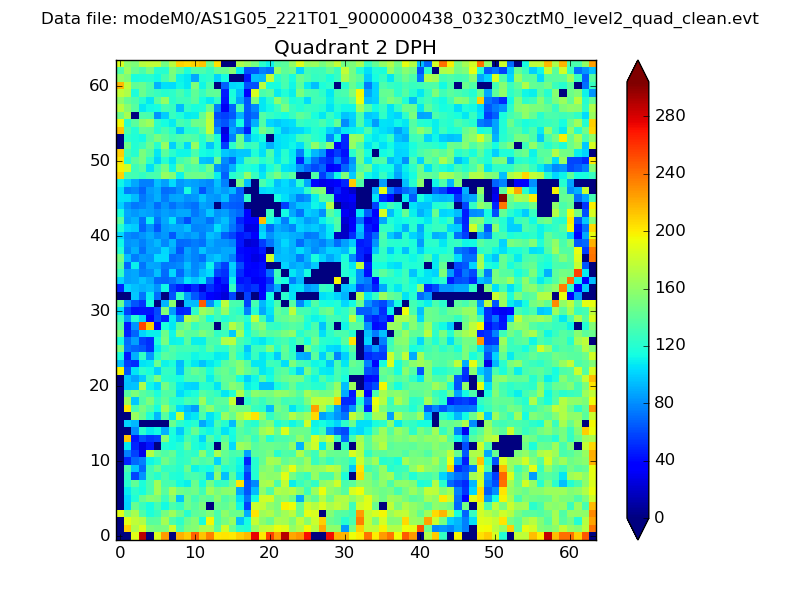 |
Quadrant C |
| Plot type | Count rate plots | Images |
|---|---|---|
| Comparison with Poisson distribution Blue bars denote a histogram of data divided into 1 sec bins. Red curve is a Poisson curve with rate = median count rate of data. |
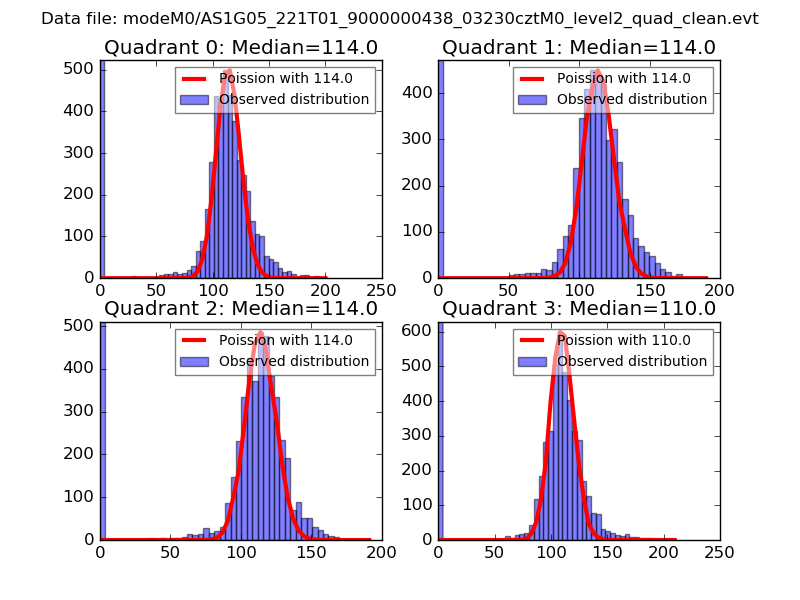 |
 |
| Quadrant-wise count rates Data is divided into 100 sec bins |
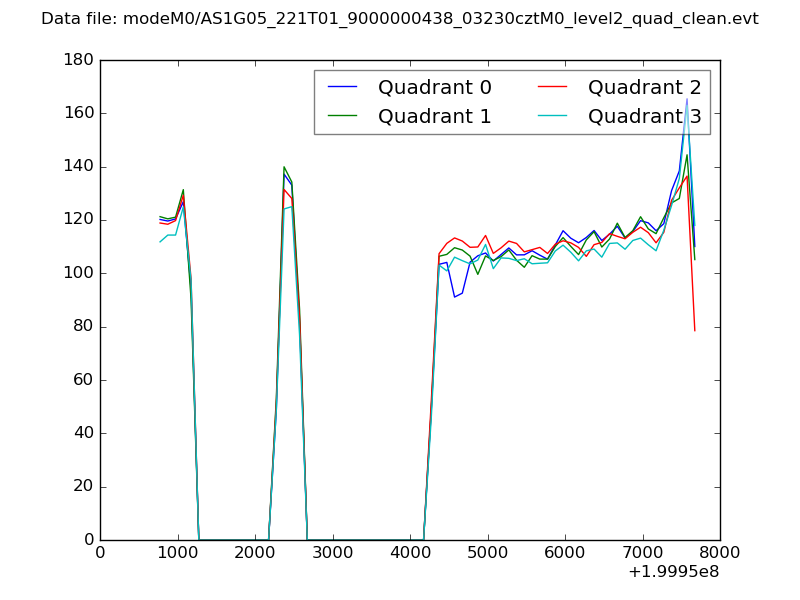 |
|
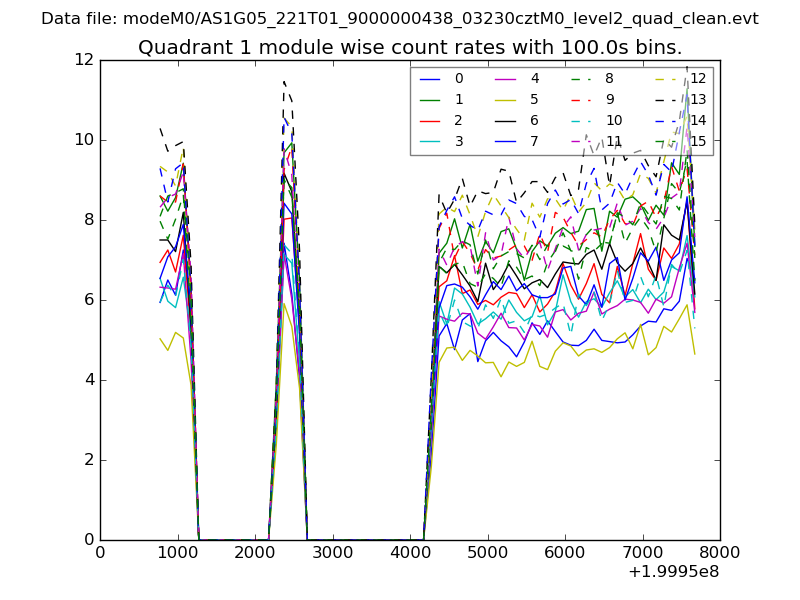
| Module-wise count rates for Quadrant A Data is divided into 100 sec bins |
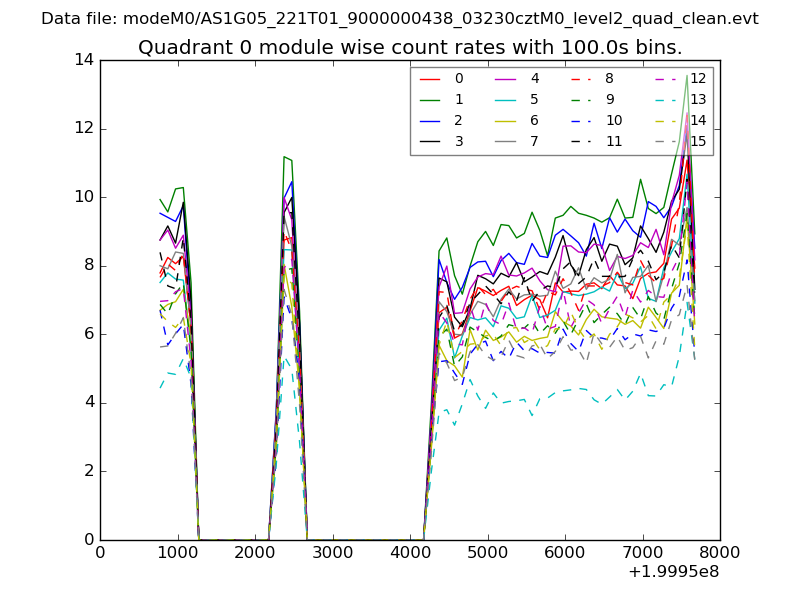 |
 |
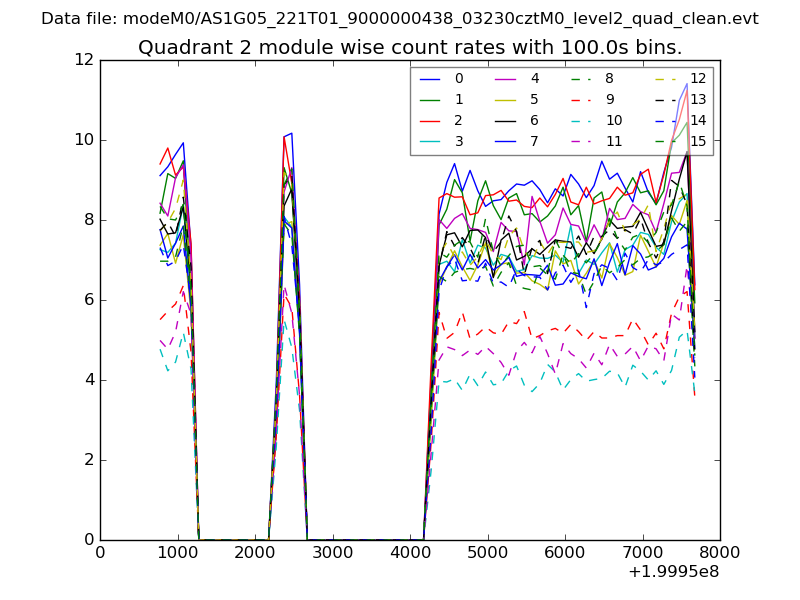
| Module-wise count rates for Quadrant B Data is divided into 100 sec bins |
 |
 |
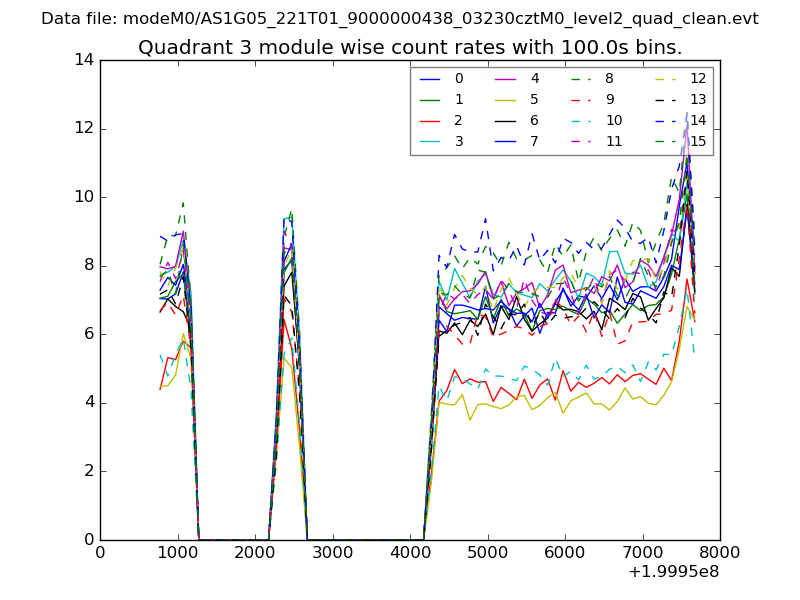
| Module-wise count rates for Quadrant C Data is divided into 100 sec bins |
 |
 |
| Module-wise count rates for Quadrant D Data is divided into 100 sec bins |
 |
 |
| Parameter | Plot |
|---|---|
| CZT HV Monitor | 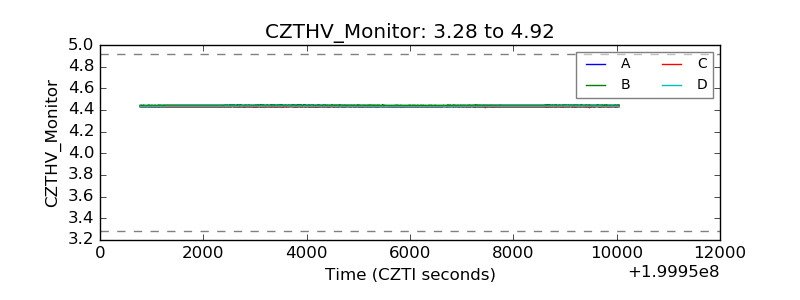 |
| D_VDD | 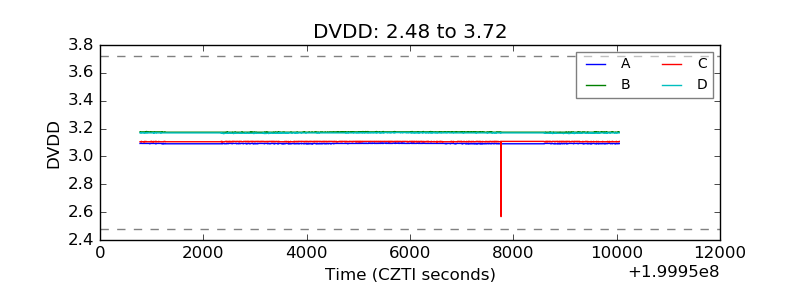 |
| Temperature 1 | 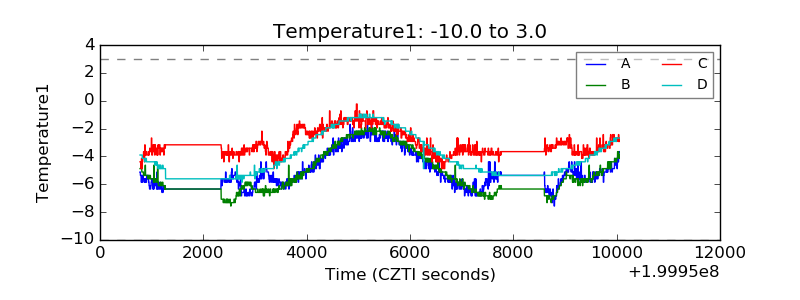 |
| Veto HV Monitor | 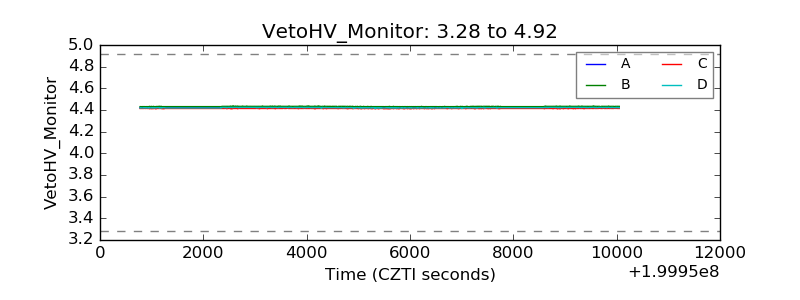 |
| Veto LLD | 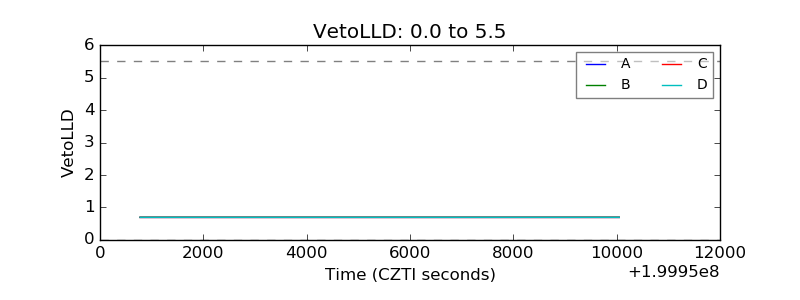 |
| Alpha Counter | 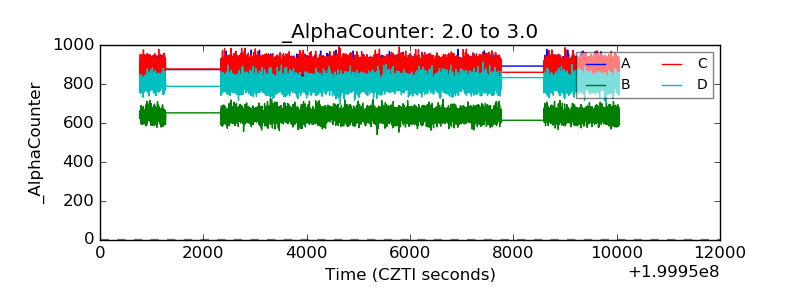 |
| _CPM_Rate | 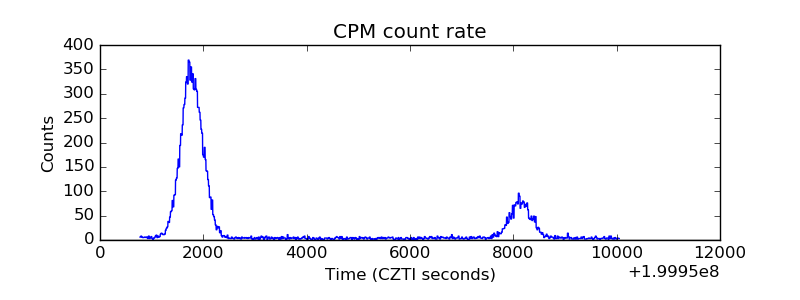 |
| CZT Counter | 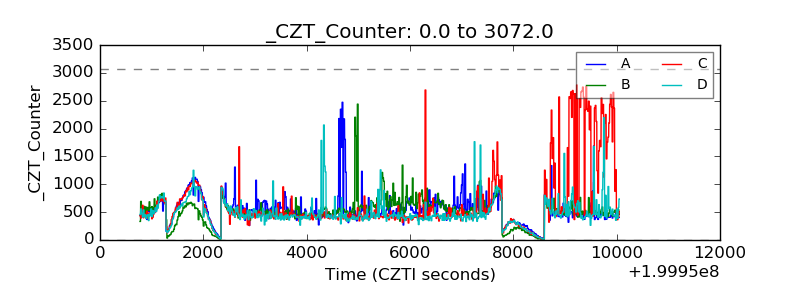 |
| +2.5 Volts monitor |  |
| +5 Volts monitor |  |
| _ROLL_ROT | 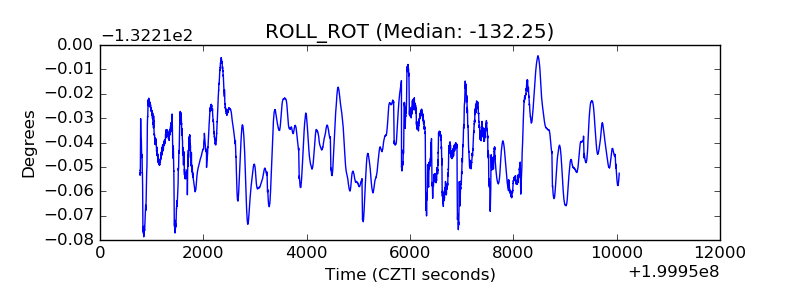 |
| _Roll_DEC | 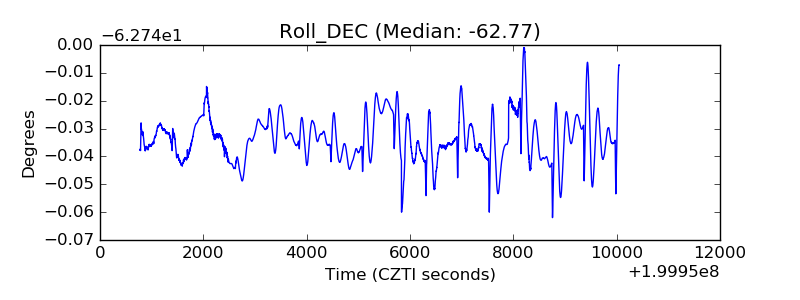 |
| _Roll_RA | 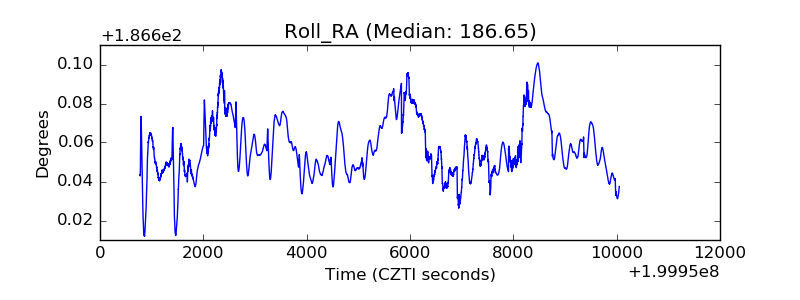 |
| Veto Counter | 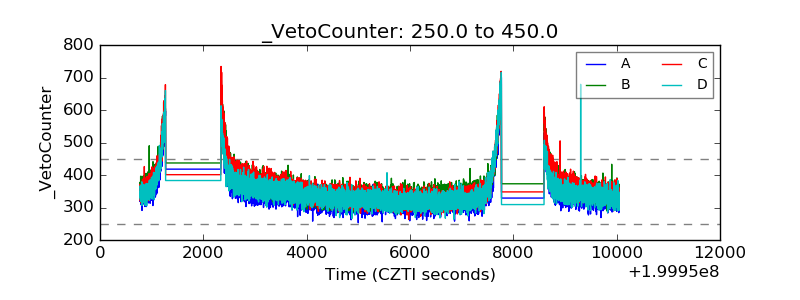 |