| Param | Original file | Final file |
|---|---|---|
| Filename | modeM0/AS1G05_233T10_9000000438_03199cztM0_level2.evt | modeM0/AS1G05_233T10_9000000438_03199cztM0_level2_quad_clean.evt |
| Size (bytes) | 782,173,440 | 65,401,920 |
| Size | 745.9 MB | 62.4 MB |
| Events in quadrant A | 2,983,958 | 430,878 |
| Events in quadrant B | 3,127,825 | 440,005 |
| Events in quadrant C | 14,079,395 | 254,399 |
| Events in quadrant D | 3,068,596 | 411,714 |
| Mode M9 | |||
|---|---|---|---|
| Quadrant | BADHDUFLAG | Total packets | Discarded packets |
| A | 0 | 19 | 0 |
| B | 0 | 19 | 0 |
| C | 0 | 19 | 0 |
| D | 0 | 20 | 0 |
| Mode M0 | |||
|---|---|---|---|
| Quadrant | BADHDUFLAG | Total packets | Discarded packets |
| A | 0 | 13198 | 3 |
| B | 0 | 13291 | 2 |
| C | 0 | 46215 | 2 |
| D | 0 | 13670 | 2 |
| Mode SS | |||
|---|---|---|---|
| Quadrant | BADHDUFLAG | Total packets | Discarded packets |
| A | 0 | 128 | 0 |
| B | 0 | 128 | 0 |
| C | 0 | 128 | 0 |
| D | 0 | 128 | 0 |
| Quadrant | Total seconds | Saturated seconds | Saturation percentage |
|---|---|---|---|
| A | 6332 | 83 | 1.310802% |
| B | 6332 | 54 | 0.852811% |
| C | 6332 | 4588 | 72.457359% |
| D | 6332 | 60 | 0.947568% |
Noise dominated data is calculated using 1-second bins in cleaned event files. If a bin has >2000 counts, and if more than 50% of those come from <1% of pixels, then it is considered to be noise-dominated and hence unusable.
| Quadrant | # 1 sec bins | Bins with >0 counts | Bins with >2000 counts | High rate bins dominated by noise | Noise dominated (total time) | Noise dominated (detector-on time) | Marked lightcurve |
|---|---|---|---|---|---|---|---|
| A | 7622 | 6332 | 23 | 23 | 0.30% | 0.36% | 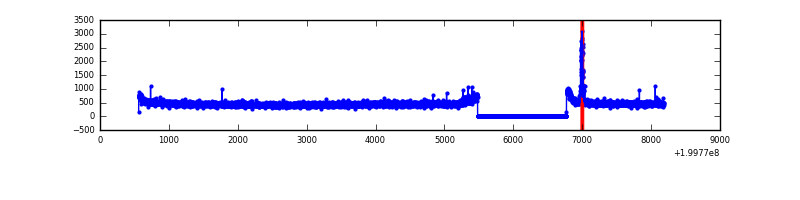 |
| B | 7622 | 6333 | 0 | 0 | 0.00% | 0.00% | 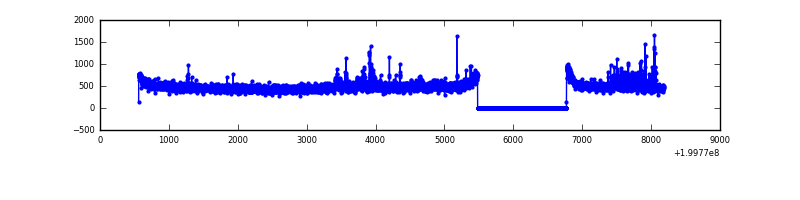 |
| C | 7621 | 6331 | 4575 | 4575 | 60.03% | 72.26% | 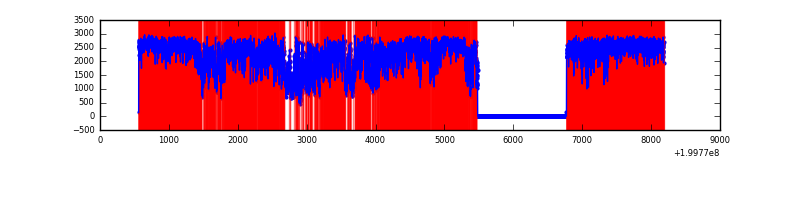 |
| D | 7622 | 6332 | 33 | 33 | 0.43% | 0.52% | 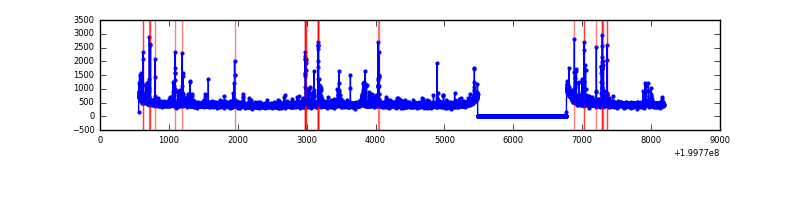 |
Top three noisy pixels from each quadrant. If the there are fewer than three noisy pixels in the level2.evt file, extra rows are filled as -1
| Pixel properties | Quadrant properties | ||||||
|---|---|---|---|---|---|---|---|
| Quadrant | DetID | PixID | Counts | Sigma | Mean | Median | Sigma |
| A | 0 | 118 | 70884 | 467.88 | 746 | 731 | 149.9 |
| A | 8 | 15 | 19641 | 126.12 | 746 | 731 | 149.9 |
| A | 0 | 226 | 14576 | 92.34 | 746 | 731 | 149.9 |
| B | 15 | 204 | 44237 | 300.36 | 767 | 750 | 144.8 |
| B | 3 | 0 | 41403 | 280.78 | 767 | 750 | 144.8 |
| B | 4 | 81 | 37889 | 256.51 | 767 | 750 | 144.8 |
| C | 12 | 206 | 12017175 | 103422.79 | 507 | 509 | 116.2 |
| C | 8 | 208 | 49261 | 419.59 | 507 | 509 | 116.2 |
| C | 6 | 80 | 18149 | 151.82 | 507 | 509 | 116.2 |
| D | 13 | 223 | 115852 | 608.0 | 714 | 697 | 189.4 |
| D | 5 | 233 | 59423 | 310.06 | 714 | 697 | 189.4 |
| D | 13 | 239 | 40899 | 212.26 | 714 | 697 | 189.4 |
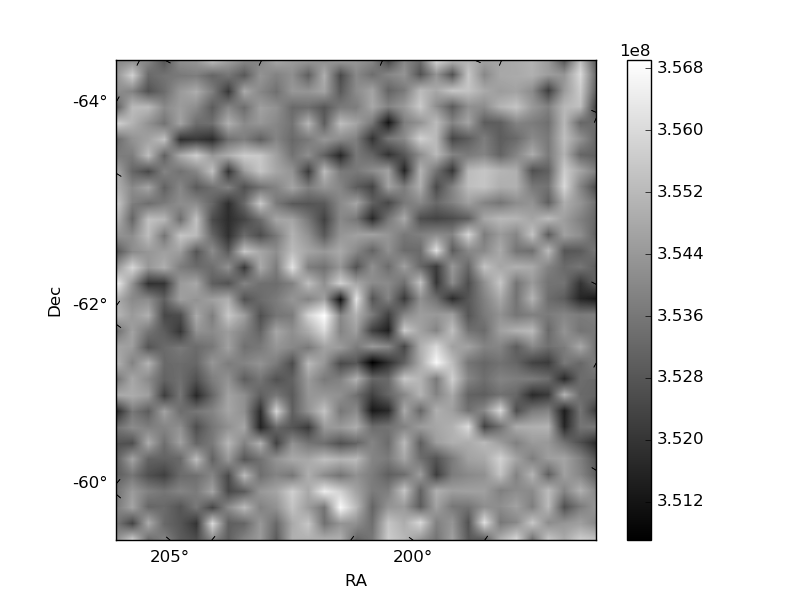
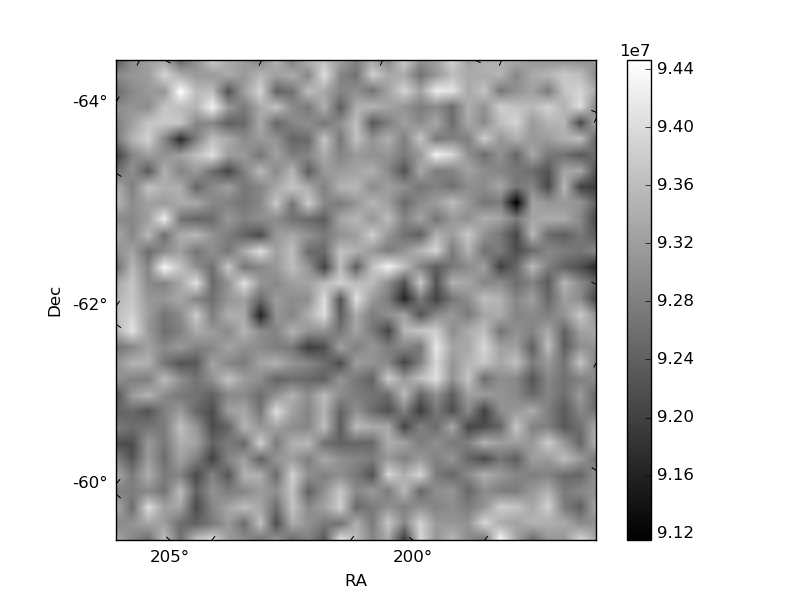
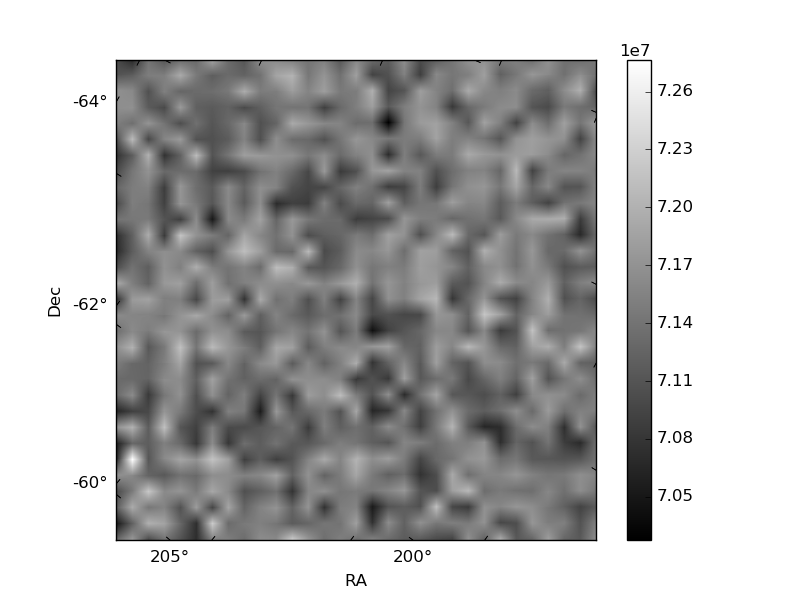
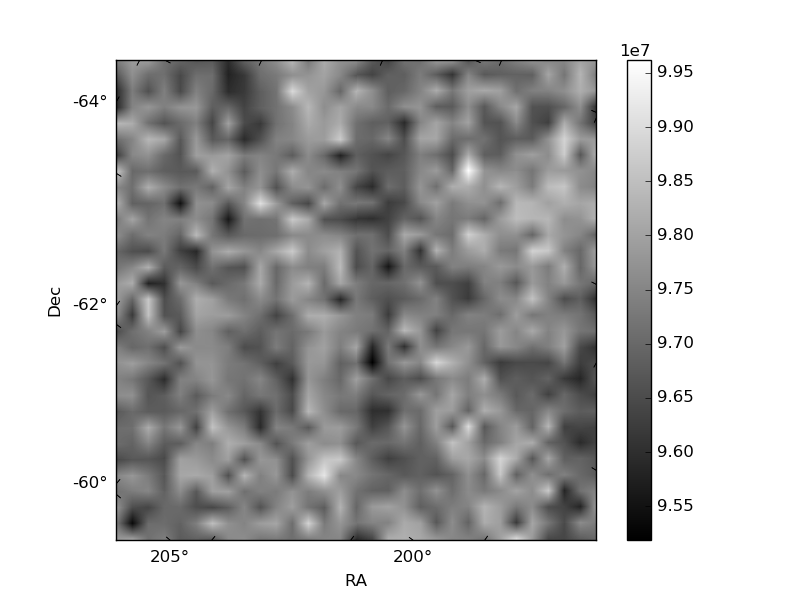
Histogram calculated using DETX and DETY for each event in the final _common_clean file
| Quadrant A | 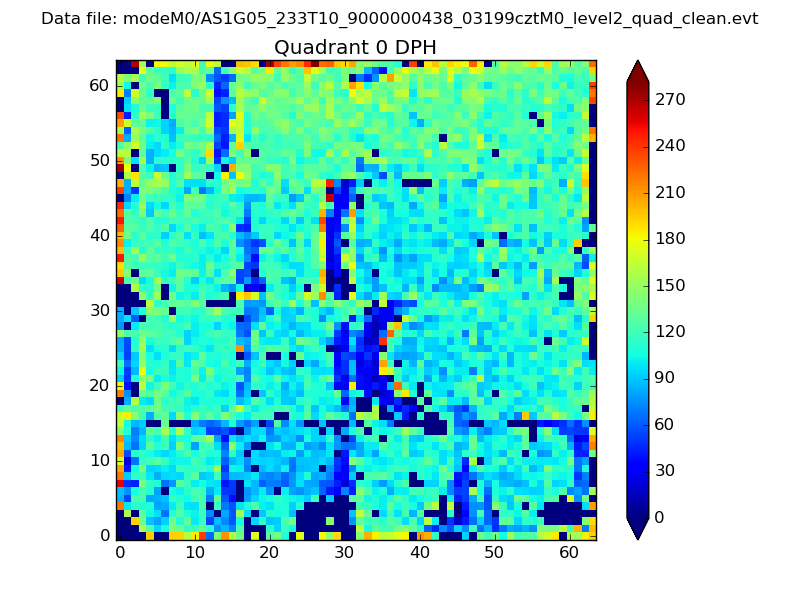 |
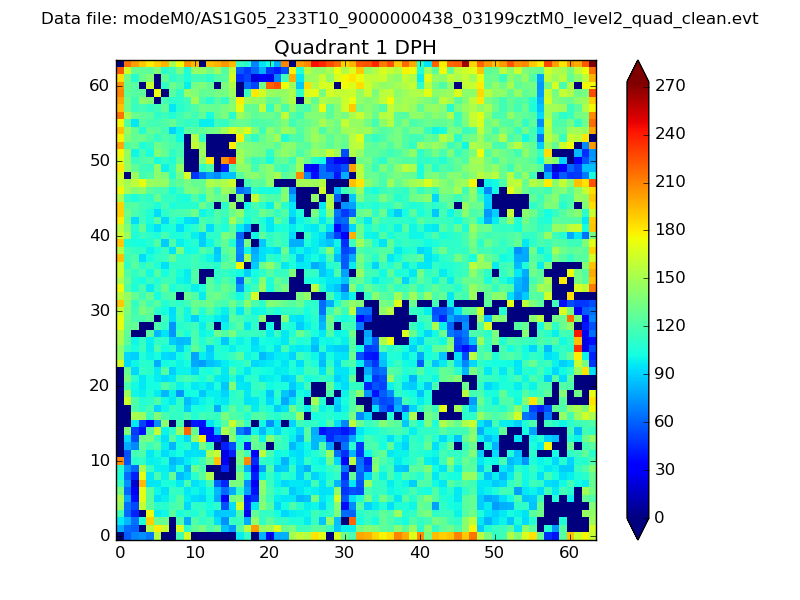 |
Quadrant B |
|---|---|---|---|
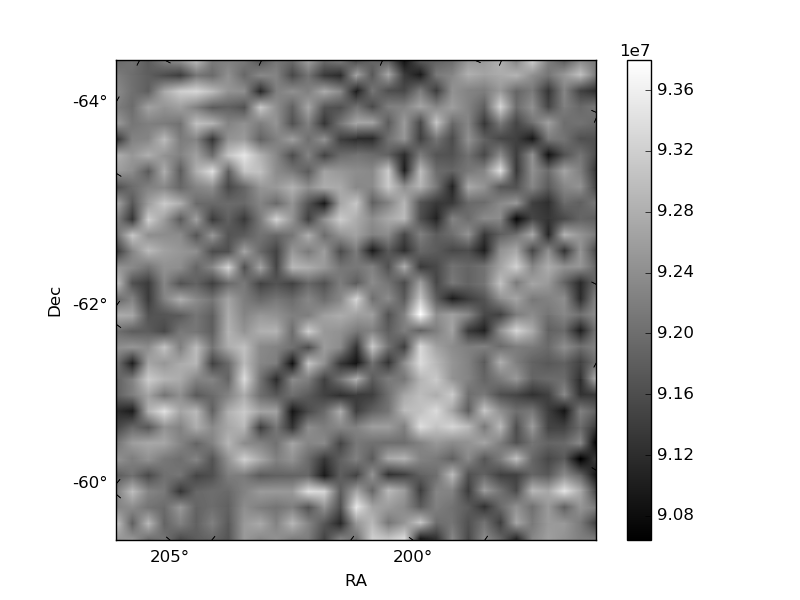
| Quadrant D | 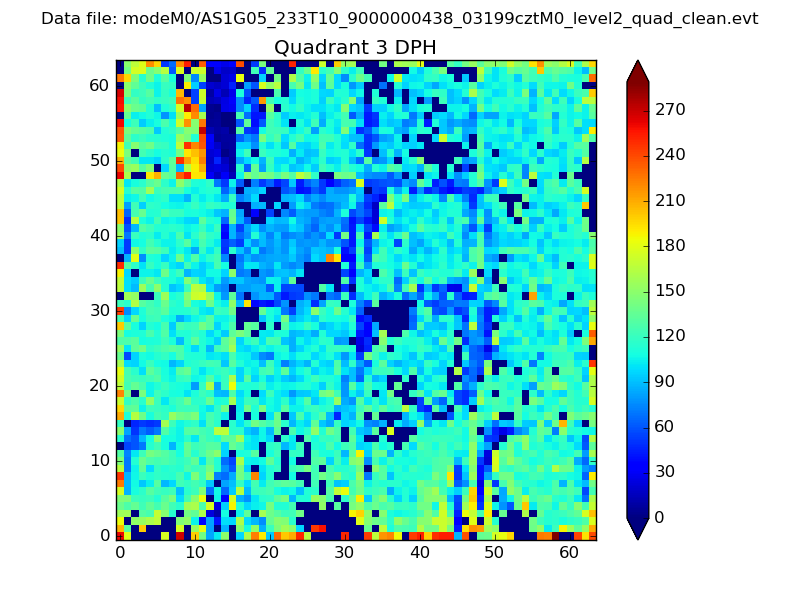 |
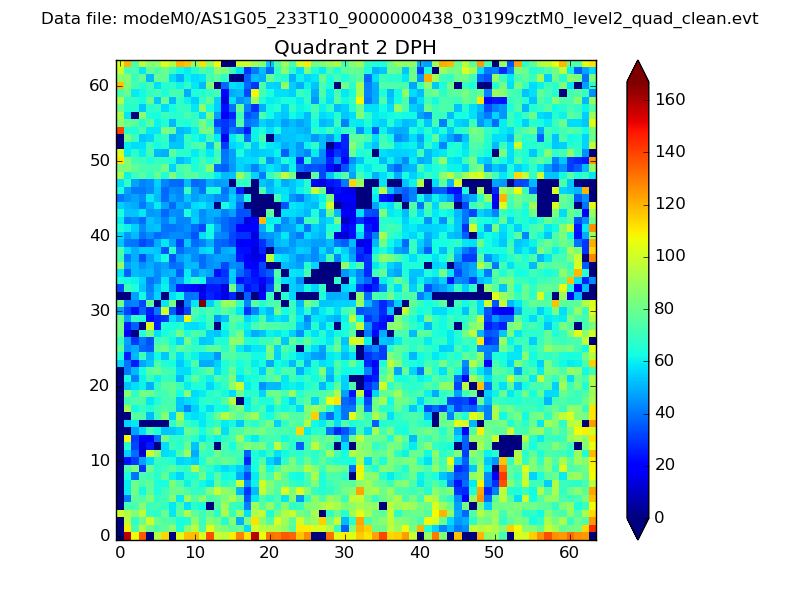 |
Quadrant C |
| Plot type | Count rate plots | Images |
|---|---|---|
| Comparison with Poisson distribution Blue bars denote a histogram of data divided into 1 sec bins. Red curve is a Poisson curve with rate = median count rate of data. |
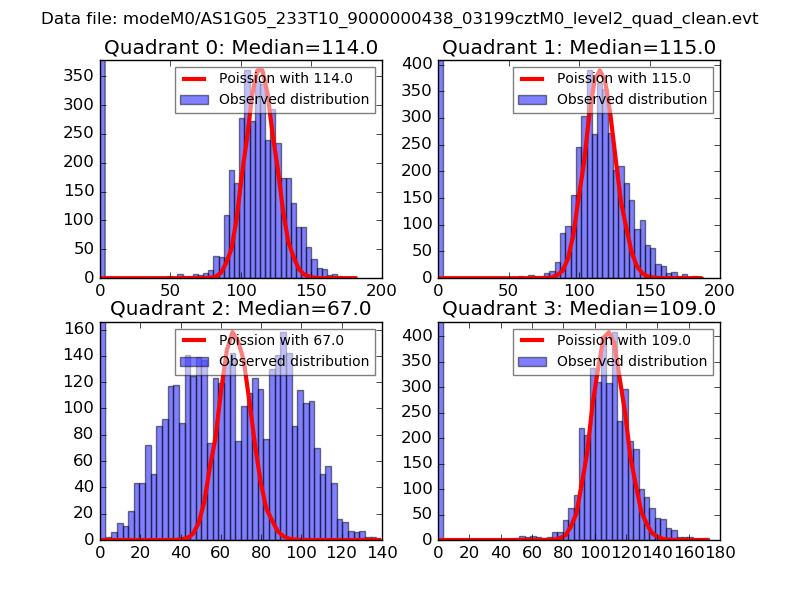 |
 |
| Quadrant-wise count rates Data is divided into 100 sec bins |
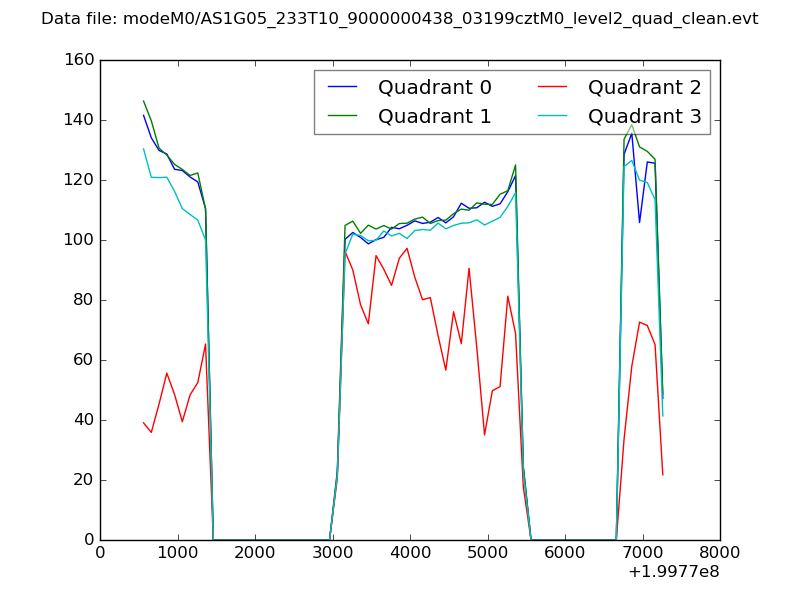 |
|
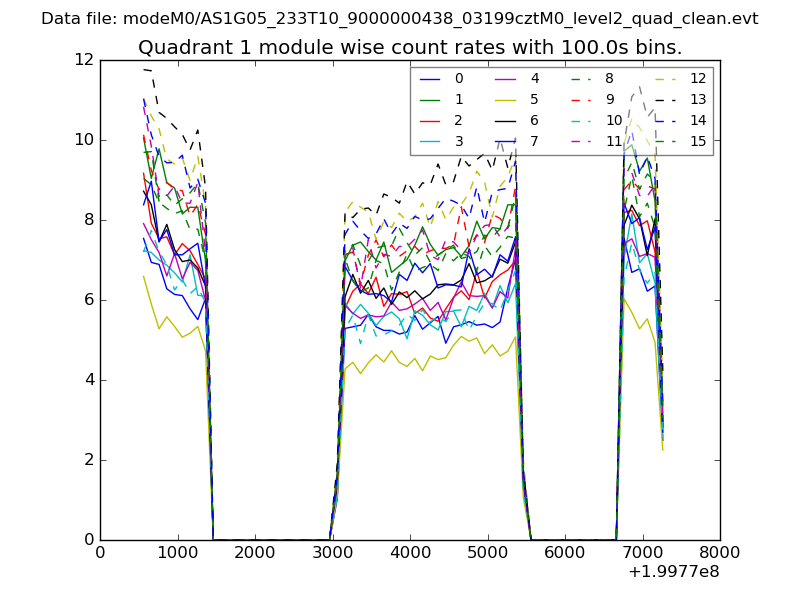
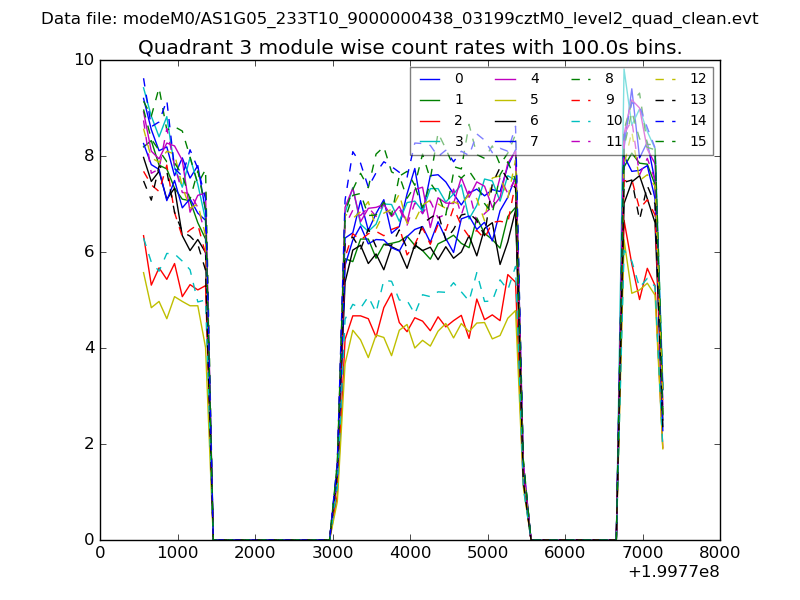
| Module-wise count rates for Quadrant A Data is divided into 100 sec bins |
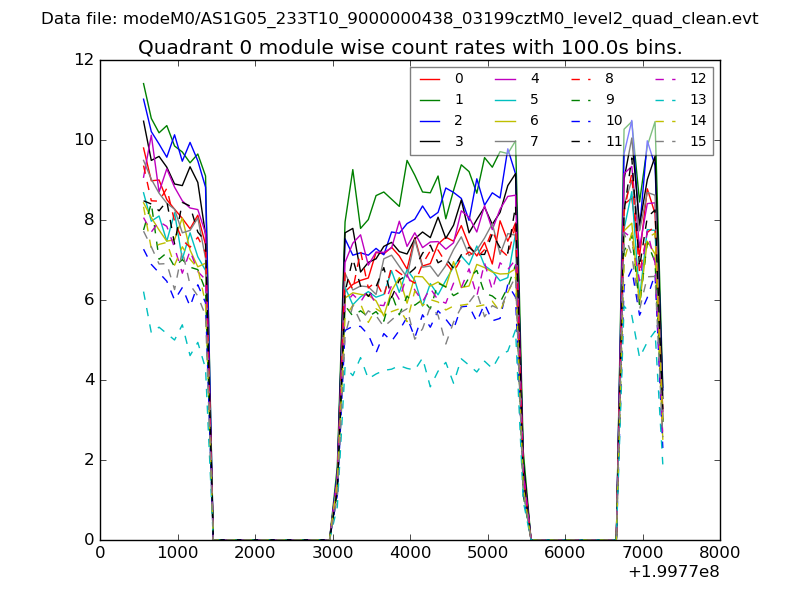 |
 |
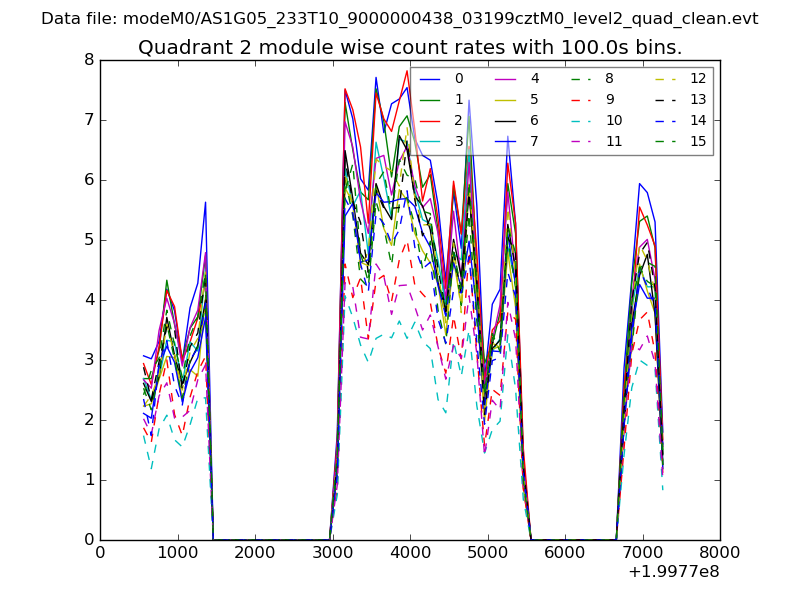
| Module-wise count rates for Quadrant B Data is divided into 100 sec bins |
 |
 |
| Module-wise count rates for Quadrant C Data is divided into 100 sec bins |
 |
 |
| Module-wise count rates for Quadrant D Data is divided into 100 sec bins |
 |
 |
| Parameter | Plot |
|---|---|
| CZT HV Monitor | 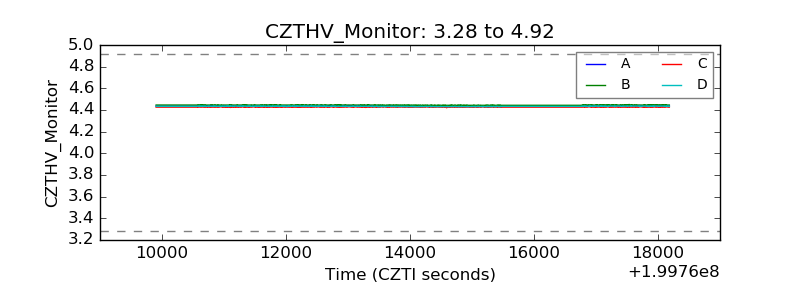 |
| D_VDD | 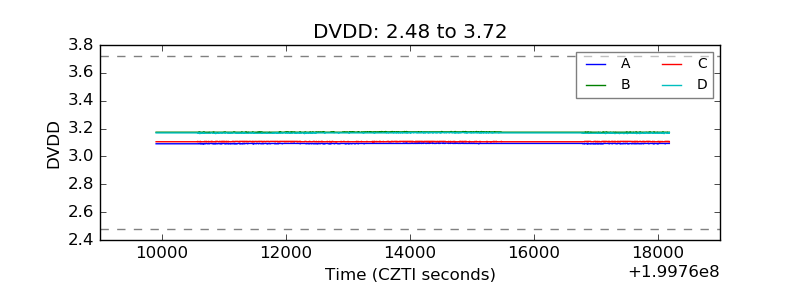 |
| Temperature 1 | 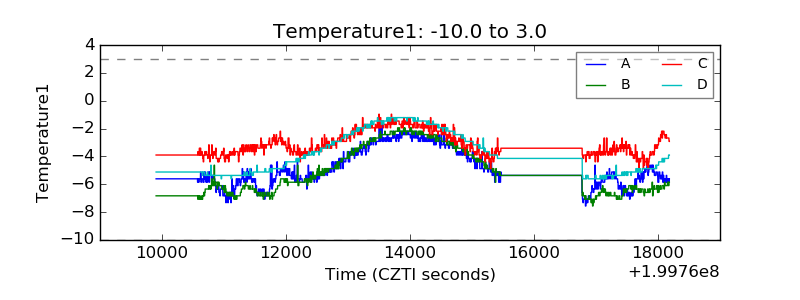 |
| Veto HV Monitor | 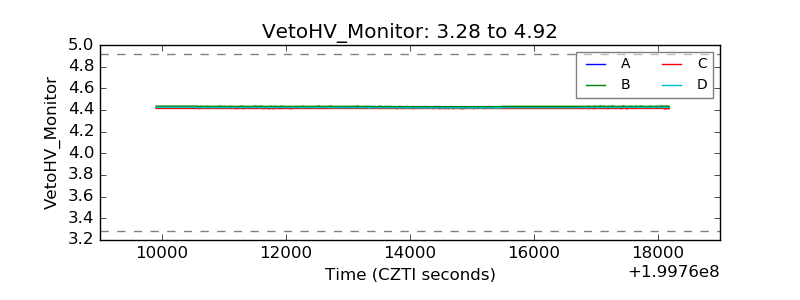 |
| Veto LLD | 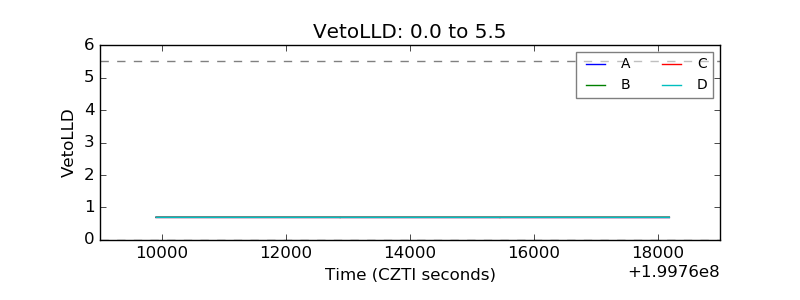 |
| Alpha Counter | 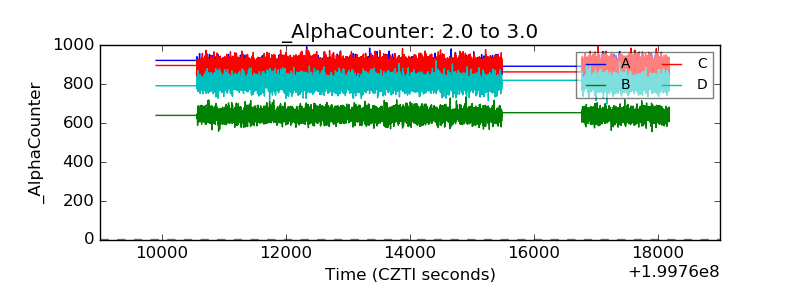 |
| _CPM_Rate | 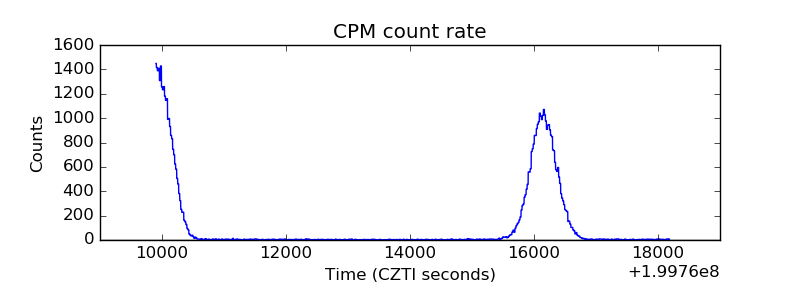 |
| CZT Counter | 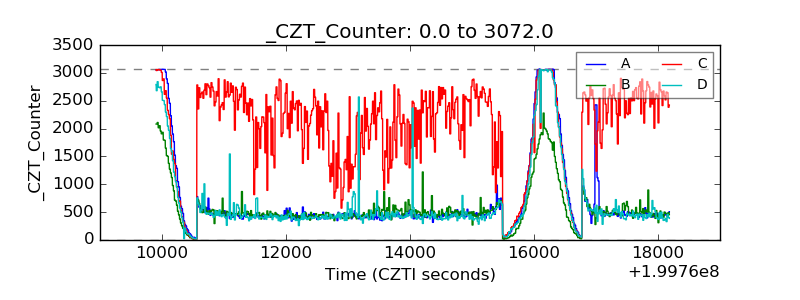 |
| +2.5 Volts monitor | 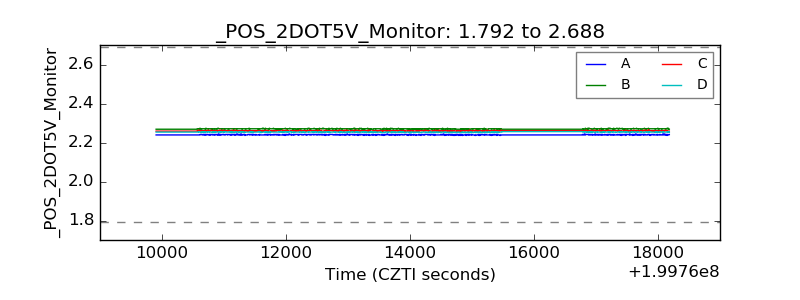 |
| +5 Volts monitor | 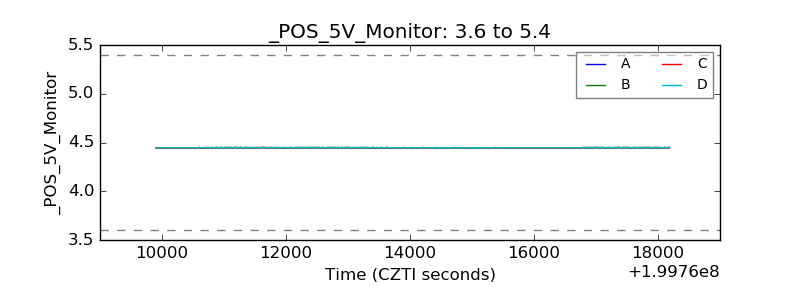 |
| Veto Counter | 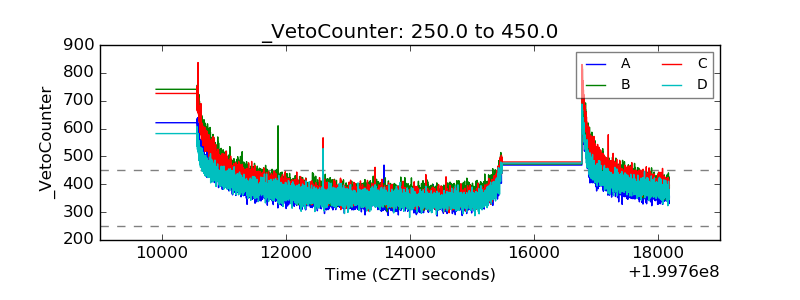 |