| Param | Original file | Final file |
|---|---|---|
| Filename | modeM0/AS1G05_233T10_9000000438_03200cztM0_level2.evt | modeM0/AS1G05_233T10_9000000438_03200cztM0_level2_quad_clean.evt |
| Size (bytes) | 883,388,160 | 60,223,680 |
| Size | 842.5 MB | 57.4 MB |
| Events in quadrant A | 3,089,296 | 395,623 |
| Events in quadrant B | 3,269,207 | 403,155 |
| Events in quadrant C | 16,171,802 | 189,124 |
| Events in quadrant D | 3,781,094 | 377,771 |
| Mode M9 | |||
|---|---|---|---|
| Quadrant | BADHDUFLAG | Total packets | Discarded packets |
| A | 0 | 12 | 0 |
| B | 0 | 12 | 0 |
| C | 0 | 12 | 0 |
| D | 0 | 12 | 0 |
| Mode M0 | |||
|---|---|---|---|
| Quadrant | BADHDUFLAG | Total packets | Discarded packets |
| A | 0 | 13681 | 3 |
| B | 0 | 13826 | 2 |
| C | 0 | 52353 | 2 |
| D | 0 | 15874 | 5 |
| Mode SS | |||
|---|---|---|---|
| Quadrant | BADHDUFLAG | Total packets | Discarded packets |
| A | 0 | 132 | 0 |
| B | 0 | 132 | 0 |
| C | 0 | 132 | 0 |
| D | 0 | 132 | 0 |
| Quadrant | Total seconds | Saturated seconds | Saturation percentage |
|---|---|---|---|
| A | 6537 | 176 | 2.692367% |
| B | 6537 | 156 | 2.386416% |
| C | 6537 | 5867 | 89.750650% |
| D | 6536 | 295 | 4.513464% |
Noise dominated data is calculated using 1-second bins in cleaned event files. If a bin has >2000 counts, and if more than 50% of those come from <1% of pixels, then it is considered to be noise-dominated and hence unusable.
| Quadrant | # 1 sec bins | Bins with >0 counts | Bins with >2000 counts | High rate bins dominated by noise | Noise dominated (total time) | Noise dominated (detector-on time) | Marked lightcurve |
|---|---|---|---|---|---|---|---|
| A | 7673 | 6537 | 23 | 23 | 0.30% | 0.35% | 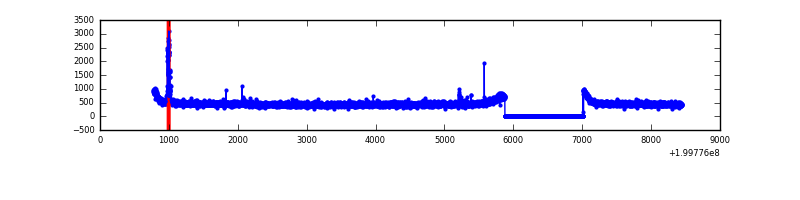 |
| B | 7673 | 6537 | 1 | 1 | 0.01% | 0.02% | 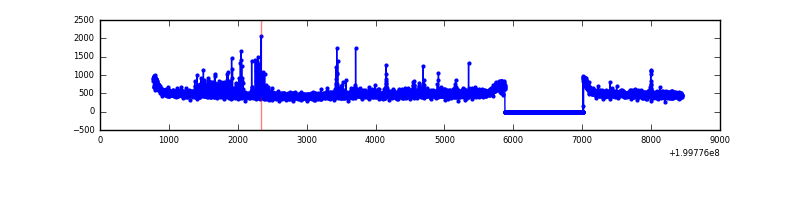 |
| C | 7672 | 6536 | 5724 | 5724 | 74.61% | 87.58% | 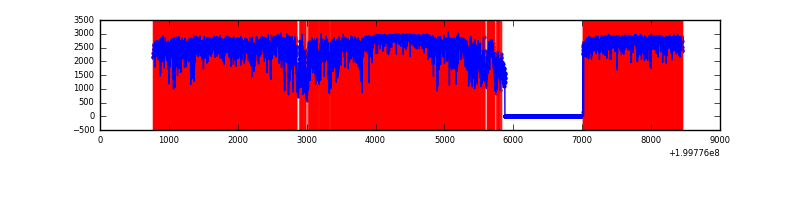 |
| D | 7672 | 6536 | 157 | 157 | 2.05% | 2.40% | 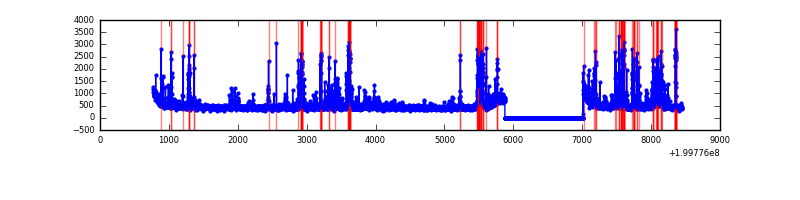 |
Top three noisy pixels from each quadrant. If the there are fewer than three noisy pixels in the level2.evt file, extra rows are filled as -1
| Pixel properties | Quadrant properties | ||||||
|---|---|---|---|---|---|---|---|
| Quadrant | DetID | PixID | Counts | Sigma | Mean | Median | Sigma |
| A | 0 | 118 | 76006 | 481.07 | 774 | 757 | 156.4 |
| A | 0 | 226 | 15133 | 91.9 | 774 | 757 | 156.4 |
| A | 13 | 14 | 8713 | 50.86 | 774 | 757 | 156.4 |
| B | 15 | 204 | 70239 | 465.19 | 792 | 774 | 149.3 |
| B | 3 | 0 | 64573 | 427.25 | 792 | 774 | 149.3 |
| B | 15 | 54 | 16896 | 107.96 | 792 | 774 | 149.3 |
| C | 12 | 206 | 14560333 | 163775.48 | 390 | 391 | 88.9 |
| C | 1 | 192 | 44118 | 491.86 | 390 | 391 | 88.9 |
| C | 6 | 80 | 19622 | 216.32 | 390 | 391 | 88.9 |
| D | 13 | 223 | 555417 | 3109.71 | 744 | 721 | 178.4 |
| D | 12 | 217 | 87831 | 488.35 | 744 | 721 | 178.4 |
| D | 5 | 233 | 71166 | 394.93 | 744 | 721 | 178.4 |
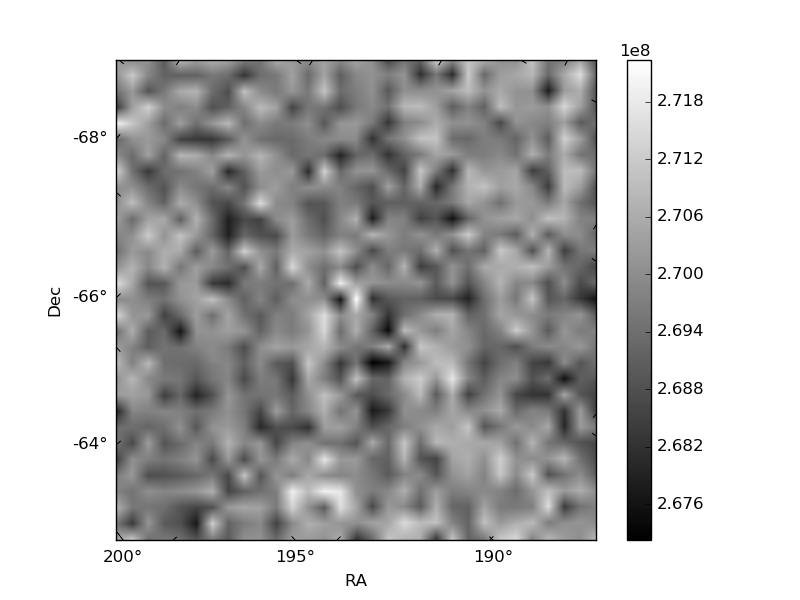
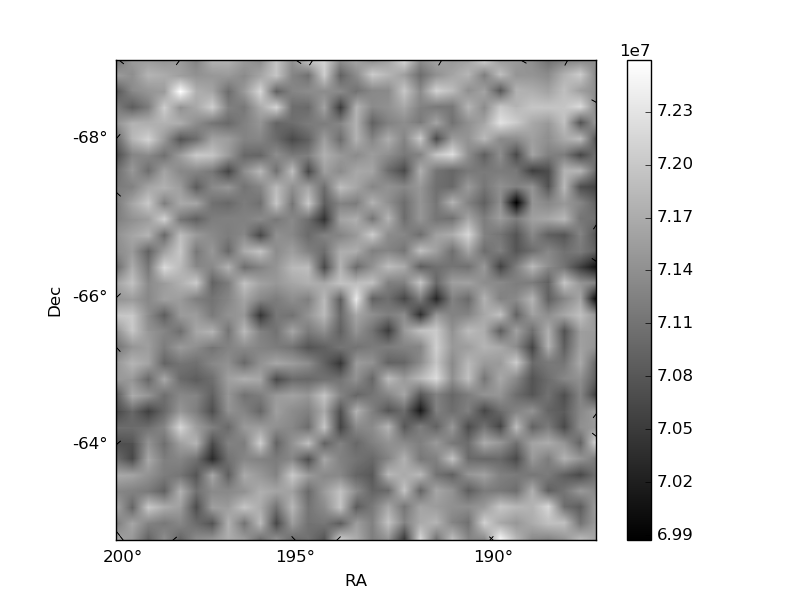
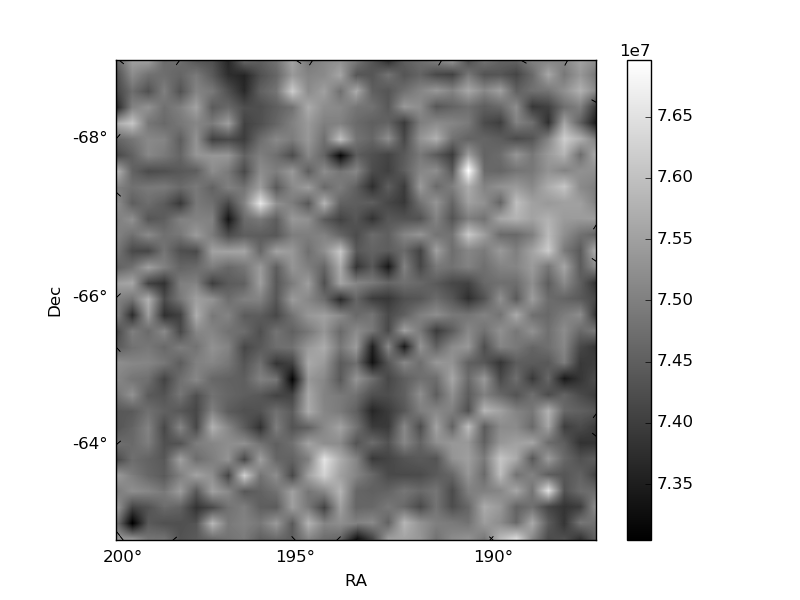
Histogram calculated using DETX and DETY for each event in the final _common_clean file
| Quadrant A | 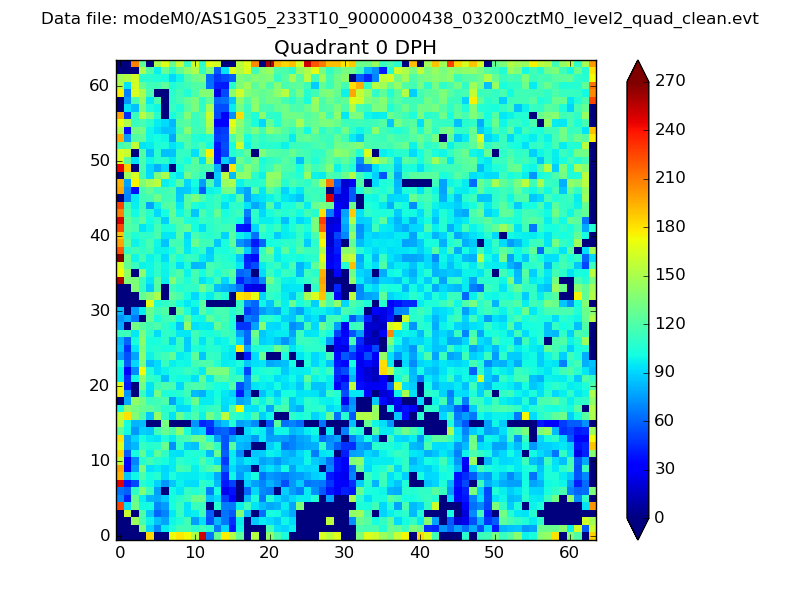 |
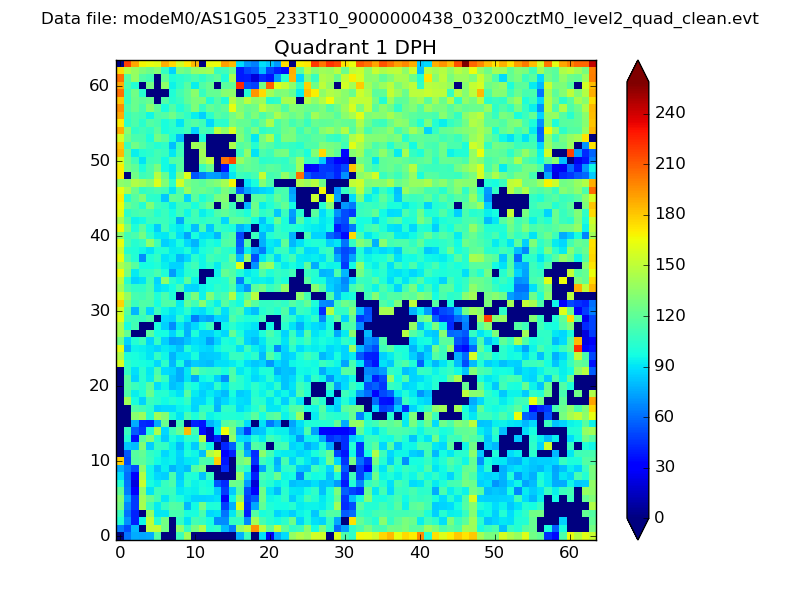 |
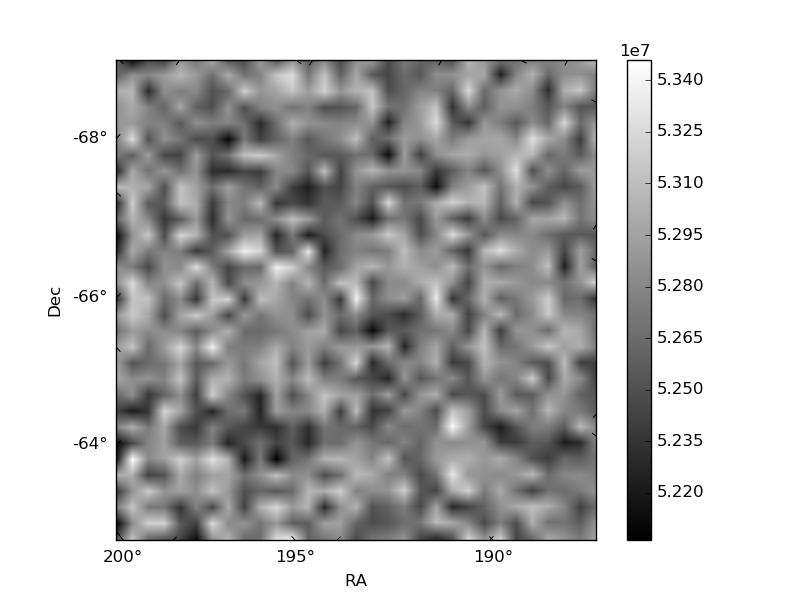
Quadrant B |
|---|---|---|---|
| Quadrant D | 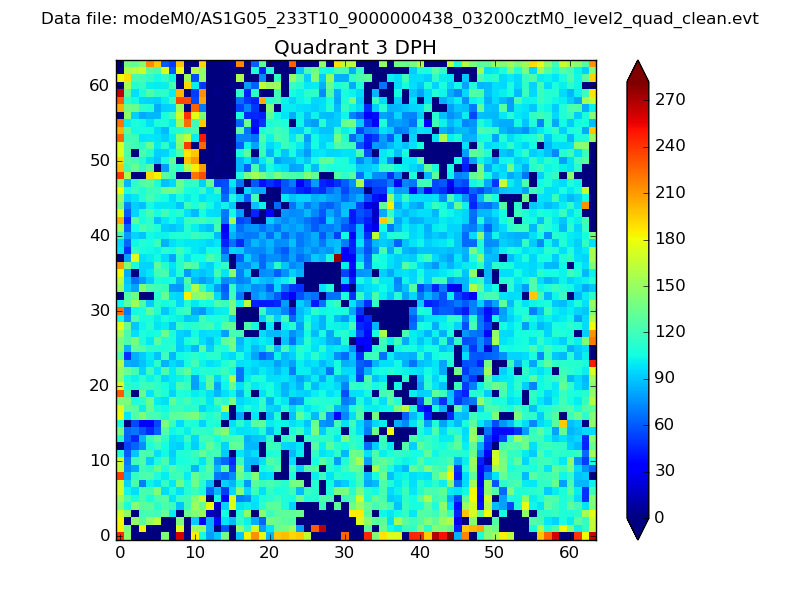 |
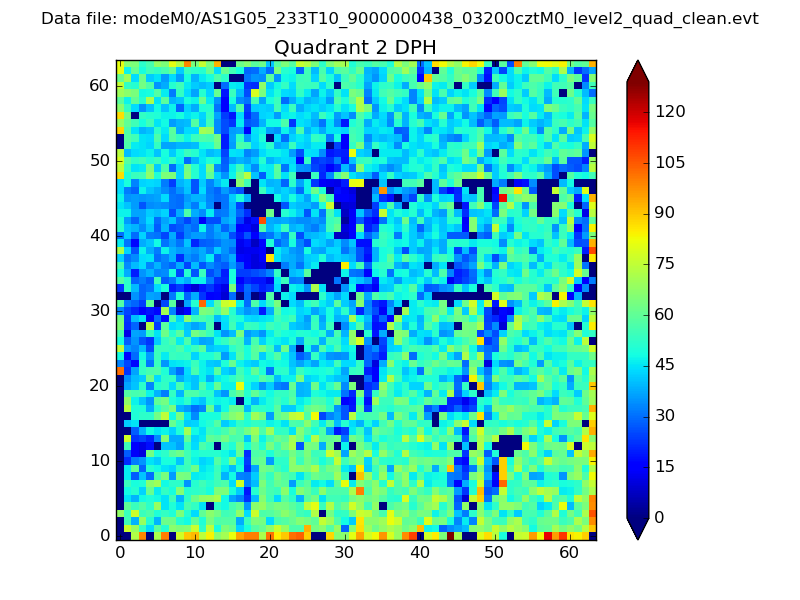 |
Quadrant C |
| Plot type | Count rate plots | Images |
|---|---|---|
| Comparison with Poisson distribution Blue bars denote a histogram of data divided into 1 sec bins. Red curve is a Poisson curve with rate = median count rate of data. |
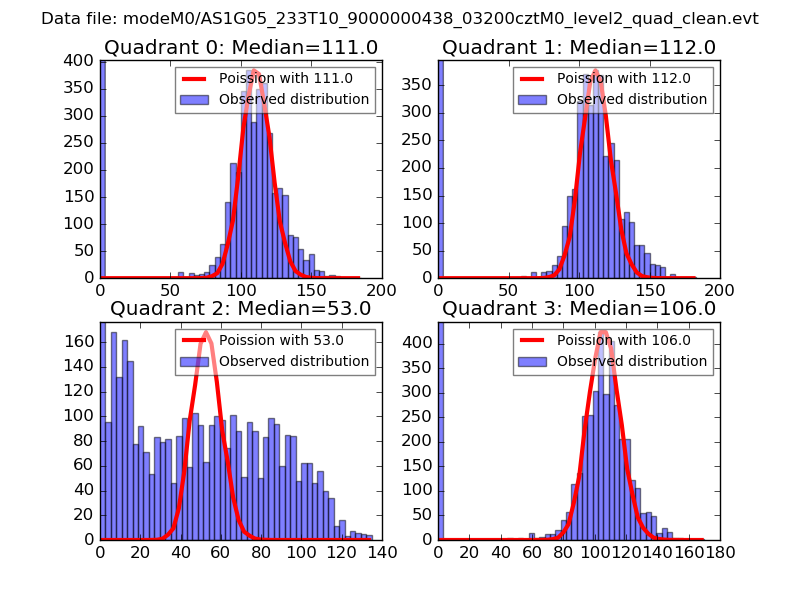 |
 |
| Quadrant-wise count rates Data is divided into 100 sec bins |
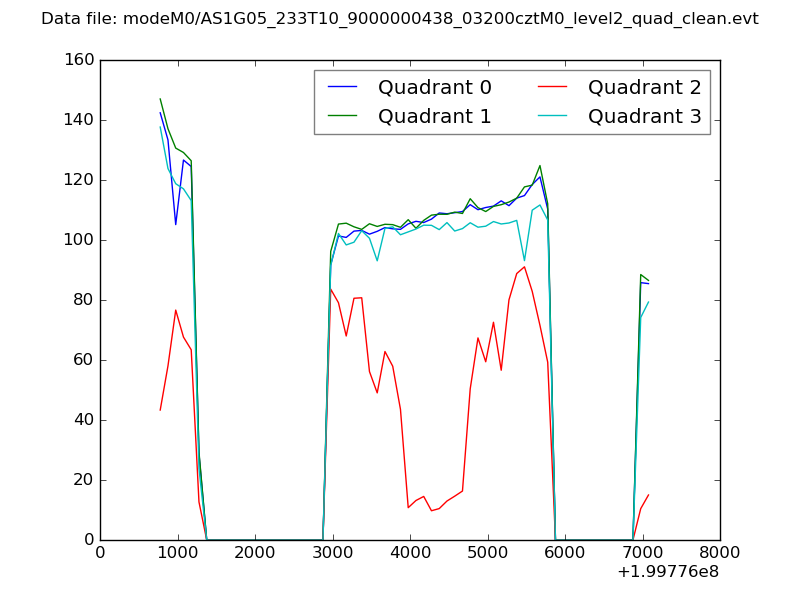 |
|
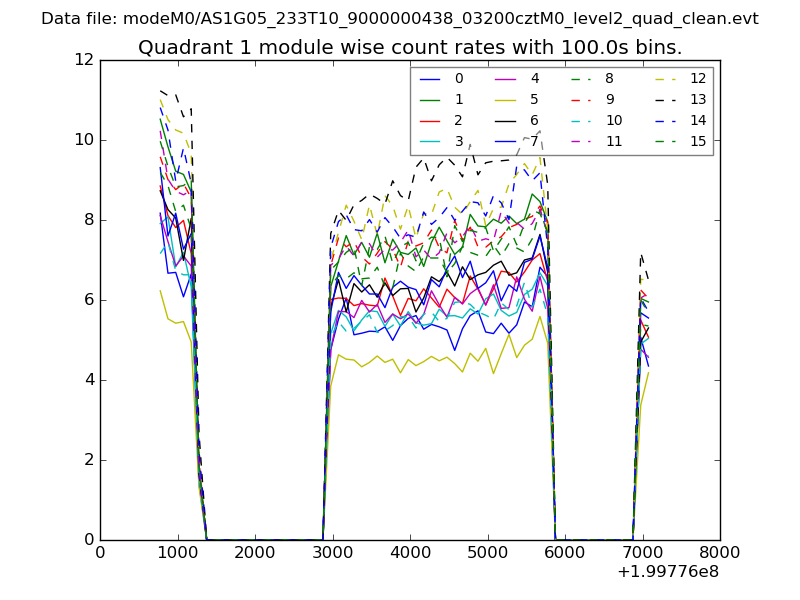
| Module-wise count rates for Quadrant A Data is divided into 100 sec bins |
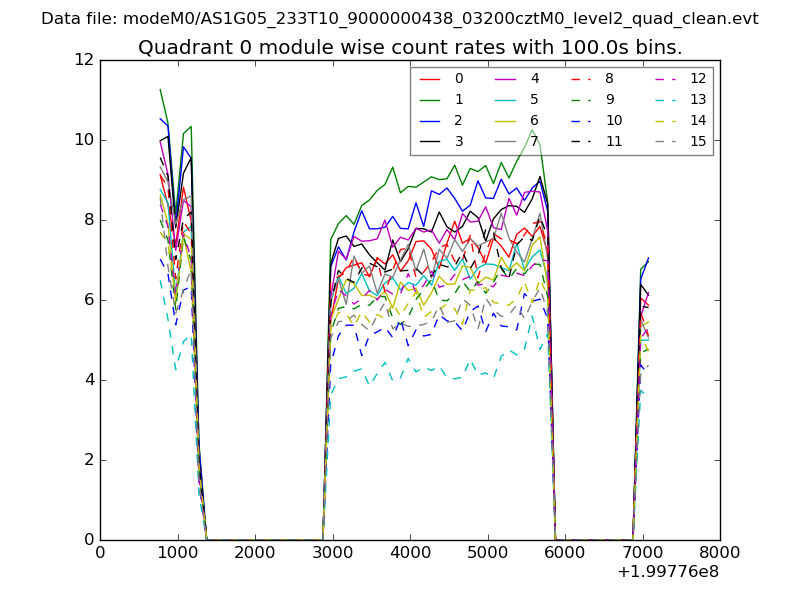 |
 |
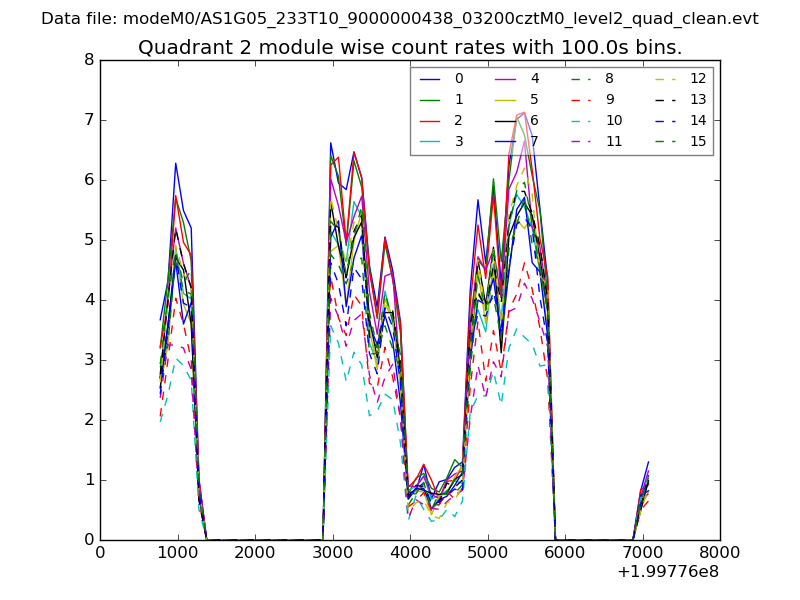
| Module-wise count rates for Quadrant B Data is divided into 100 sec bins |
 |
 |
| Module-wise count rates for Quadrant C Data is divided into 100 sec bins |
 |
 |
| Module-wise count rates for Quadrant D Data is divided into 100 sec bins |
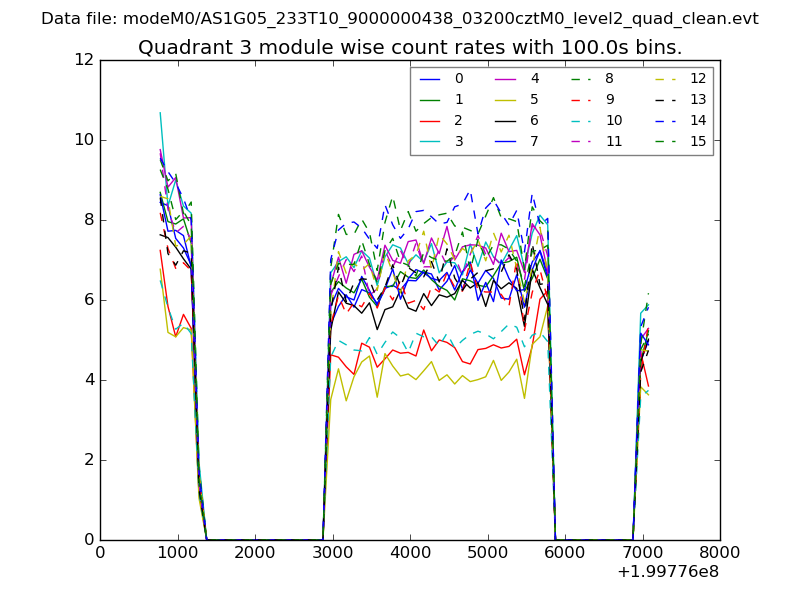 |
 |
| Parameter | Plot |
|---|---|
| CZT HV Monitor | 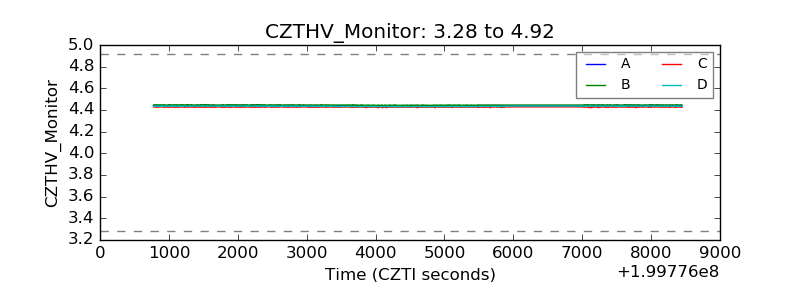 |
| D_VDD | 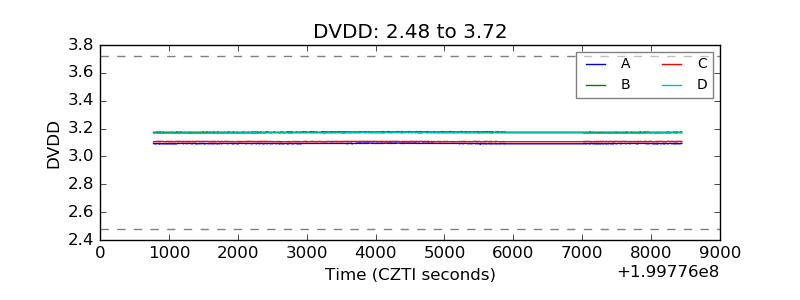 |
| Temperature 1 | 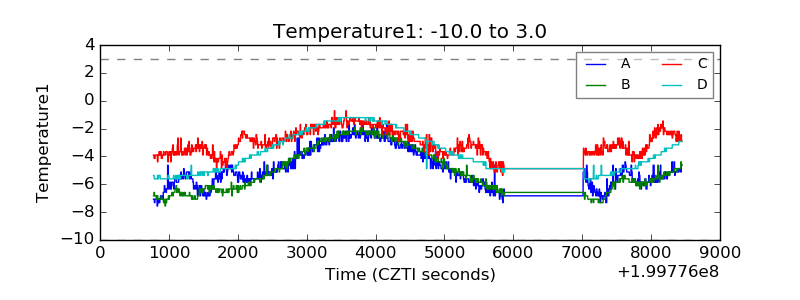 |
| Veto HV Monitor | 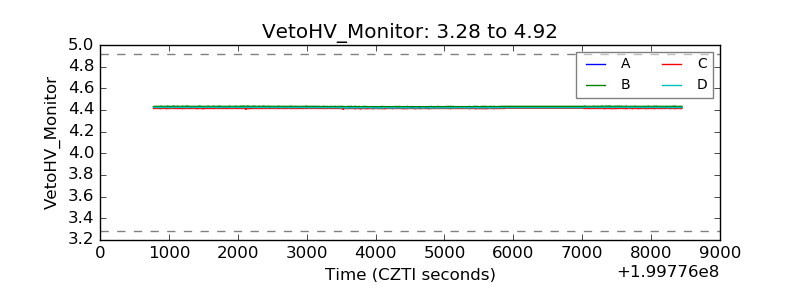 |
| Veto LLD |  |
| Alpha Counter | 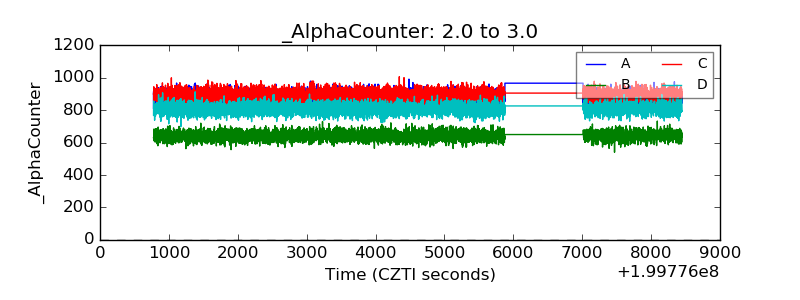 |
| _CPM_Rate | 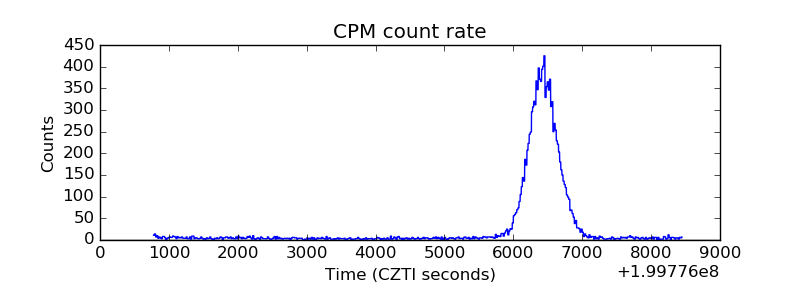 |
| CZT Counter | 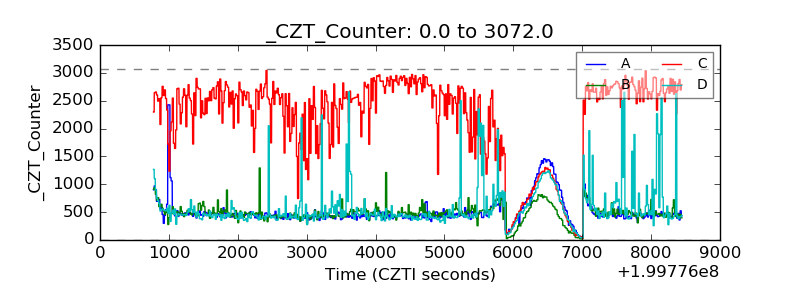 |
| +2.5 Volts monitor |  |
| +5 Volts monitor |  |
| Veto Counter | 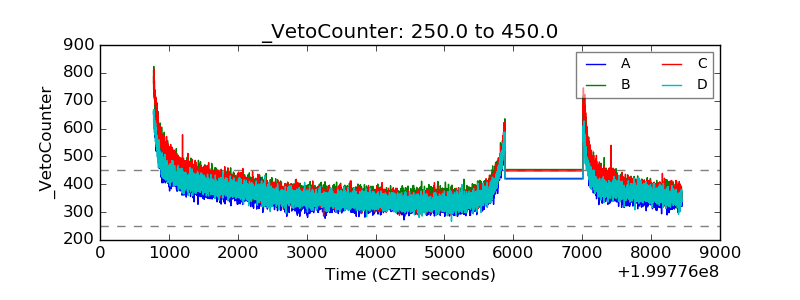 |