| Param | Original file | Final file |
|---|---|---|
| Filename | modeM0/AS1G05_233T10_9000000438_03201cztM0_level2.evt | modeM0/AS1G05_233T10_9000000438_03201cztM0_level2_quad_clean.evt |
| Size (bytes) | 778,032,000 | 61,911,360 |
| Size | 742.0 MB | 59.0 MB |
| Events in quadrant A | 3,062,140 | 374,019 |
| Events in quadrant B | 3,305,329 | 374,353 |
| Events in quadrant C | 13,281,542 | 301,247 |
| Events in quadrant D | 3,463,231 | 359,683 |
| Mode M9 | |||
|---|---|---|---|
| Quadrant | BADHDUFLAG | Total packets | Discarded packets |
| A | 0 | 9 | 0 |
| B | 0 | 9 | 0 |
| C | 0 | 9 | 0 |
| D | 0 | 9 | 0 |
| Mode M0 | |||
|---|---|---|---|
| Quadrant | BADHDUFLAG | Total packets | Discarded packets |
| A | 0 | 13787 | 2 |
| B | 0 | 13990 | 1 |
| C | 0 | 44026 | 1 |
| D | 0 | 15144 | 1 |
| Mode SS | |||
|---|---|---|---|
| Quadrant | BADHDUFLAG | Total packets | Discarded packets |
| A | 0 | 134 | 0 |
| B | 0 | 134 | 0 |
| C | 0 | 134 | 0 |
| D | 0 | 134 | 0 |
| Quadrant | Total seconds | Saturated seconds | Saturation percentage |
|---|---|---|---|
| A | 6666 | 94 | 1.410141% |
| B | 6666 | 105 | 1.575158% |
| C | 6666 | 3748 | 56.225623% |
| D | 6666 | 194 | 2.910291% |
Noise dominated data is calculated using 1-second bins in cleaned event files. If a bin has >2000 counts, and if more than 50% of those come from <1% of pixels, then it is considered to be noise-dominated and hence unusable.
| Quadrant | # 1 sec bins | Bins with >0 counts | Bins with >2000 counts | High rate bins dominated by noise | Noise dominated (total time) | Noise dominated (detector-on time) | Marked lightcurve |
|---|---|---|---|---|---|---|---|
| A | 7556 | 6666 | 1 | 1 | 0.01% | 0.02% | 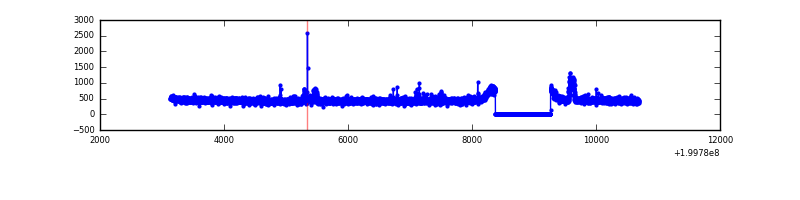 |
| B | 7556 | 6666 | 6 | 6 | 0.08% | 0.09% | 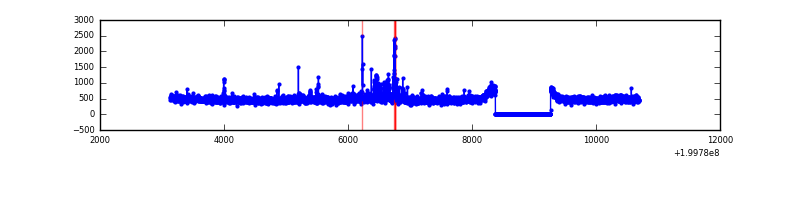 |
| C | 7555 | 6665 | 3655 | 3655 | 48.38% | 54.84% | 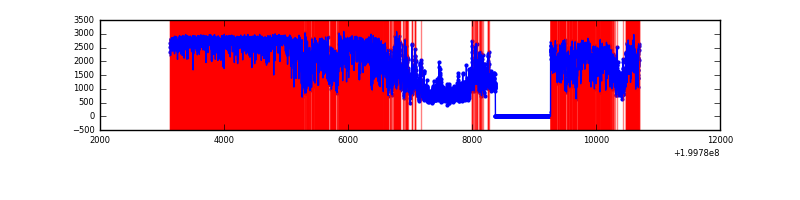 |
| D | 7556 | 6666 | 87 | 87 | 1.15% | 1.31% | 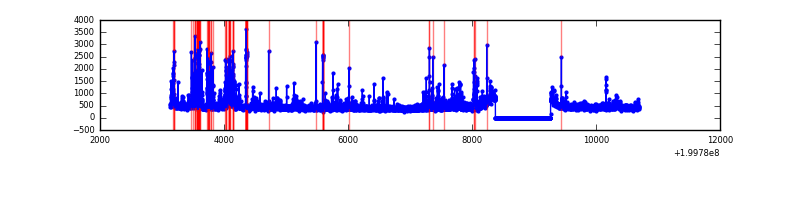 |
Top three noisy pixels from each quadrant. If the there are fewer than three noisy pixels in the level2.evt file, extra rows are filled as -1
| Pixel properties | Quadrant properties | ||||||
|---|---|---|---|---|---|---|---|
| Quadrant | DetID | PixID | Counts | Sigma | Mean | Median | Sigma |
| A | 8 | 15 | 48076 | 304.61 | 763 | 745 | 155.4 |
| A | 13 | 14 | 20646 | 128.08 | 763 | 745 | 155.4 |
| A | 0 | 199 | 13784 | 83.92 | 763 | 745 | 155.4 |
| B | 15 | 204 | 118212 | 792.86 | 777 | 757 | 148.1 |
| B | 4 | 80 | 49553 | 329.39 | 777 | 757 | 148.1 |
| B | 3 | 0 | 44809 | 297.37 | 777 | 757 | 148.1 |
| C | 12 | 206 | 11116949 | 90647.64 | 534 | 536 | 122.6 |
| C | 1 | 192 | 43870 | 353.36 | 534 | 536 | 122.6 |
| C | 6 | 80 | 21324 | 169.51 | 534 | 536 | 122.6 |
| D | 13 | 223 | 349405 | 1962.38 | 735 | 712 | 177.7 |
| D | 5 | 233 | 106793 | 597.0 | 735 | 712 | 177.7 |
| D | 13 | 120 | 81829 | 456.51 | 735 | 712 | 177.7 |
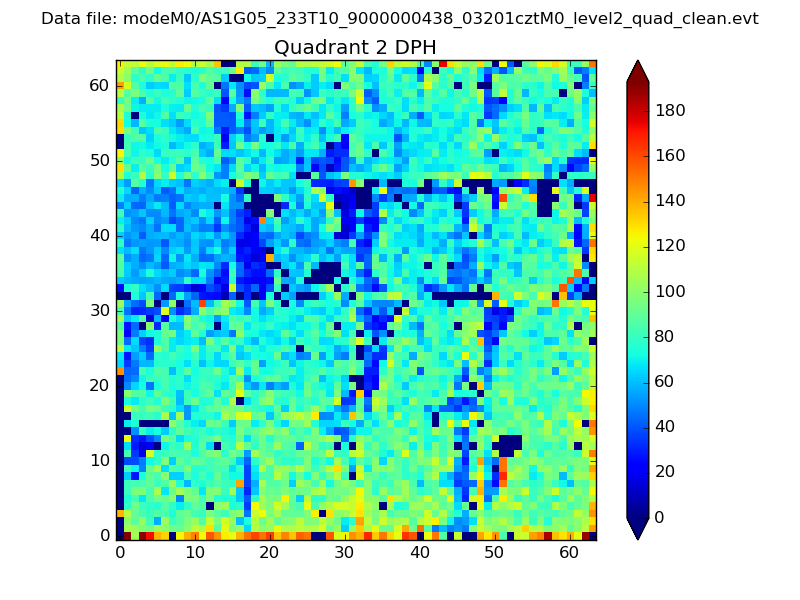
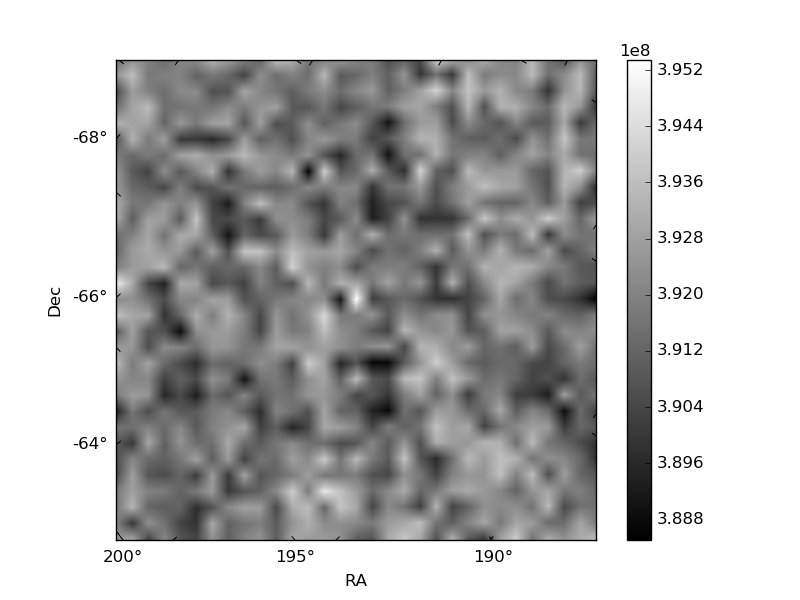
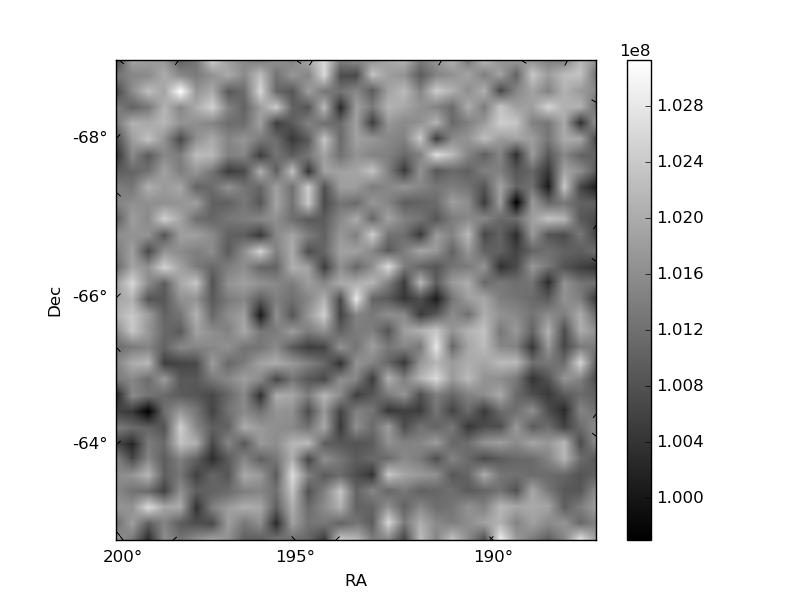
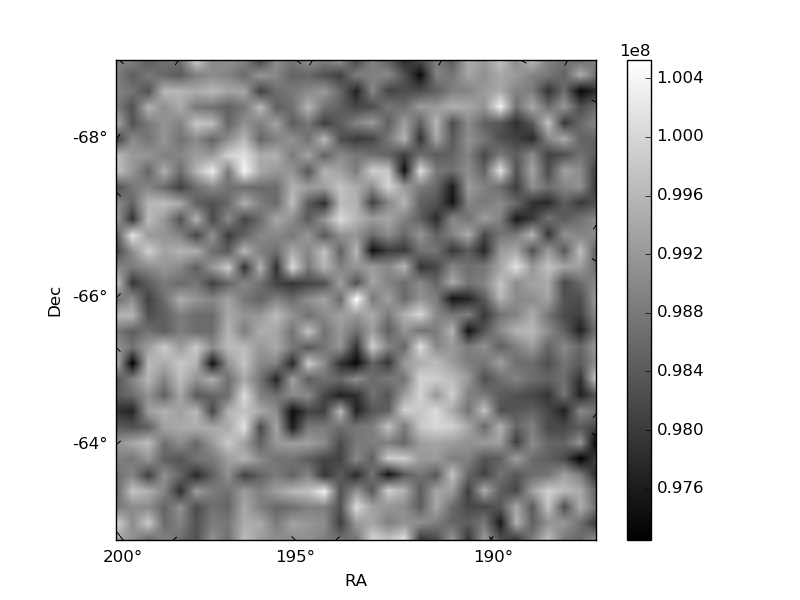
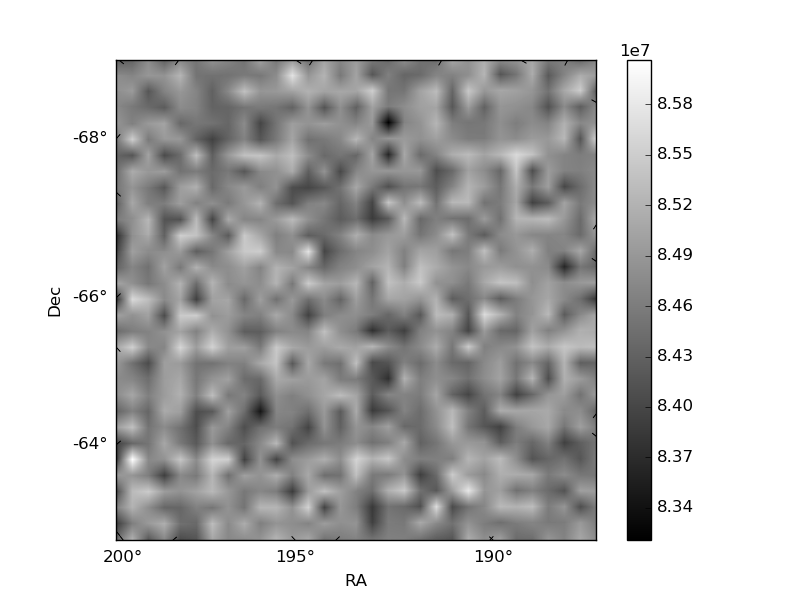
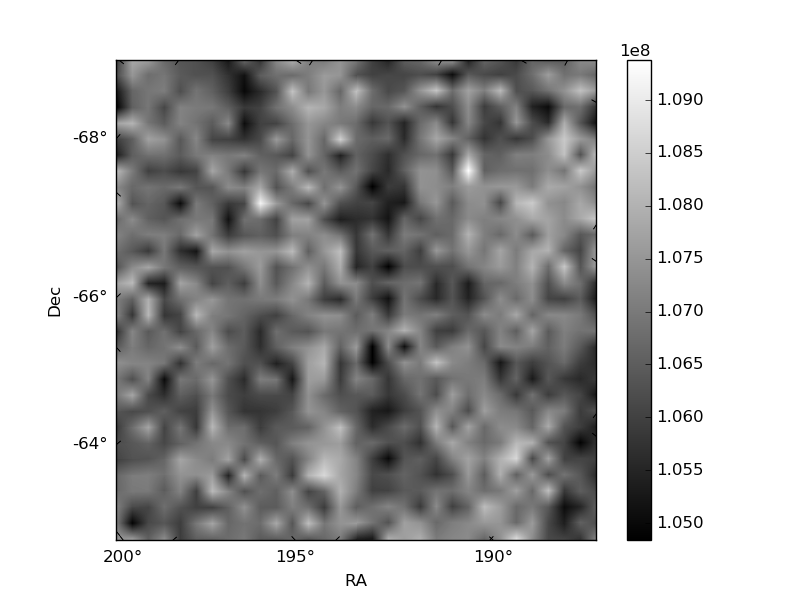
Histogram calculated using DETX and DETY for each event in the final _common_clean file
| Quadrant A | 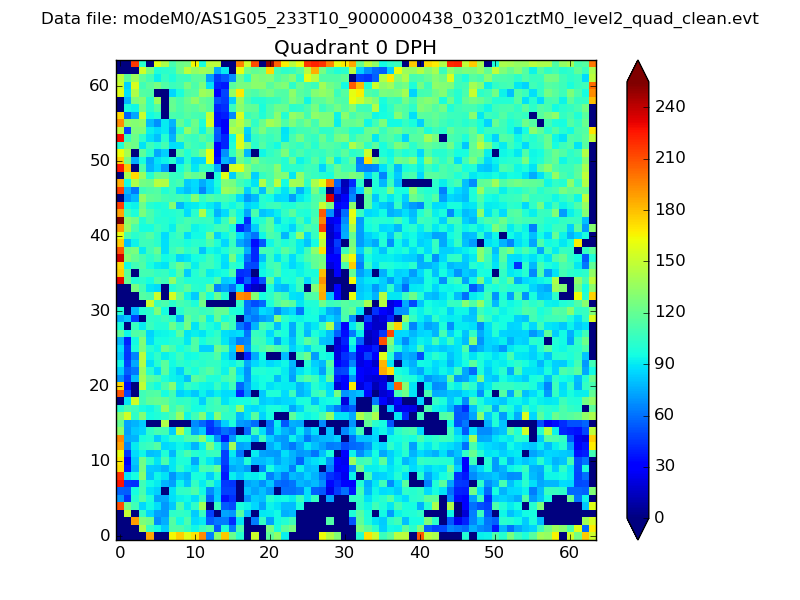 |
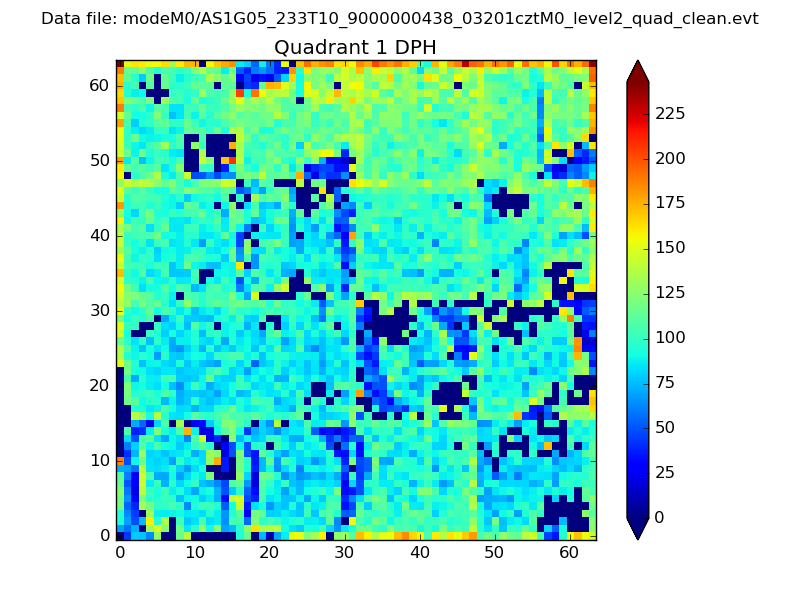 |
Quadrant B |
|---|---|---|---|
| Quadrant D | 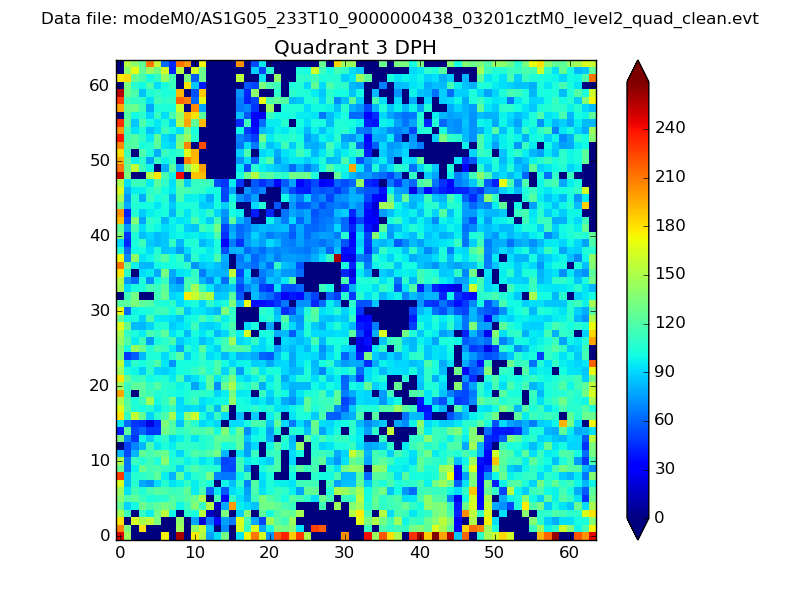 |
 |
Quadrant C |
| Plot type | Count rate plots | Images |
|---|---|---|
| Comparison with Poisson distribution Blue bars denote a histogram of data divided into 1 sec bins. Red curve is a Poisson curve with rate = median count rate of data. |
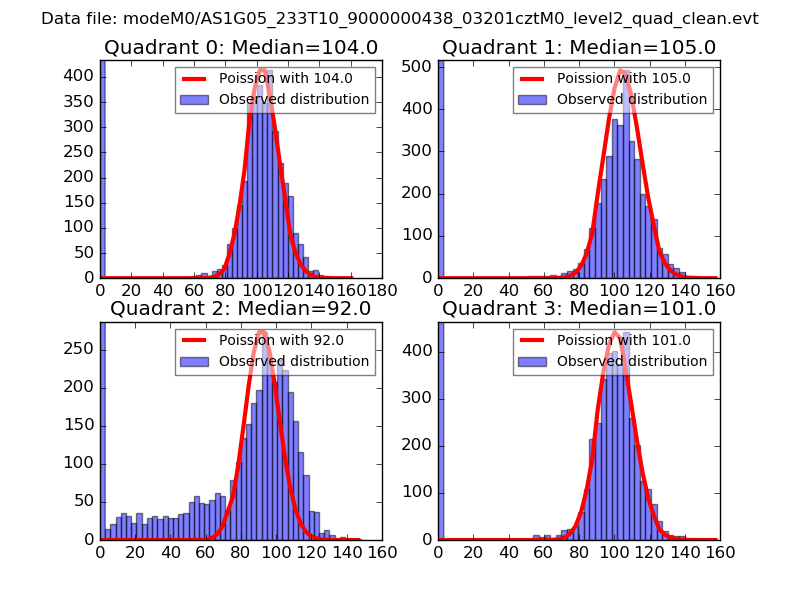 |
 |
| Quadrant-wise count rates Data is divided into 100 sec bins |
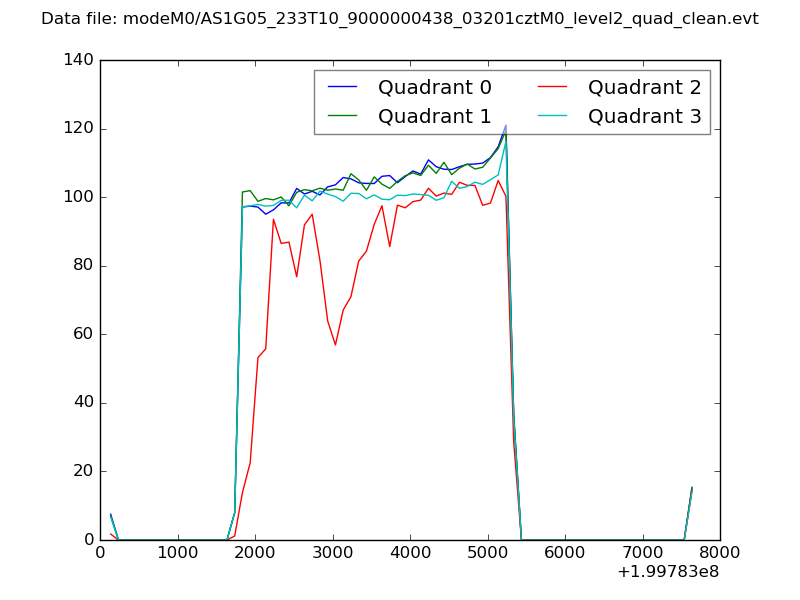 |
|
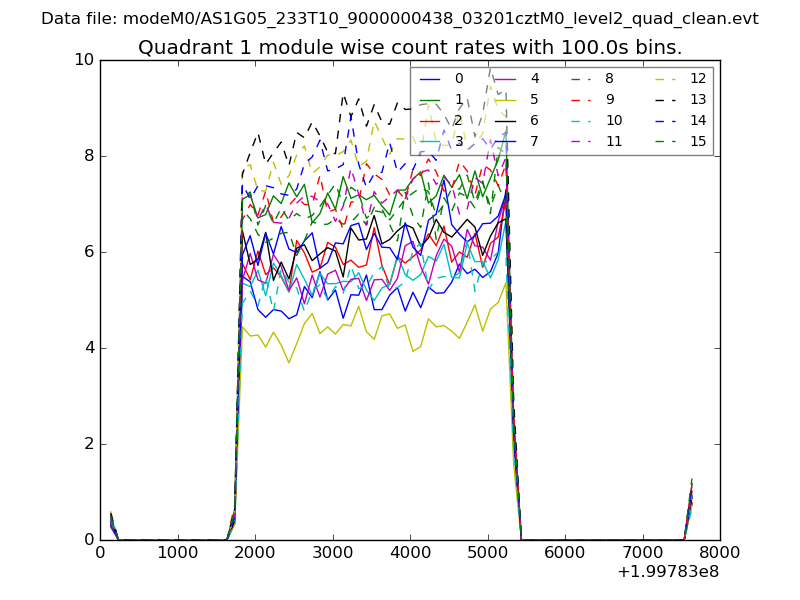
| Module-wise count rates for Quadrant A Data is divided into 100 sec bins |
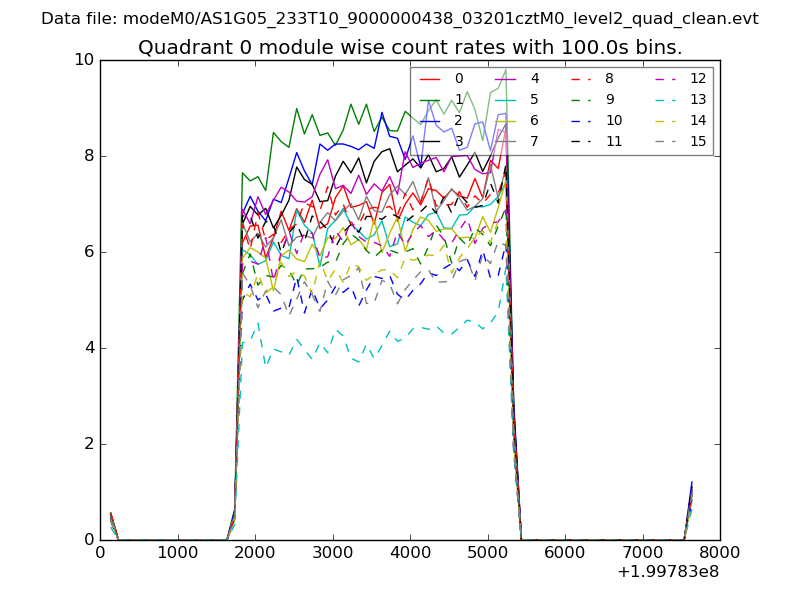 |
 |
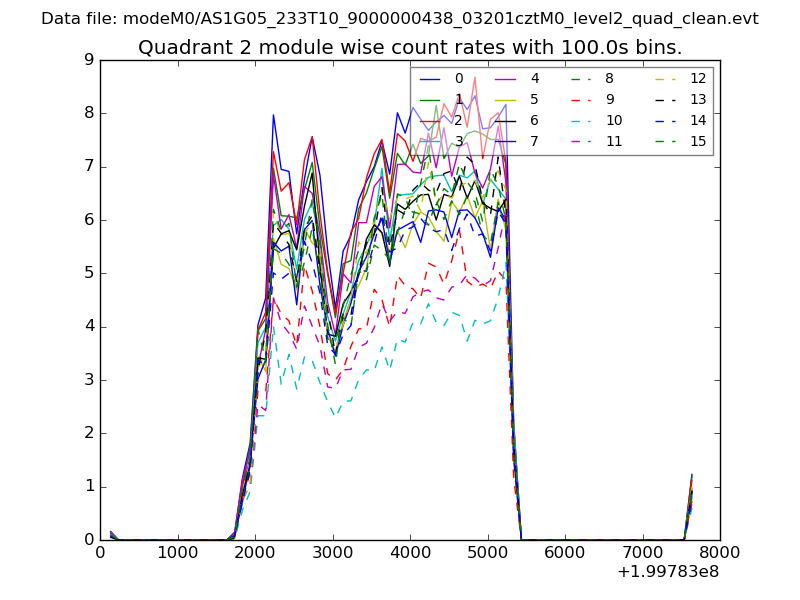
| Module-wise count rates for Quadrant B Data is divided into 100 sec bins |
 |
 |
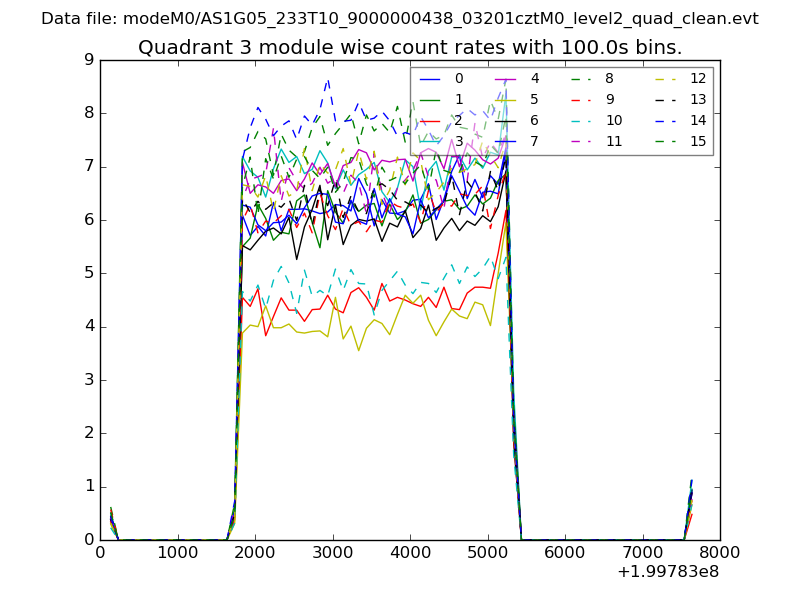
| Module-wise count rates for Quadrant C Data is divided into 100 sec bins |
 |
 |
| Module-wise count rates for Quadrant D Data is divided into 100 sec bins |
 |
 |
| Parameter | Plot |
|---|---|
| CZT HV Monitor | 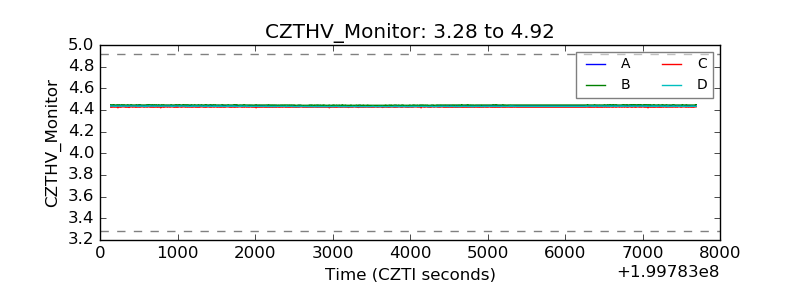 |
| D_VDD | 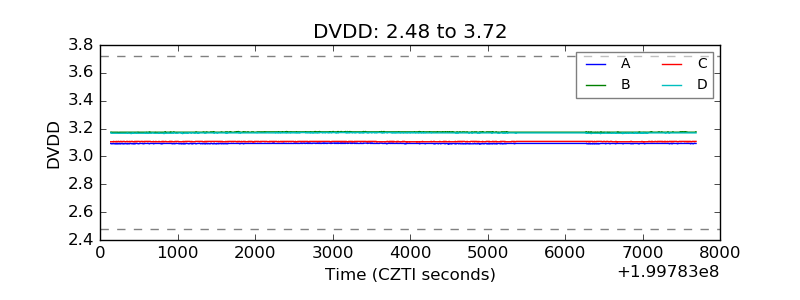 |
| Temperature 1 | 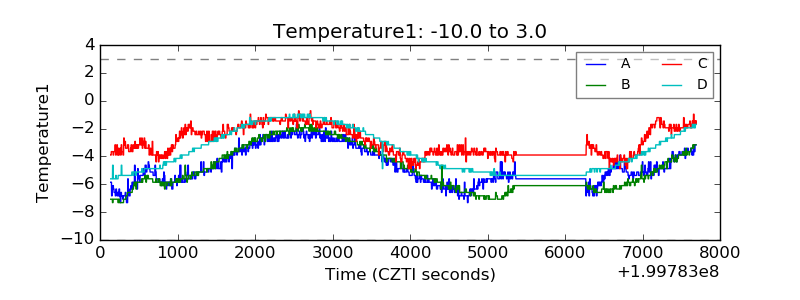 |
| Veto HV Monitor | 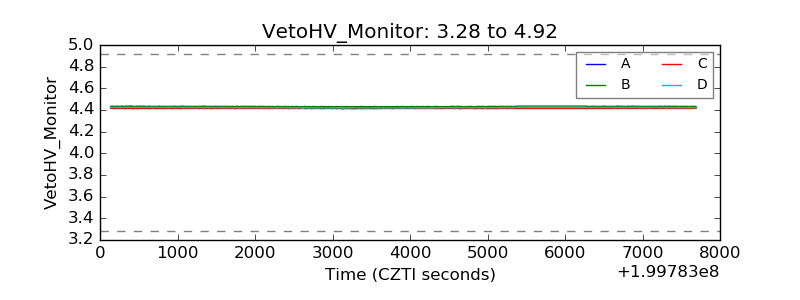 |
| Veto LLD | 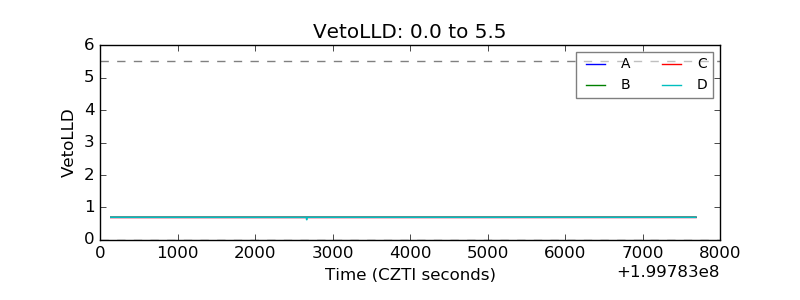 |
| Alpha Counter | 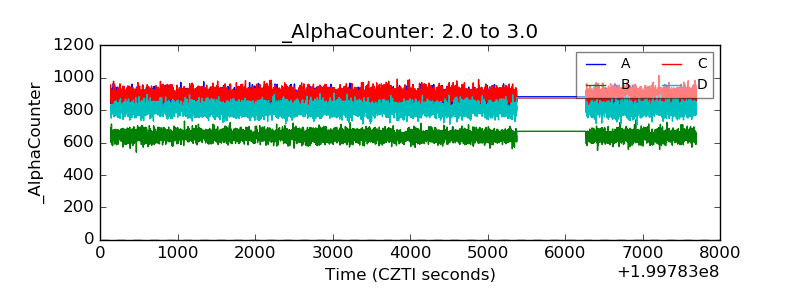 |
| _CPM_Rate | 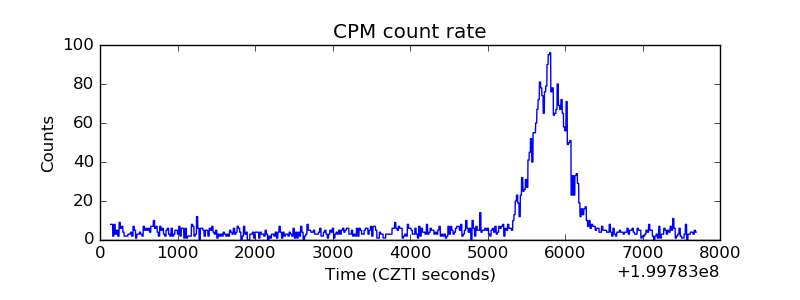 |
| CZT Counter | 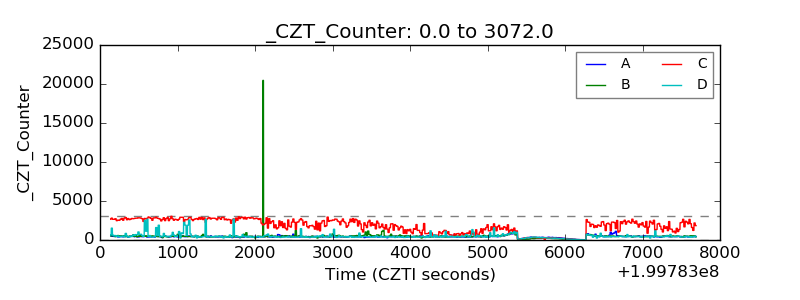 |
| +2.5 Volts monitor |  |
| +5 Volts monitor |  |
| Veto Counter | 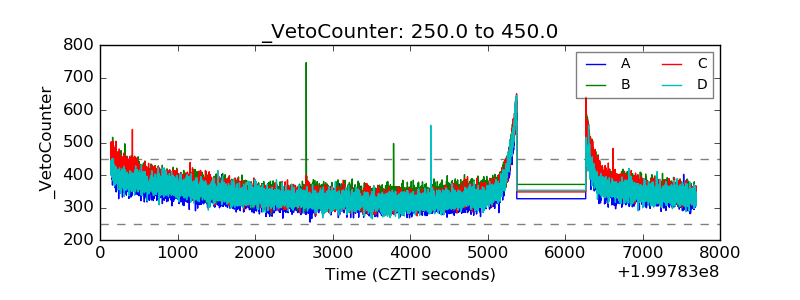 |