| Param | Original file | Final file |
|---|---|---|
| Filename | modeM0/AS1G05_233T10_9000000438_03202cztM0_level2.evt | modeM0/AS1G05_233T10_9000000438_03202cztM0_level2_quad_clean.evt |
| Size (bytes) | 861,094,080 | 74,229,120 |
| Size | 821.2 MB | 70.8 MB |
| Events in quadrant A | 3,382,485 | 475,602 |
| Events in quadrant B | 3,768,529 | 473,578 |
| Events in quadrant C | 14,499,270 | 361,893 |
| Events in quadrant D | 3,963,767 | 456,100 |
| Mode M9 | |||
|---|---|---|---|
| Quadrant | BADHDUFLAG | Total packets | Discarded packets |
| A | 0 | 13 | 0 |
| B | 0 | 13 | 0 |
| C | 0 | 13 | 0 |
| D | 0 | 13 | 0 |
| Mode M0 | |||
|---|---|---|---|
| Quadrant | BADHDUFLAG | Total packets | Discarded packets |
| A | 0 | 15444 | 3 |
| B | 0 | 15932 | 2 |
| C | 0 | 48159 | 2 |
| D | 0 | 17002 | 2 |
| Mode SS | |||
|---|---|---|---|
| Quadrant | BADHDUFLAG | Total packets | Discarded packets |
| A | 0 | 152 | 0 |
| B | 0 | 152 | 0 |
| C | 0 | 152 | 0 |
| D | 0 | 152 | 0 |
| Quadrant | Total seconds | Saturated seconds | Saturation percentage |
|---|---|---|---|
| A | 7367 | 239 | 3.244197% |
| B | 7367 | 231 | 3.135605% |
| C | 7367 | 3891 | 52.816615% |
| D | 7367 | 291 | 3.950048% |
Noise dominated data is calculated using 1-second bins in cleaned event files. If a bin has >2000 counts, and if more than 50% of those come from <1% of pixels, then it is considered to be noise-dominated and hence unusable.
| Quadrant | # 1 sec bins | Bins with >0 counts | Bins with >2000 counts | High rate bins dominated by noise | Noise dominated (total time) | Noise dominated (detector-on time) | Marked lightcurve |
|---|---|---|---|---|---|---|---|
| A | 8652 | 7368 | 4 | 4 | 0.05% | 0.05% | 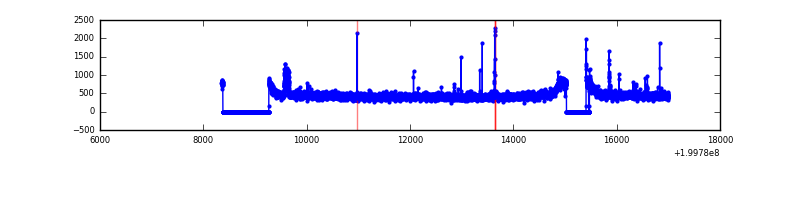 |
| B | 8652 | 7367 | 0 | 0 | 0.00% | 0.00% | 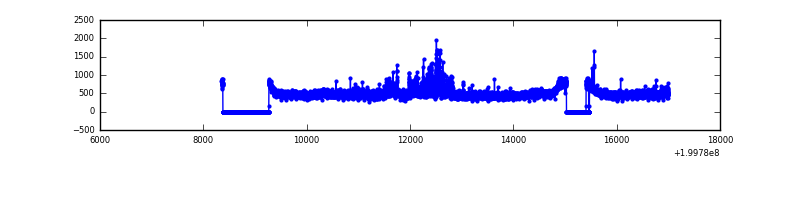 |
| C | 8651 | 7366 | 3788 | 3788 | 43.79% | 51.43% | 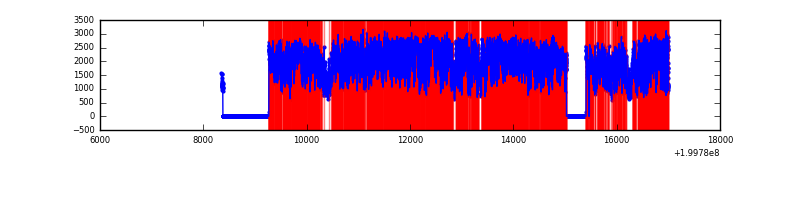 |
| D | 8652 | 7368 | 41 | 41 | 0.47% | 0.56% | 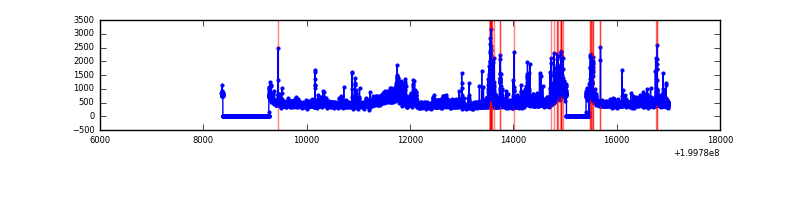 |
Top three noisy pixels from each quadrant. If the there are fewer than three noisy pixels in the level2.evt file, extra rows are filled as -1
| Pixel properties | Quadrant properties | ||||||
|---|---|---|---|---|---|---|---|
| Quadrant | DetID | PixID | Counts | Sigma | Mean | Median | Sigma |
| A | 8 | 15 | 48578 | 275.4 | 847 | 826 | 173.4 |
| A | 0 | 118 | 35378 | 199.27 | 847 | 826 | 173.4 |
| A | 0 | 226 | 13214 | 71.44 | 847 | 826 | 173.4 |
| B | 15 | 204 | 223691 | 1334.36 | 863 | 839 | 167.0 |
| B | 4 | 80 | 154102 | 917.69 | 863 | 839 | 167.0 |
| B | 3 | 0 | 25730 | 149.04 | 863 | 839 | 167.0 |
| C | 12 | 206 | 11414269 | 72356.96 | 684 | 685 | 157.7 |
| C | 14 | 223 | 301812 | 1909.01 | 684 | 685 | 157.7 |
| C | 1 | 192 | 70416 | 442.06 | 684 | 685 | 157.7 |
| D | 13 | 114 | 322274 | 1615.05 | 821 | 795 | 199.1 |
| D | 13 | 223 | 203390 | 1017.8 | 821 | 795 | 199.1 |
| D | 13 | 239 | 109201 | 544.61 | 821 | 795 | 199.1 |
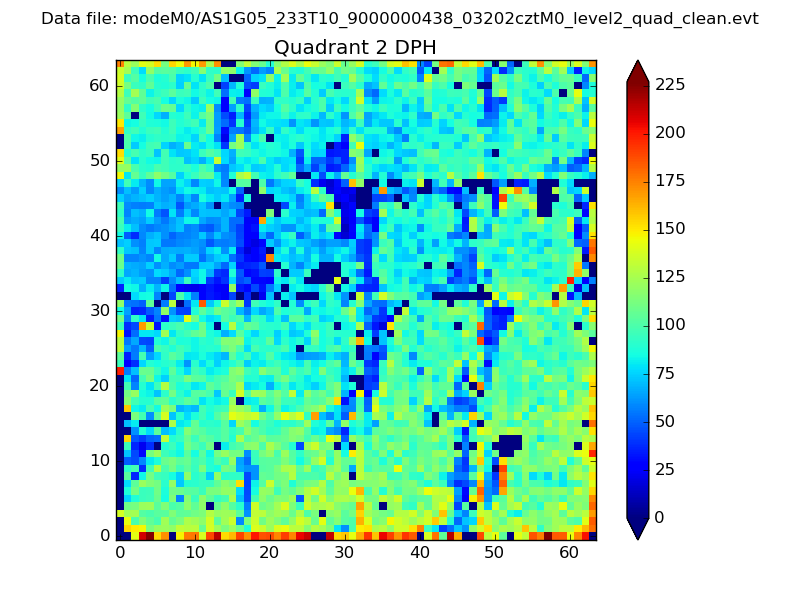
Histogram calculated using DETX and DETY for each event in the final _common_clean file
| Quadrant A | 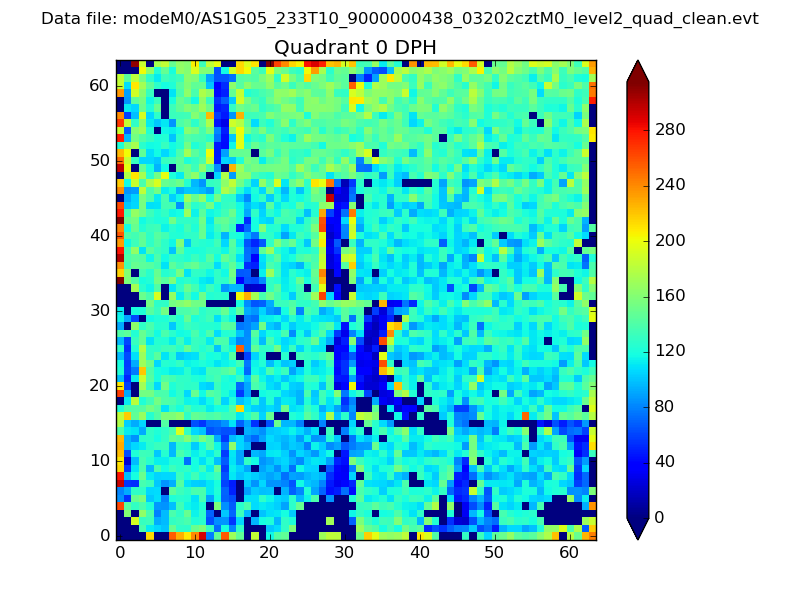 |
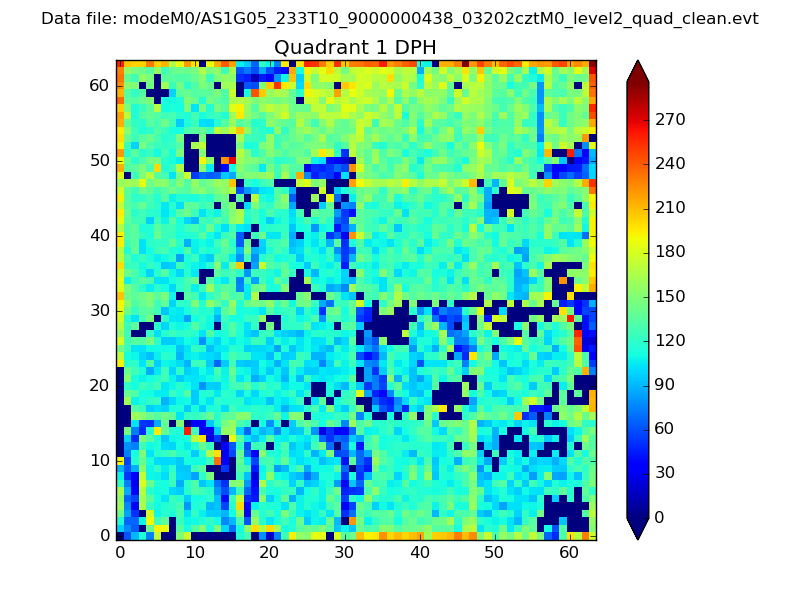 |
Quadrant B |
|---|---|---|---|
| Quadrant D | 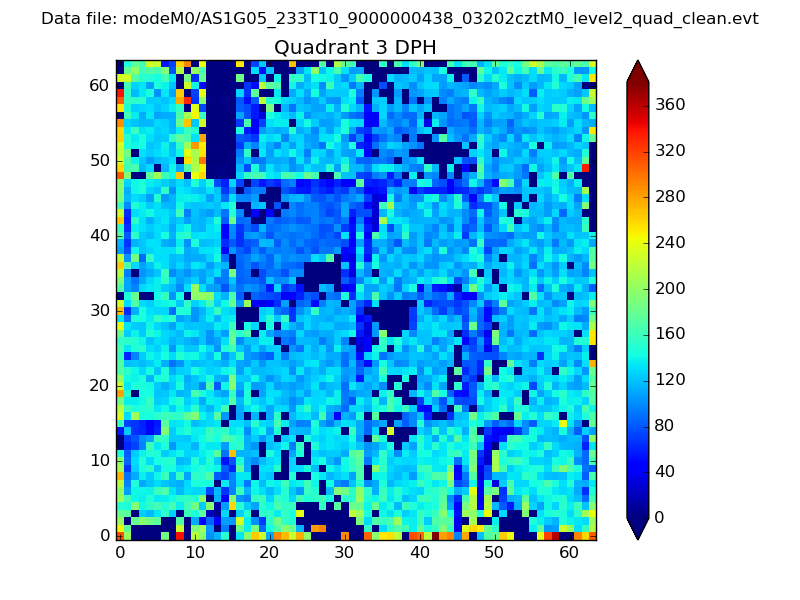 |
 |
Quadrant C |
| Plot type | Count rate plots | Images |
|---|---|---|
| Comparison with Poisson distribution Blue bars denote a histogram of data divided into 1 sec bins. Red curve is a Poisson curve with rate = median count rate of data. |
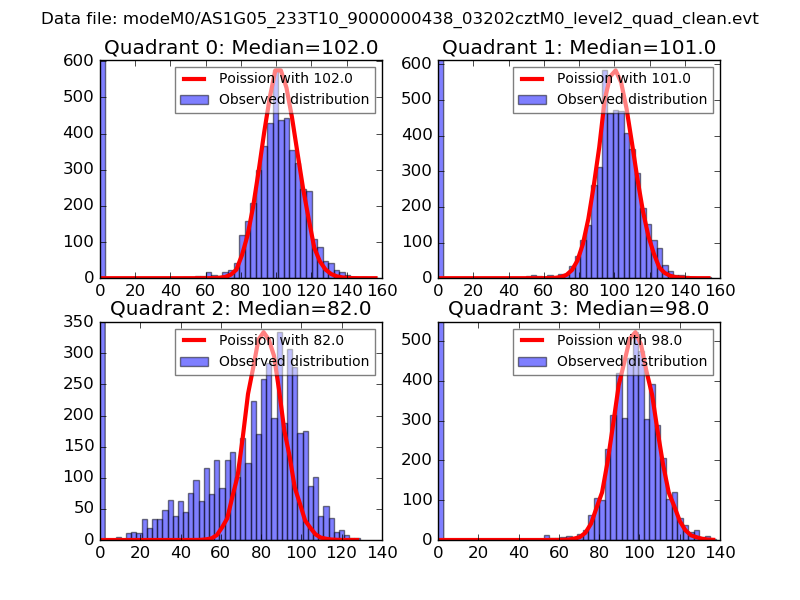 |
 |
| Quadrant-wise count rates Data is divided into 100 sec bins |
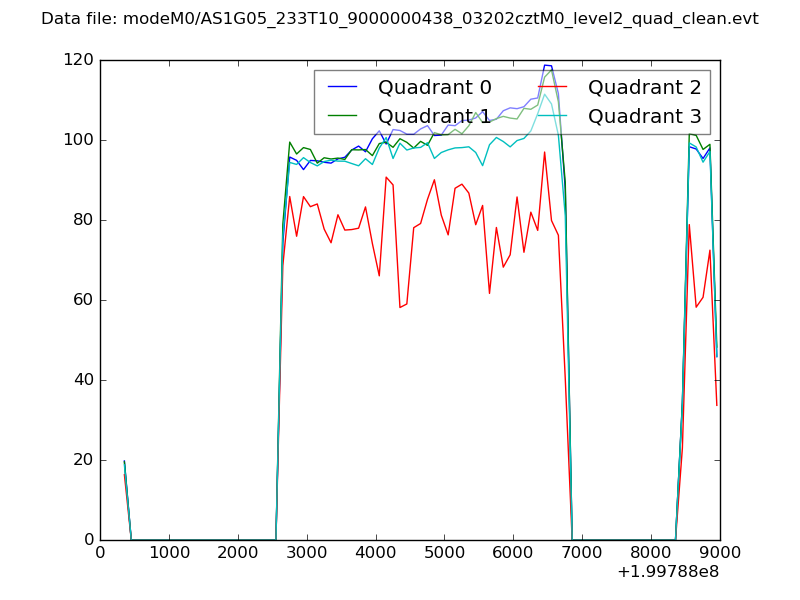 |
|
| Module-wise count rates for Quadrant A Data is divided into 100 sec bins |
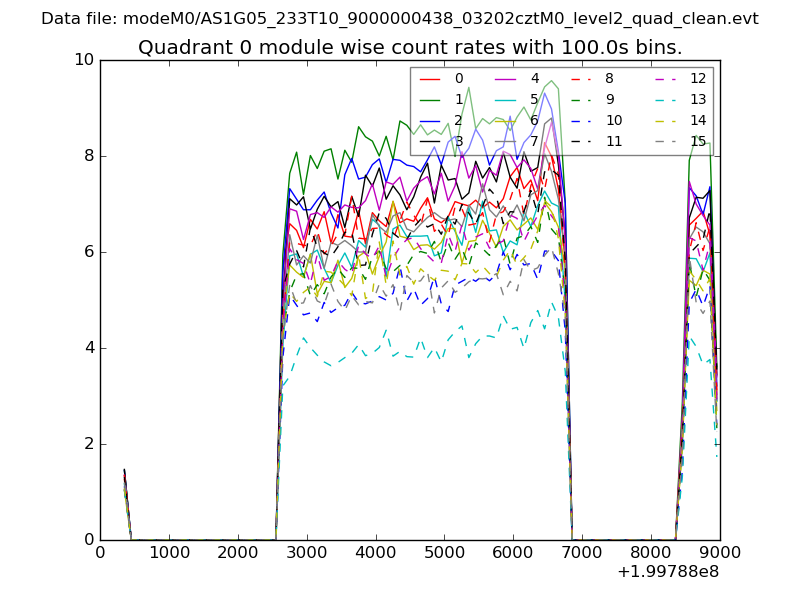 |
 |
| Module-wise count rates for Quadrant B Data is divided into 100 sec bins |
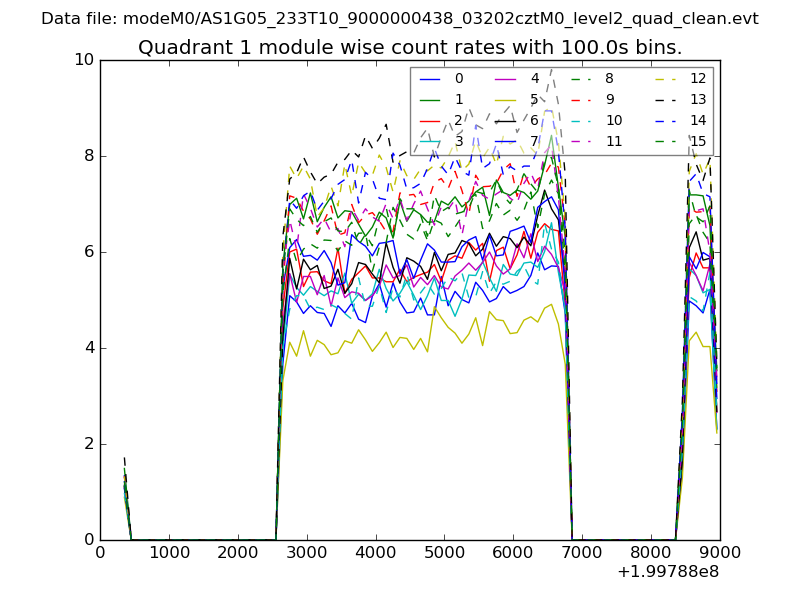 |
 |
| Module-wise count rates for Quadrant C Data is divided into 100 sec bins |
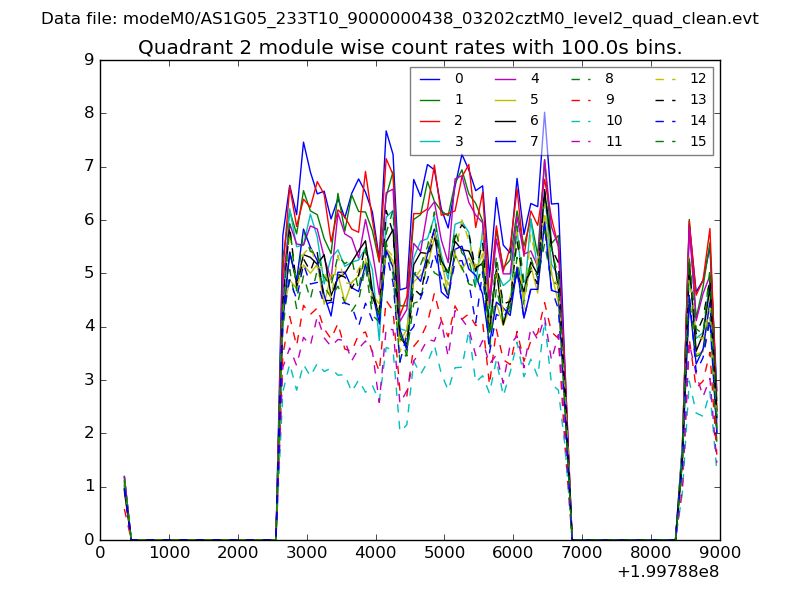 |
 |
| Module-wise count rates for Quadrant D Data is divided into 100 sec bins |
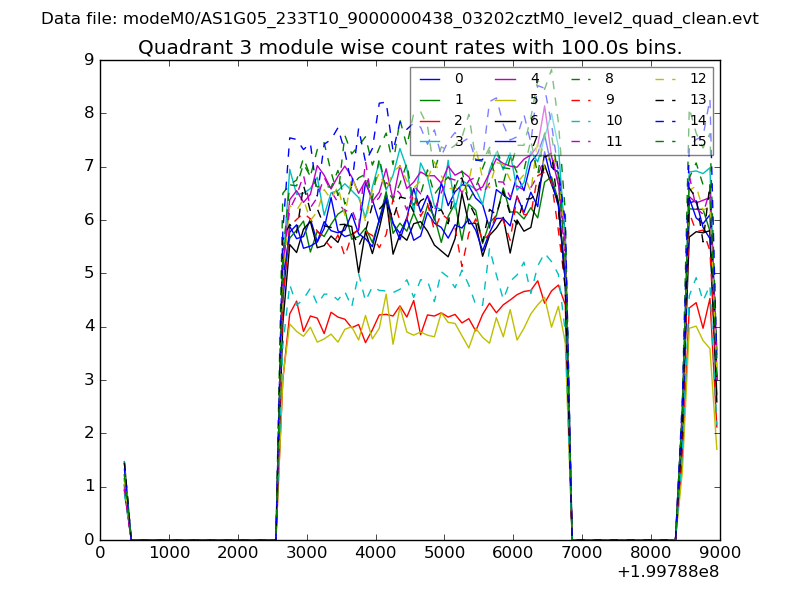 |
 |
| Parameter | Plot |
|---|---|
| CZT HV Monitor | 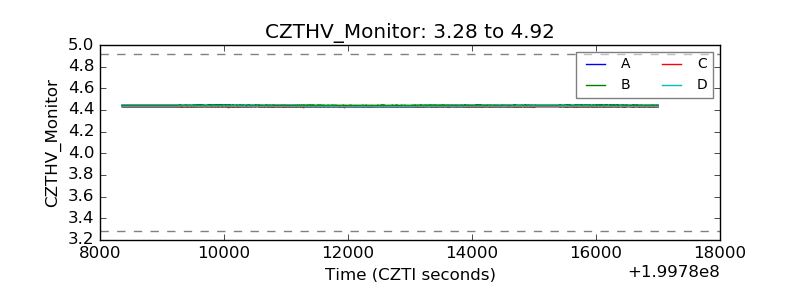 |
| D_VDD | 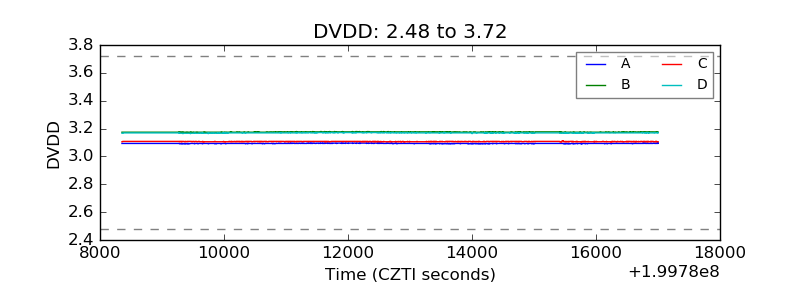 |
| Temperature 1 | 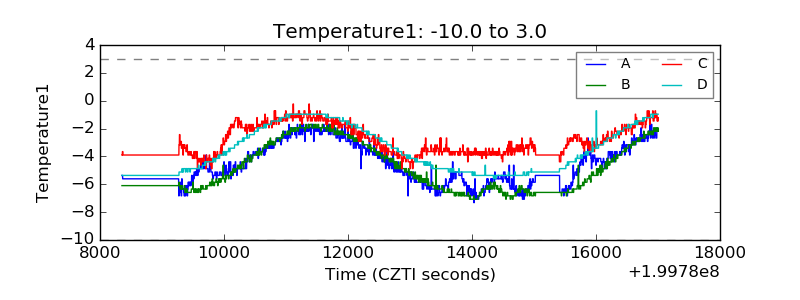 |
| Veto HV Monitor | 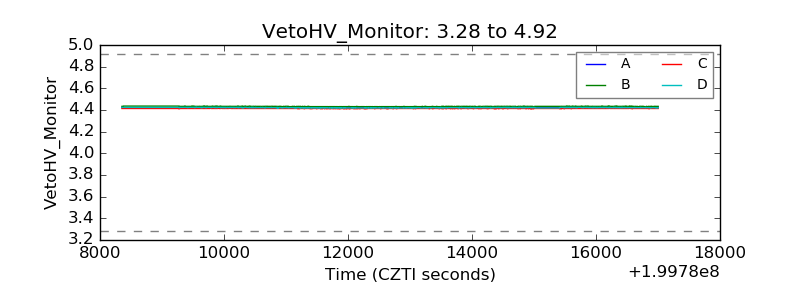 |
| Veto LLD | 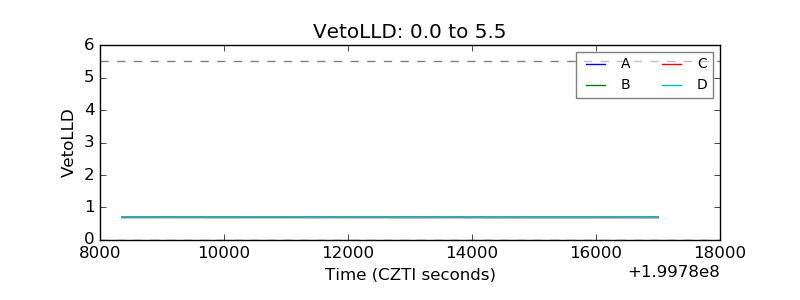 |
| Alpha Counter | 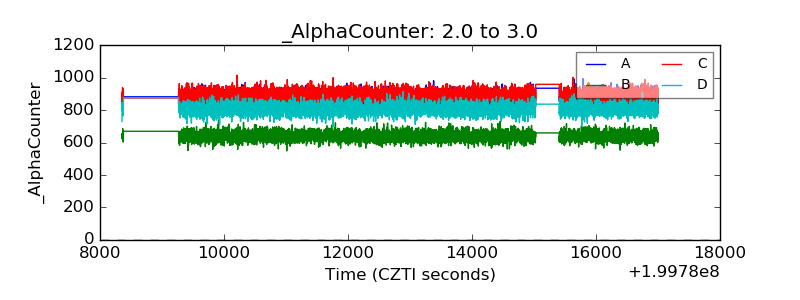 |
| _CPM_Rate | 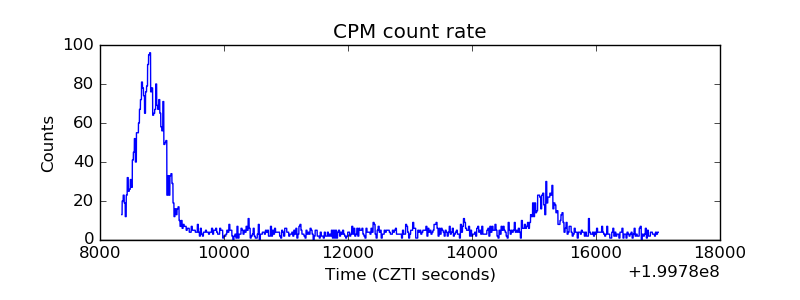 |
| CZT Counter | 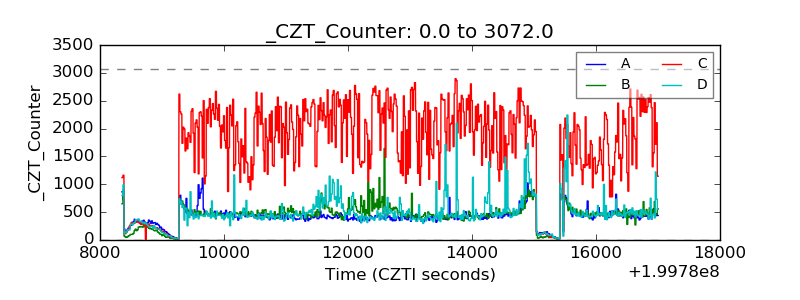 |
| +2.5 Volts monitor | 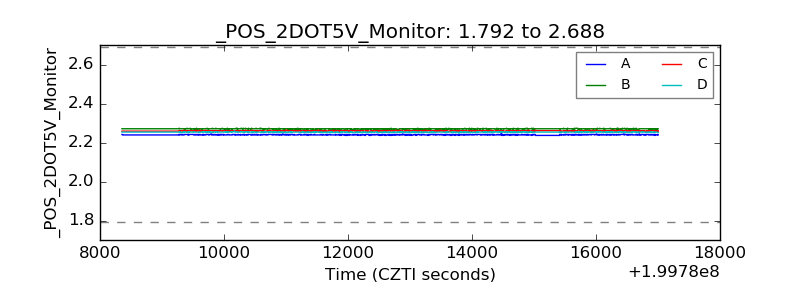 |
| +5 Volts monitor |  |
| Veto Counter | 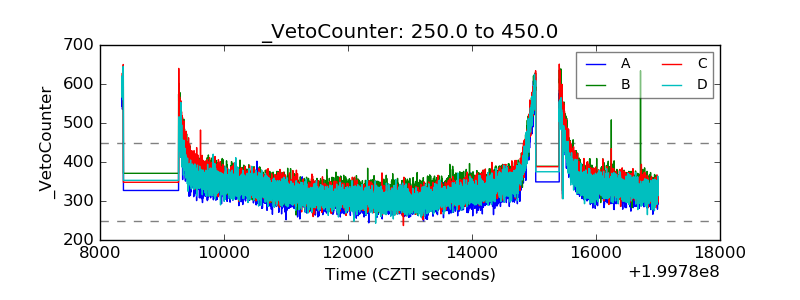 |