| Param | Original file | Final file |
|---|---|---|
| Filename | modeM0/AS1G05_233T10_9000000438_03203cztM0_level2.evt | modeM0/AS1G05_233T10_9000000438_03203cztM0_level2_quad_clean.evt |
| Size (bytes) | 986,990,400 | 78,940,800 |
| Size | 941.3 MB | 75.3 MB |
| Events in quadrant A | 3,758,319 | 505,588 |
| Events in quadrant B | 3,947,765 | 507,559 |
| Events in quadrant C | 16,809,637 | 334,212 |
| Events in quadrant D | 4,838,186 | 488,558 |
| Mode M9 | |||
|---|---|---|---|
| Quadrant | BADHDUFLAG | Total packets | Discarded packets |
| A | 0 | 4 | 0 |
| B | 0 | 4 | 0 |
| C | 0 | 4 | 0 |
| D | 0 | 4 | 0 |
| Mode M0 | |||
|---|---|---|---|
| Quadrant | BADHDUFLAG | Total packets | Discarded packets |
| A | 0 | 16913 | 2 |
| B | 0 | 16966 | 1 |
| C | 0 | 55379 | 1 |
| D | 0 | 19962 | 1 |
| Mode SS | |||
|---|---|---|---|
| Quadrant | BADHDUFLAG | Total packets | Discarded packets |
| A | 0 | 160 | 0 |
| B | 0 | 160 | 0 |
| C | 0 | 160 | 0 |
| D | 0 | 160 | 0 |
| Quadrant | Total seconds | Saturated seconds | Saturation percentage |
|---|---|---|---|
| A | 7955 | 387 | 4.864865% |
| B | 7955 | 377 | 4.739158% |
| C | 7955 | 5373 | 67.542426% |
| D | 7955 | 443 | 5.568825% |
Noise dominated data is calculated using 1-second bins in cleaned event files. If a bin has >2000 counts, and if more than 50% of those come from <1% of pixels, then it is considered to be noise-dominated and hence unusable.
| Quadrant | # 1 sec bins | Bins with >0 counts | Bins with >2000 counts | High rate bins dominated by noise | Noise dominated (total time) | Noise dominated (detector-on time) | Marked lightcurve |
|---|---|---|---|---|---|---|---|
| A | 8350 | 7956 | 7 | 7 | 0.08% | 0.09% | 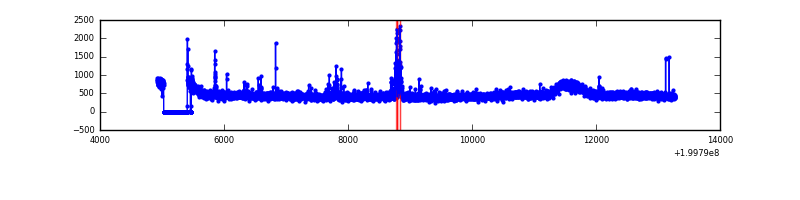 |
| B | 8350 | 7955 | 1 | 1 | 0.01% | 0.01% | 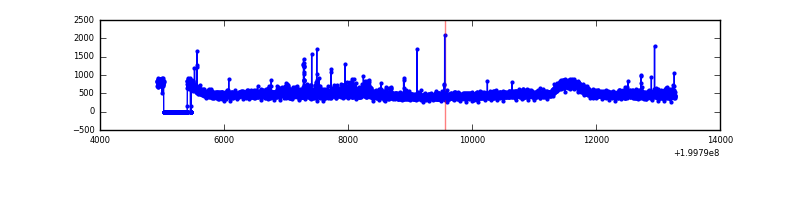 |
| C | 8349 | 7954 | 4980 | 4980 | 59.65% | 62.61% | 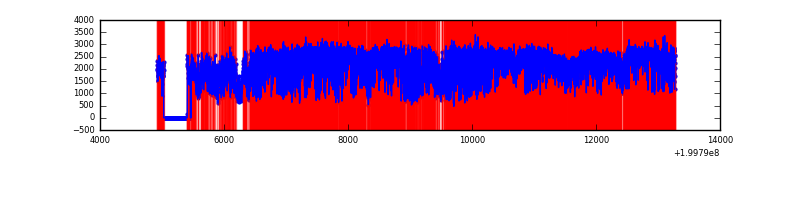 |
| D | 8350 | 7956 | 140 | 140 | 1.68% | 1.76% | 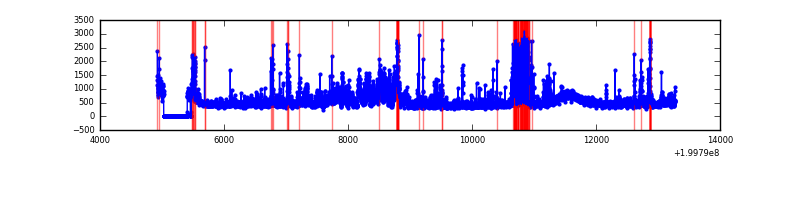 |
Top three noisy pixels from each quadrant. If the there are fewer than three noisy pixels in the level2.evt file, extra rows are filled as -1
| Pixel properties | Quadrant properties | ||||||
|---|---|---|---|---|---|---|---|
| Quadrant | DetID | PixID | Counts | Sigma | Mean | Median | Sigma |
| A | 0 | 118 | 96428 | 496.26 | 930 | 905 | 192.5 |
| A | 15 | 170 | 33777 | 170.78 | 930 | 905 | 192.5 |
| A | 0 | 226 | 19766 | 97.99 | 930 | 905 | 192.5 |
| B | 15 | 204 | 210268 | 1133.3 | 948 | 922 | 184.7 |
| B | 4 | 80 | 23220 | 120.71 | 948 | 922 | 184.7 |
| B | 15 | 54 | 16062 | 81.96 | 948 | 922 | 184.7 |
| C | 12 | 206 | 14058754 | 93408.08 | 647 | 649 | 150.5 |
| C | 1 | 192 | 85802 | 565.79 | 647 | 649 | 150.5 |
| C | 14 | 223 | 55091 | 361.74 | 647 | 649 | 150.5 |
| D | 13 | 114 | 642805 | 2713.21 | 895 | 871 | 236.6 |
| D | 13 | 239 | 348717 | 1470.21 | 895 | 871 | 236.6 |
| D | 13 | 223 | 167746 | 705.32 | 895 | 871 | 236.6 |
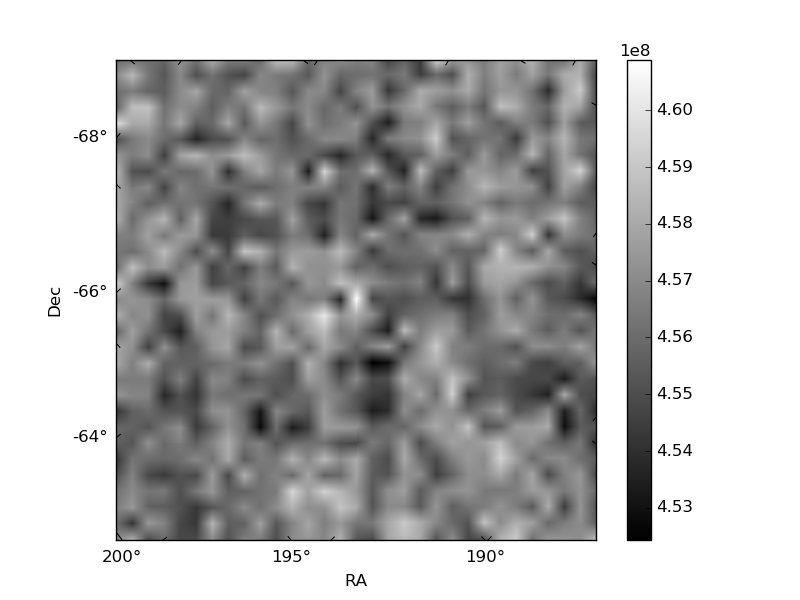
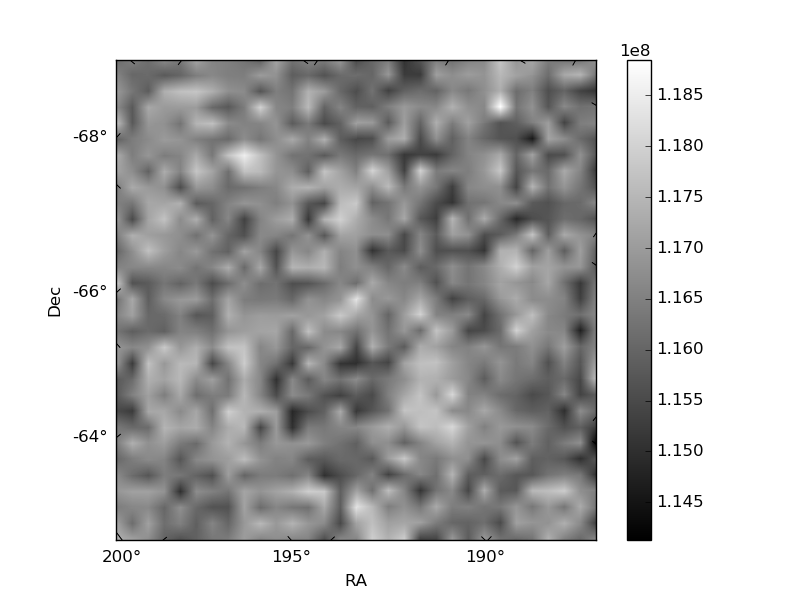
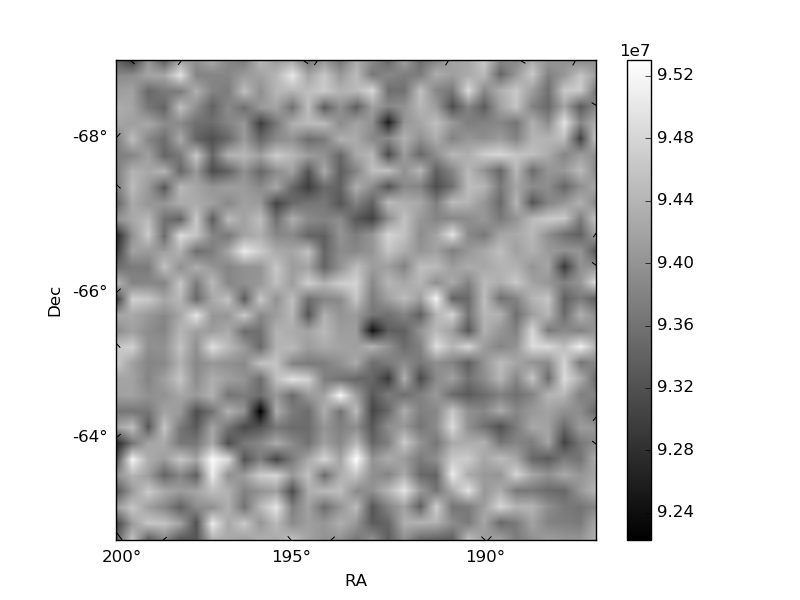
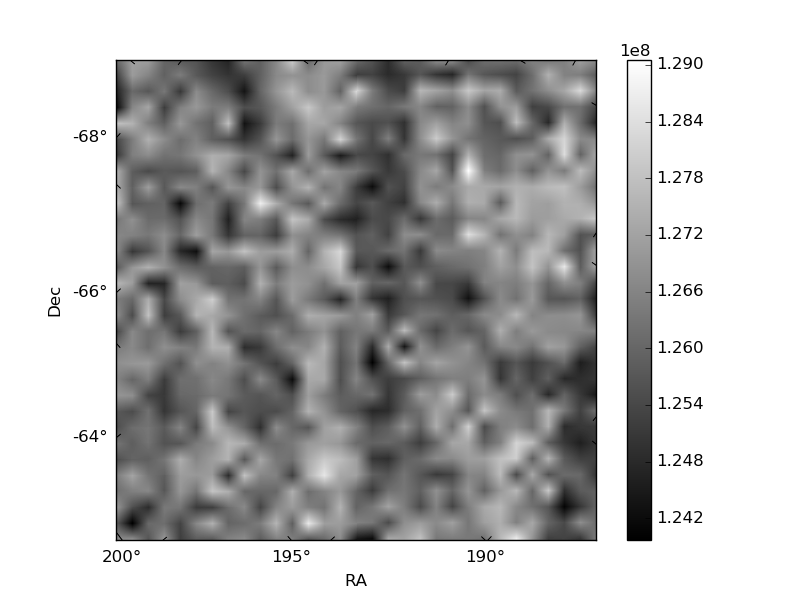
Histogram calculated using DETX and DETY for each event in the final _common_clean file
| Quadrant A | 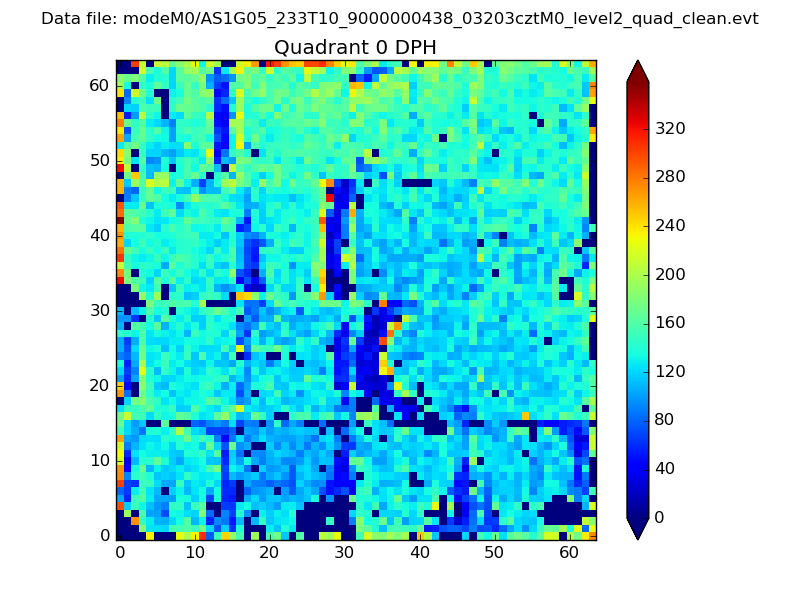 |
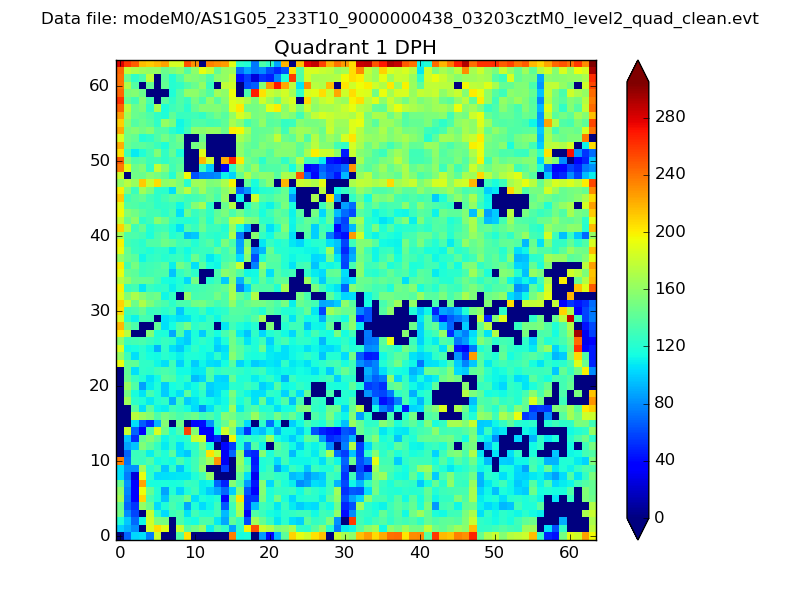 |
Quadrant B |
|---|---|---|---|
| Quadrant D | 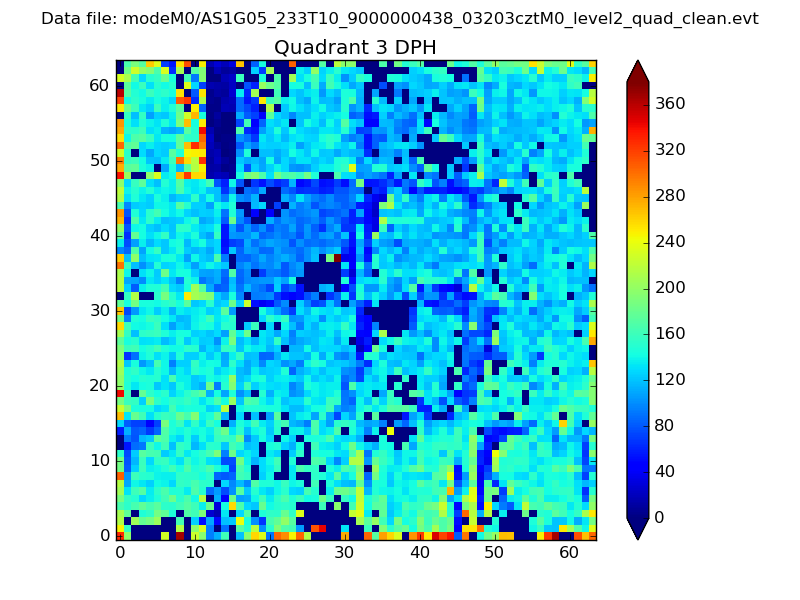 |
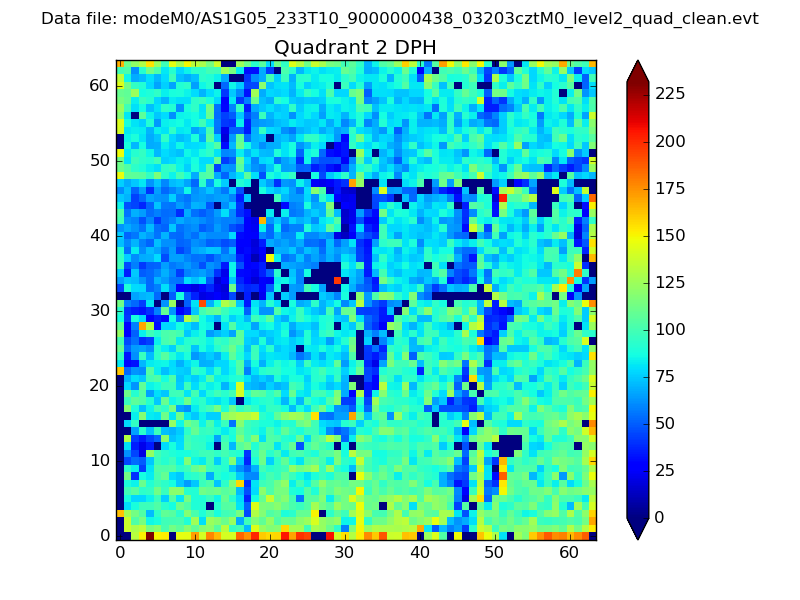 |
Quadrant C |
| Plot type | Count rate plots | Images |
|---|---|---|
| Comparison with Poisson distribution Blue bars denote a histogram of data divided into 1 sec bins. Red curve is a Poisson curve with rate = median count rate of data. |
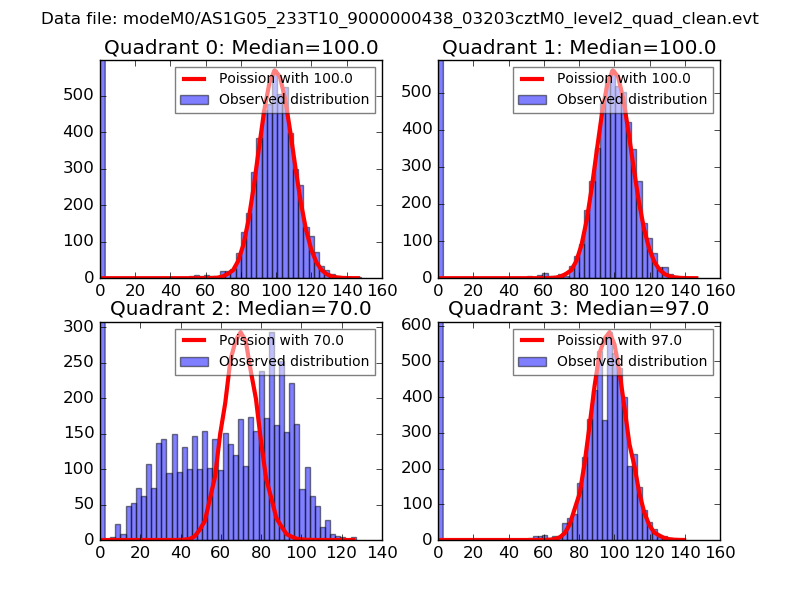 |
 |
| Quadrant-wise count rates Data is divided into 100 sec bins |
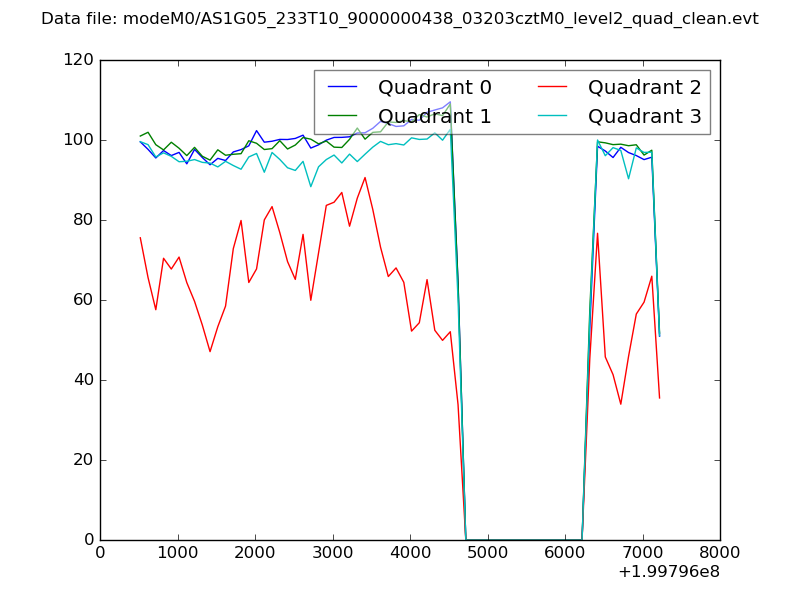 |
|
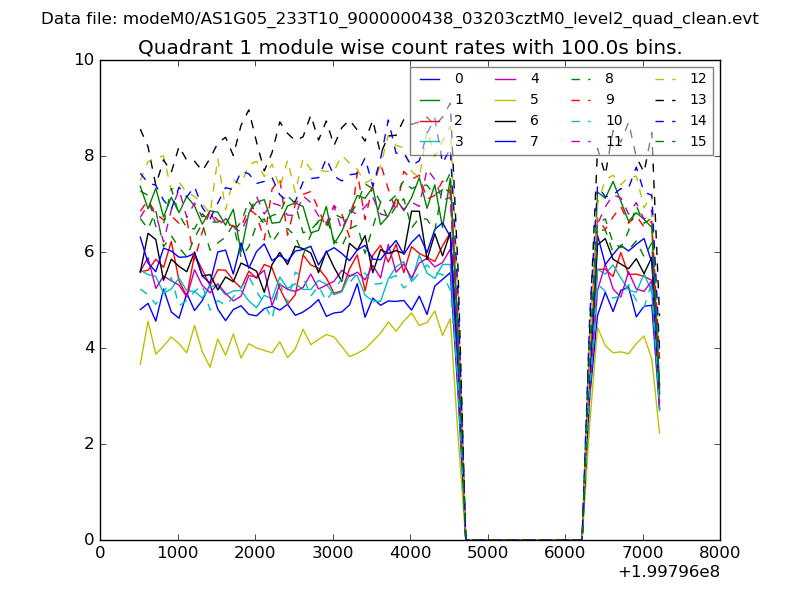
| Module-wise count rates for Quadrant A Data is divided into 100 sec bins |
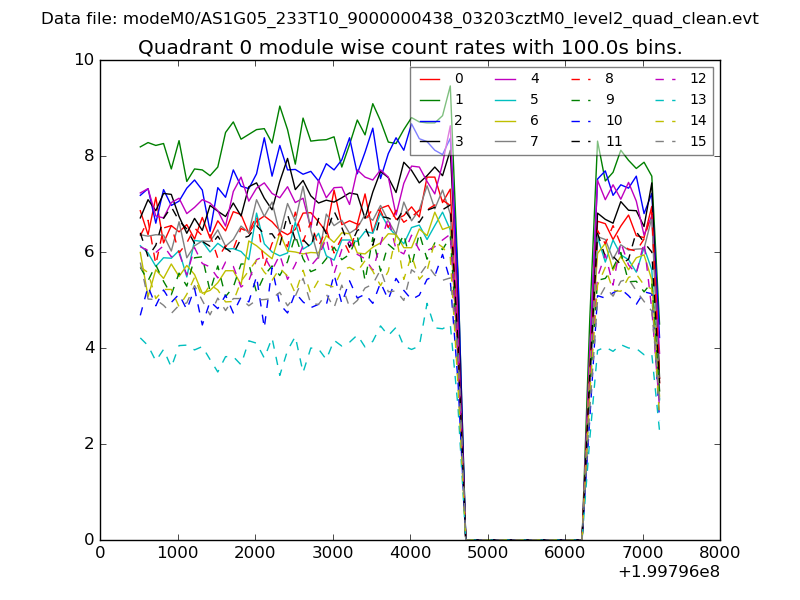 |
 |
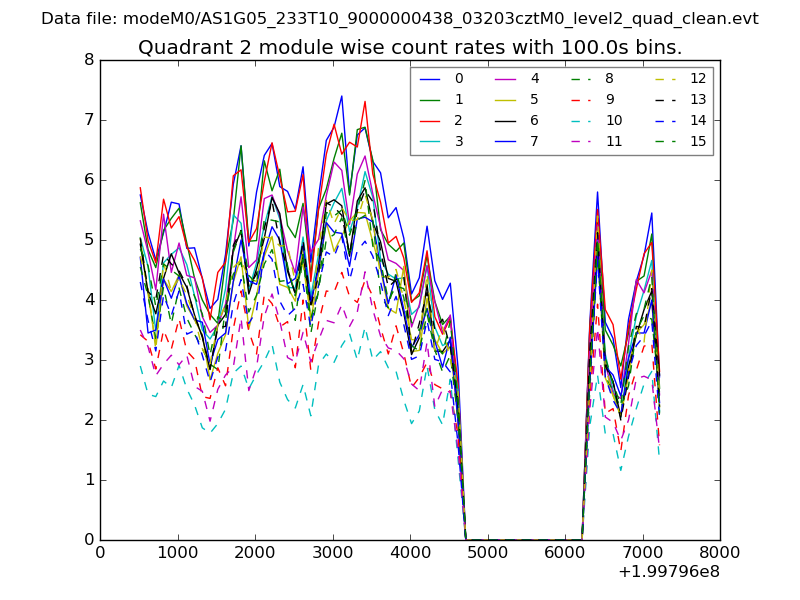
| Module-wise count rates for Quadrant B Data is divided into 100 sec bins |
 |
 |
| Module-wise count rates for Quadrant C Data is divided into 100 sec bins |
 |
 |
| Module-wise count rates for Quadrant D Data is divided into 100 sec bins |
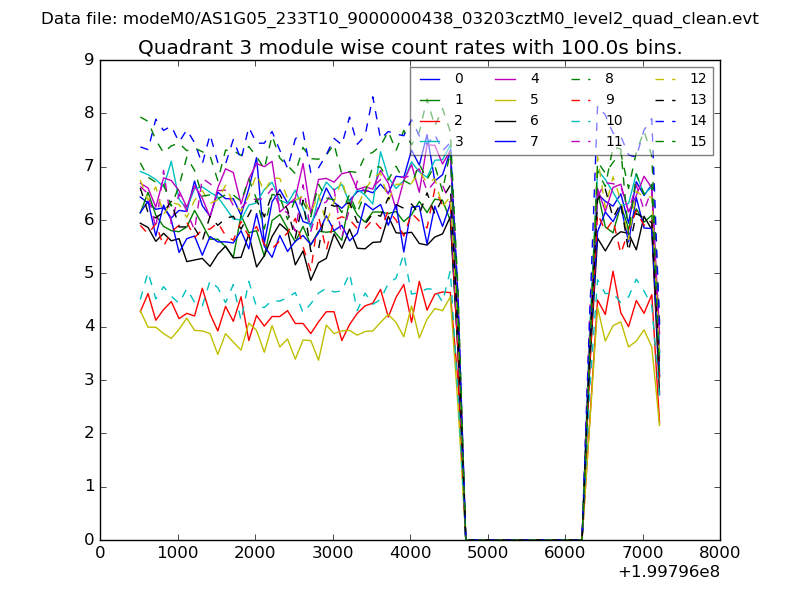 |
 |
| Parameter | Plot |
|---|---|
| CZT HV Monitor | 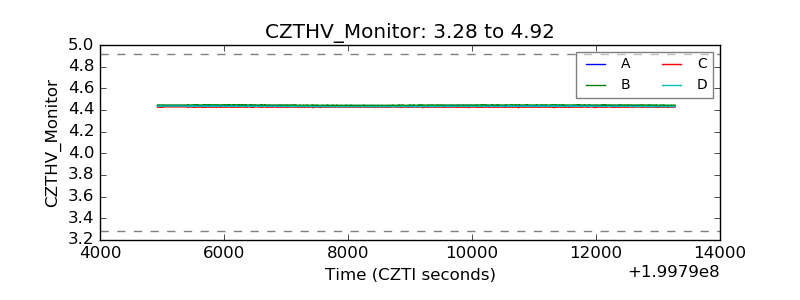 |
| D_VDD | 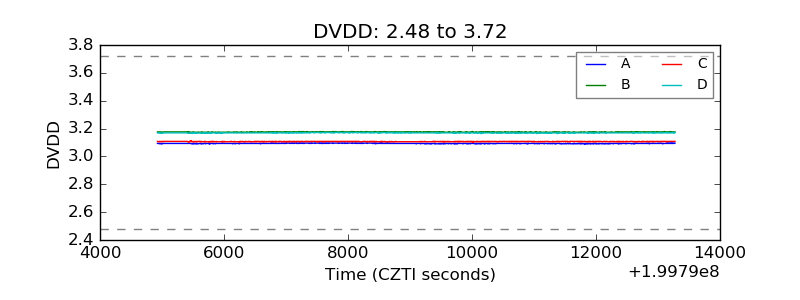 |
| Temperature 1 | 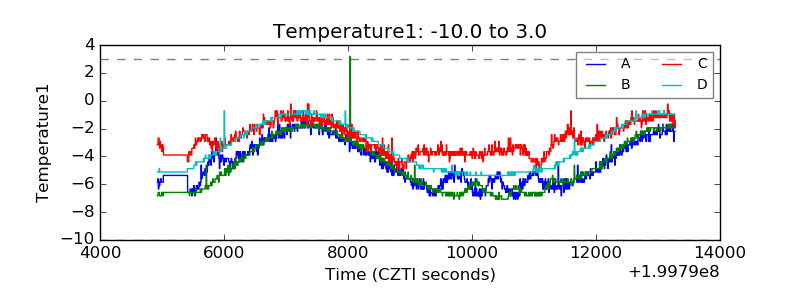 |
| Veto HV Monitor | 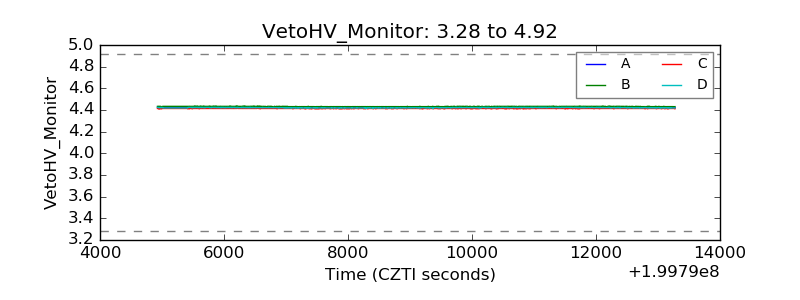 |
| Veto LLD | 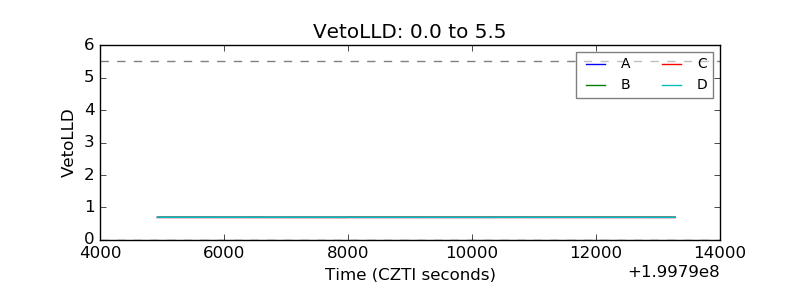 |
| Alpha Counter | 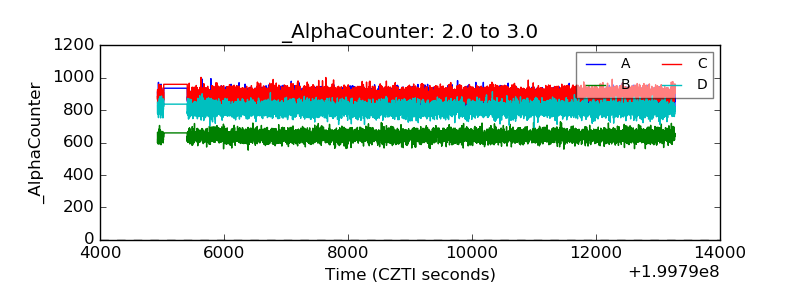 |
| _CPM_Rate | 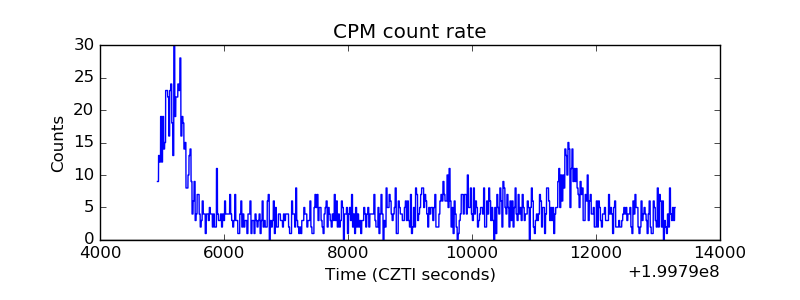 |
| CZT Counter | 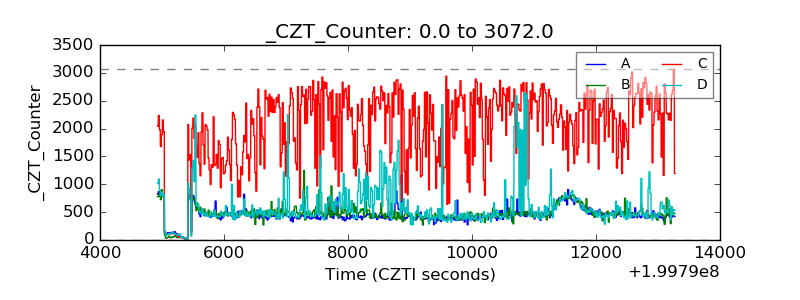 |
| +2.5 Volts monitor |  |
| +5 Volts monitor |  |
| Veto Counter | 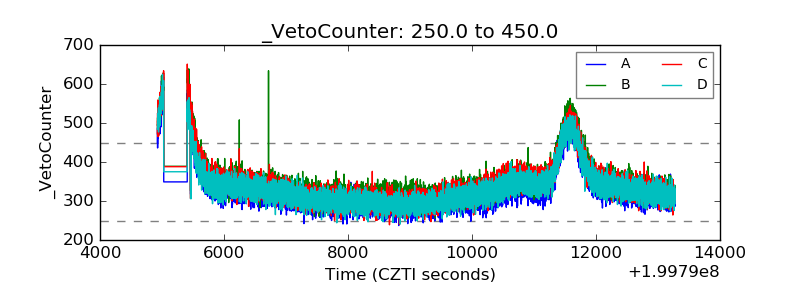 |