| Param | Original file | Final file |
|---|---|---|
| Filename | modeM0/AS1G05_233T10_9000000438_03210cztM0_level2.evt | modeM0/AS1G05_233T10_9000000438_03210cztM0_level2_quad_clean.evt |
| Size (bytes) | 859,800,960 | 77,431,680 |
| Size | 820.0 MB | 73.8 MB |
| Events in quadrant A | 2,934,617 | 540,806 |
| Events in quadrant B | 3,335,500 | 541,620 |
| Events in quadrant C | 15,561,732 | 292,331 |
| Events in quadrant D | 3,754,880 | 501,396 |
| Mode M9 | |||
|---|---|---|---|
| Quadrant | BADHDUFLAG | Total packets | Discarded packets |
| A | 0 | 17 | 0 |
| B | 0 | 17 | 0 |
| C | 0 | 17 | 0 |
| D | 0 | 18 | 0 |
| Mode M0 | |||
|---|---|---|---|
| Quadrant | BADHDUFLAG | Total packets | Discarded packets |
| A | 0 | 13568 | 3 |
| B | 0 | 14579 | 2 |
| C | 0 | 50773 | 2 |
| D | 0 | 16056 | 2 |
| Mode SS | |||
|---|---|---|---|
| Quadrant | BADHDUFLAG | Total packets | Discarded packets |
| A | 0 | 136 | 0 |
| B | 0 | 136 | 0 |
| C | 0 | 136 | 0 |
| D | 0 | 136 | 0 |
| Quadrant | Total seconds | Saturated seconds | Saturation percentage |
|---|---|---|---|
| A | 6689 | 8 | 0.119599% |
| B | 6689 | 26 | 0.388698% |
| C | 6689 | 5281 | 78.950516% |
| D | 6689 | 211 | 3.154433% |
Noise dominated data is calculated using 1-second bins in cleaned event files. If a bin has >2000 counts, and if more than 50% of those come from <1% of pixels, then it is considered to be noise-dominated and hence unusable.
| Quadrant | # 1 sec bins | Bins with >0 counts | Bins with >2000 counts | High rate bins dominated by noise | Noise dominated (total time) | Noise dominated (detector-on time) | Marked lightcurve |
|---|---|---|---|---|---|---|---|
| A | 7799 | 6690 | 0 | 0 | 0.00% | 0.00% | 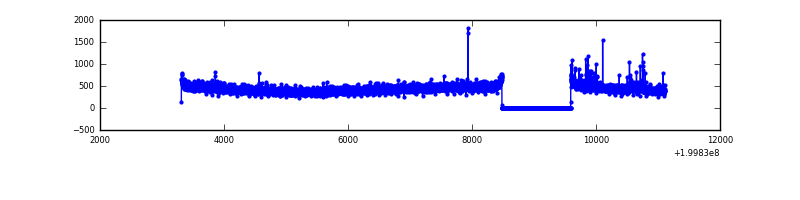 |
| B | 7799 | 6690 | 5 | 5 | 0.06% | 0.07% | 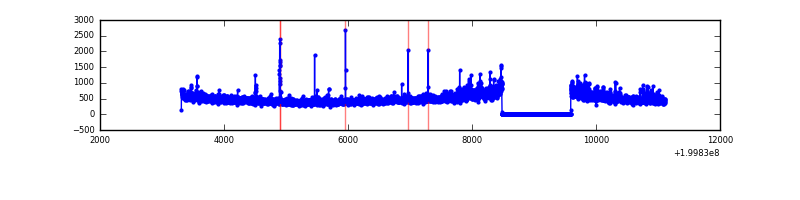 |
| C | 7798 | 6688 | 5322 | 5322 | 68.25% | 79.58% | 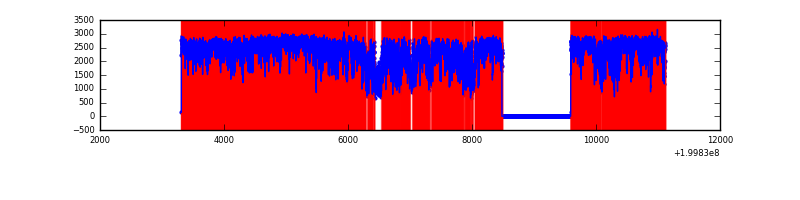 |
| D | 7799 | 6690 | 163 | 163 | 2.09% | 2.44% | 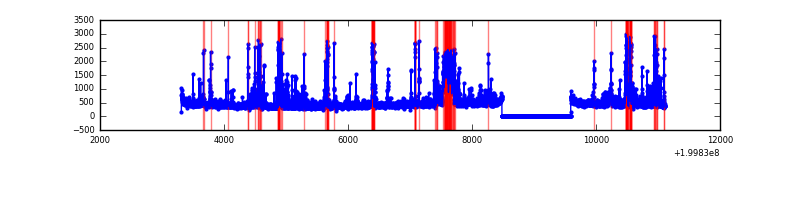 |
Top three noisy pixels from each quadrant. If the there are fewer than three noisy pixels in the level2.evt file, extra rows are filled as -1
| Pixel properties | Quadrant properties | ||||||
|---|---|---|---|---|---|---|---|
| Quadrant | DetID | PixID | Counts | Sigma | Mean | Median | Sigma |
| A | 8 | 15 | 48555 | 315.01 | 745 | 728 | 151.8 |
| A | 0 | 118 | 13026 | 81.0 | 745 | 728 | 151.8 |
| A | 0 | 226 | 9045 | 54.78 | 745 | 728 | 151.8 |
| B | 15 | 204 | 295172 | 2005.76 | 764 | 748 | 146.8 |
| B | 2 | 249 | 31291 | 208.07 | 764 | 748 | 146.8 |
| B | 4 | 80 | 19558 | 128.14 | 764 | 748 | 146.8 |
| C | 12 | 206 | 13528447 | 116404.45 | 495 | 496 | 116.2 |
| C | 1 | 192 | 41602 | 353.71 | 495 | 496 | 116.2 |
| C | 6 | 80 | 37838 | 321.32 | 495 | 496 | 116.2 |
| D | 13 | 120 | 530756 | 3099.68 | 704 | 683 | 171.0 |
| D | 13 | 223 | 235711 | 1374.36 | 704 | 683 | 171.0 |
| D | 5 | 233 | 85299 | 494.8 | 704 | 683 | 171.0 |
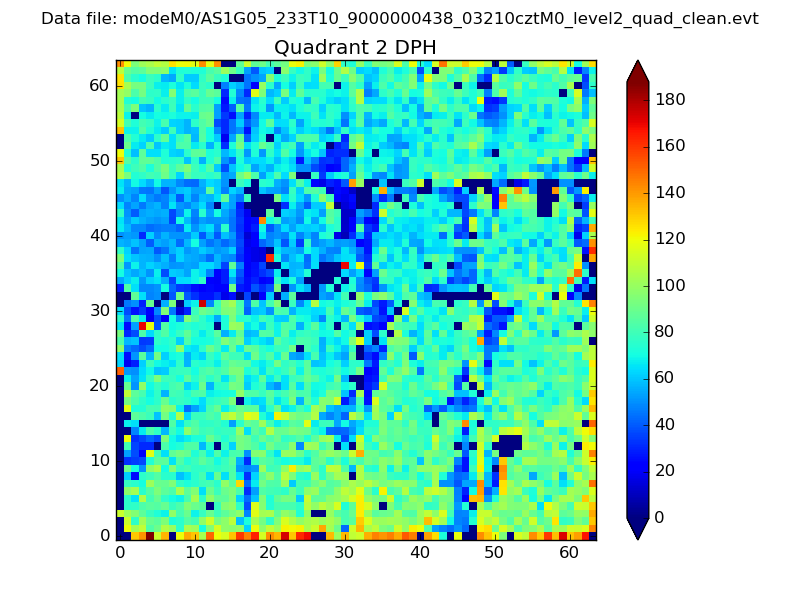
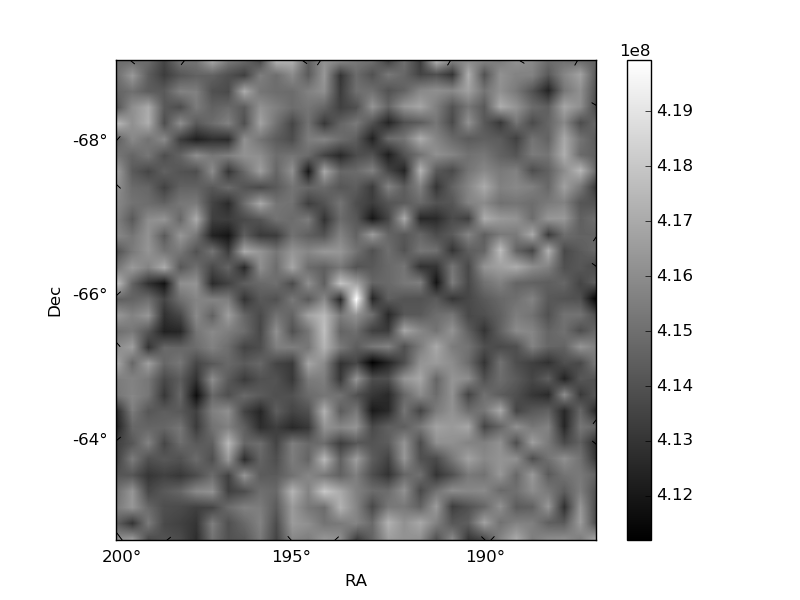
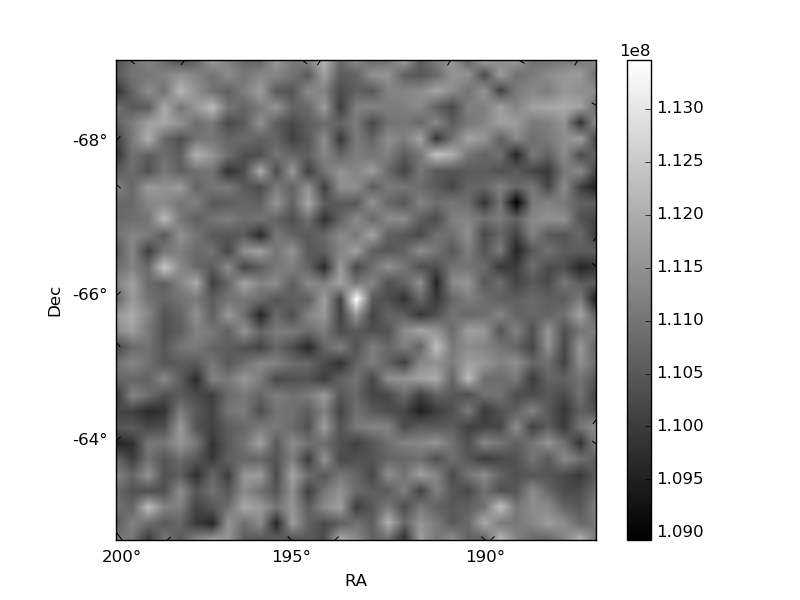
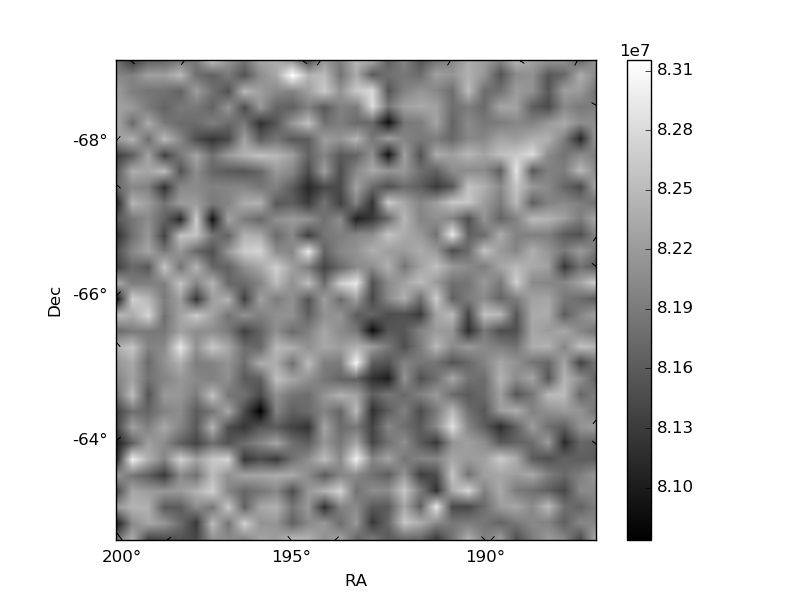
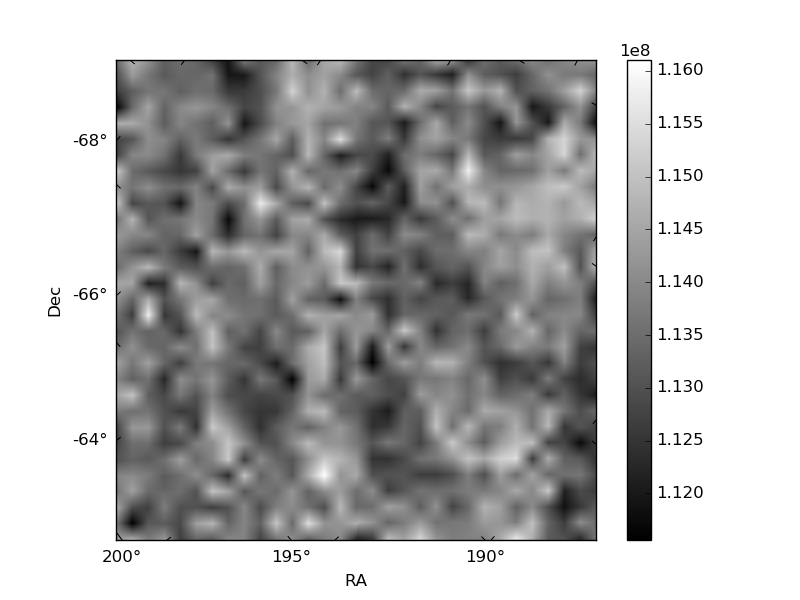
Histogram calculated using DETX and DETY for each event in the final _common_clean file
| Quadrant A | 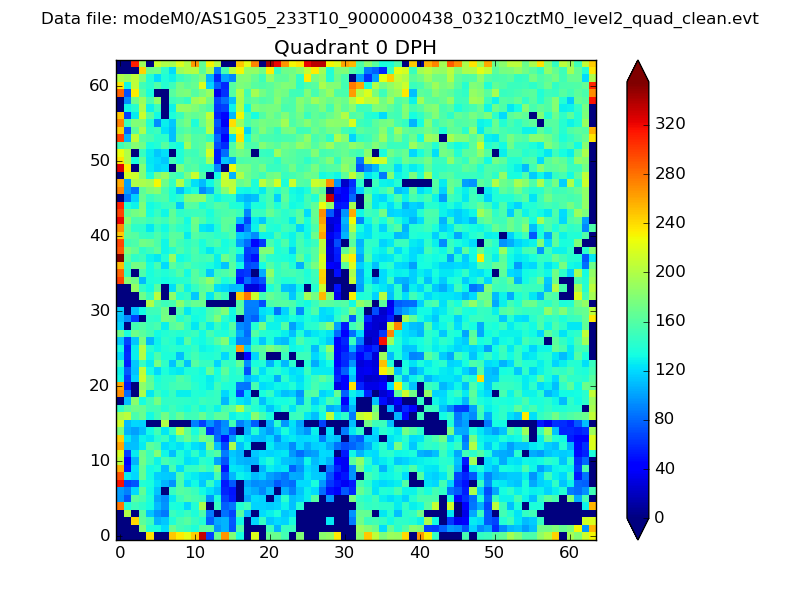 |
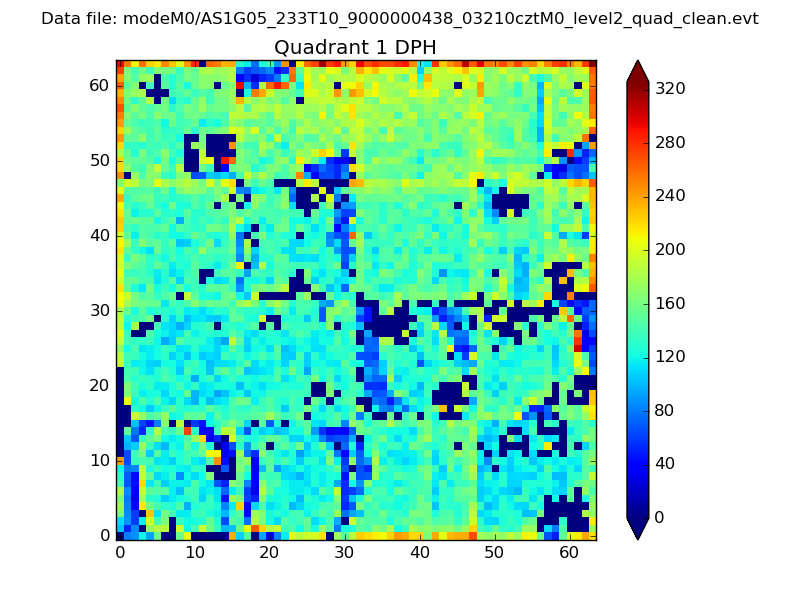 |
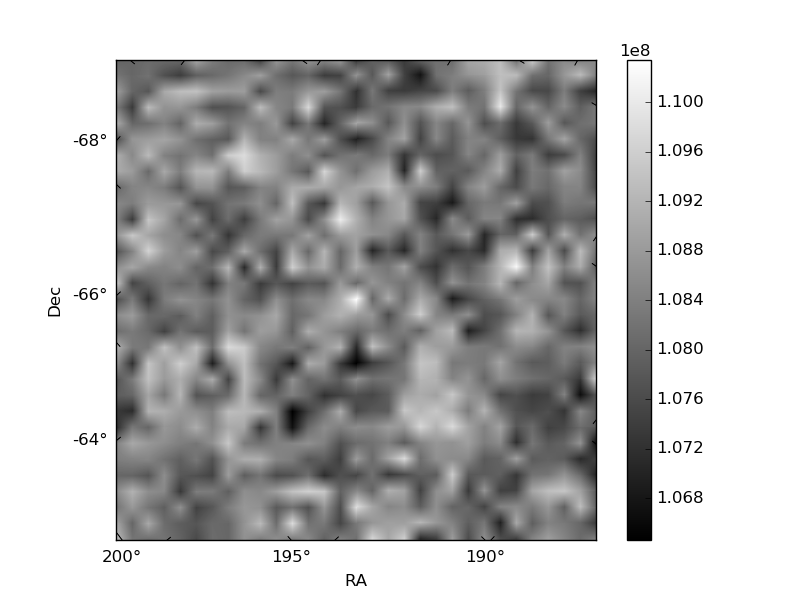
Quadrant B |
|---|---|---|---|
| Quadrant D | 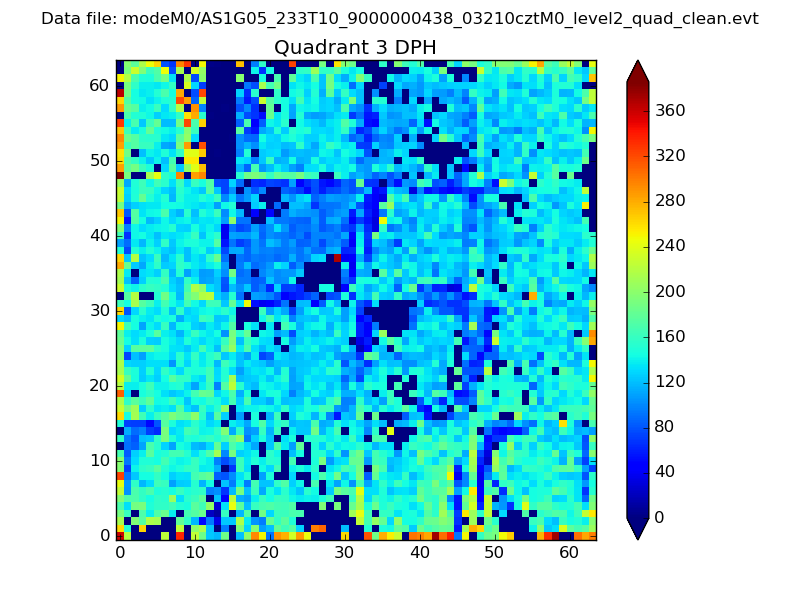 |
 |
Quadrant C |
| Plot type | Count rate plots | Images |
|---|---|---|
| Comparison with Poisson distribution Blue bars denote a histogram of data divided into 1 sec bins. Red curve is a Poisson curve with rate = median count rate of data. |
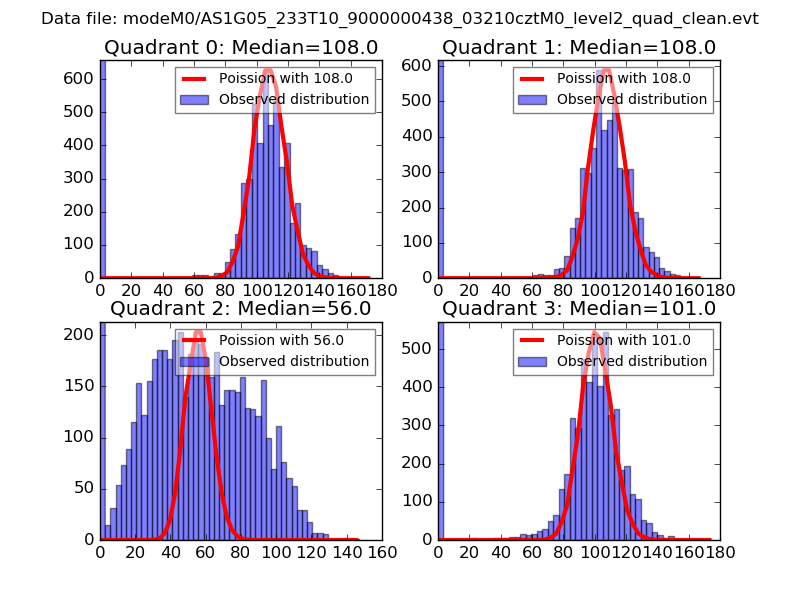 |
 |
| Quadrant-wise count rates Data is divided into 100 sec bins |
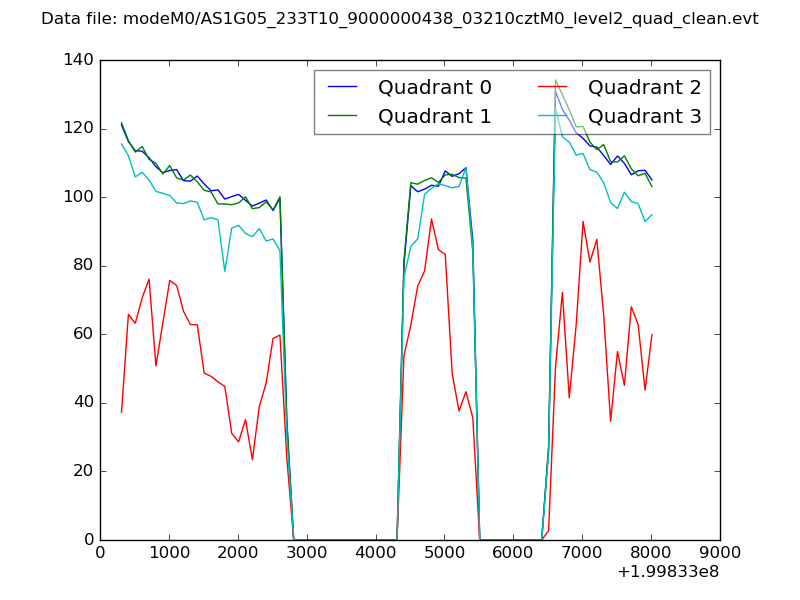 |
|
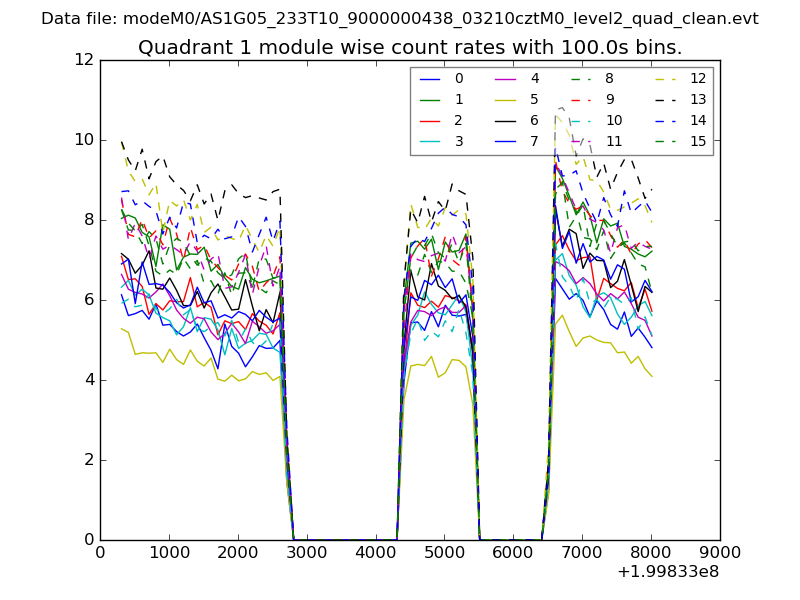
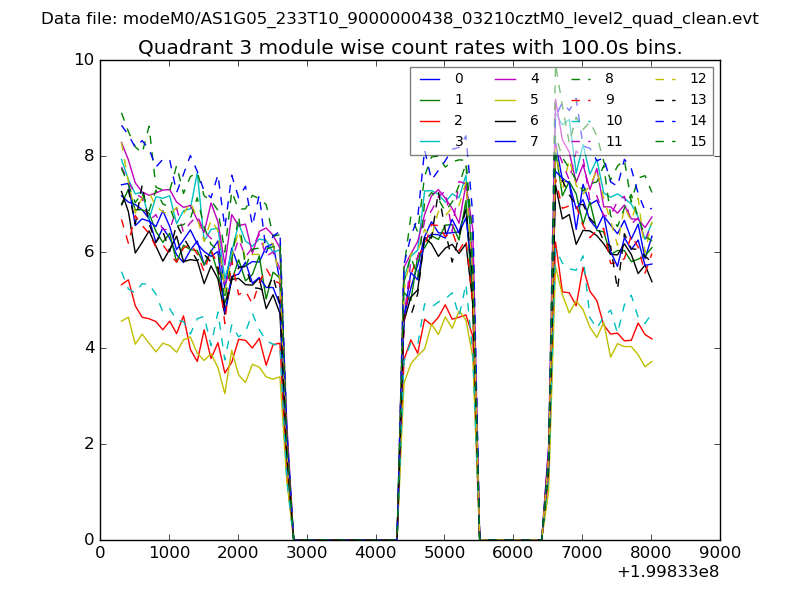
| Module-wise count rates for Quadrant A Data is divided into 100 sec bins |
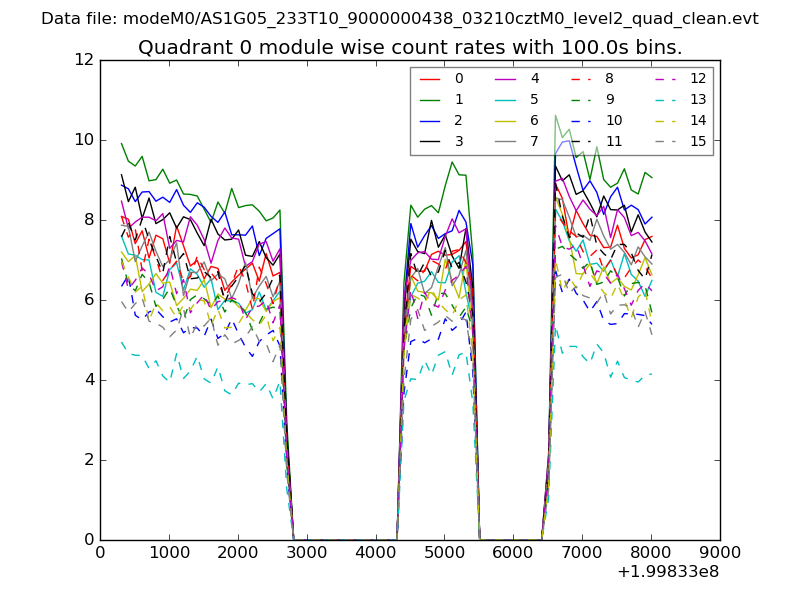 |
 |
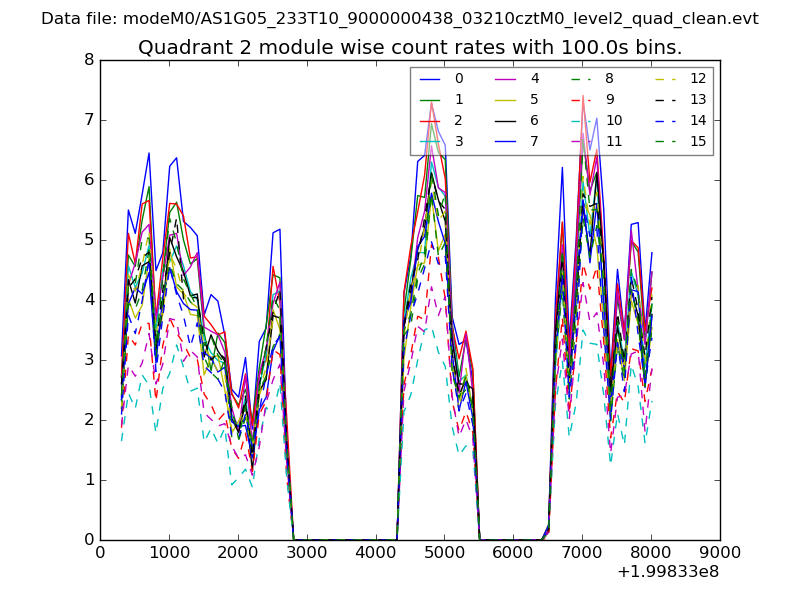
| Module-wise count rates for Quadrant B Data is divided into 100 sec bins |
 |
 |
| Module-wise count rates for Quadrant C Data is divided into 100 sec bins |
 |
 |
| Module-wise count rates for Quadrant D Data is divided into 100 sec bins |
 |
 |
| Parameter | Plot |
|---|---|
| CZT HV Monitor | 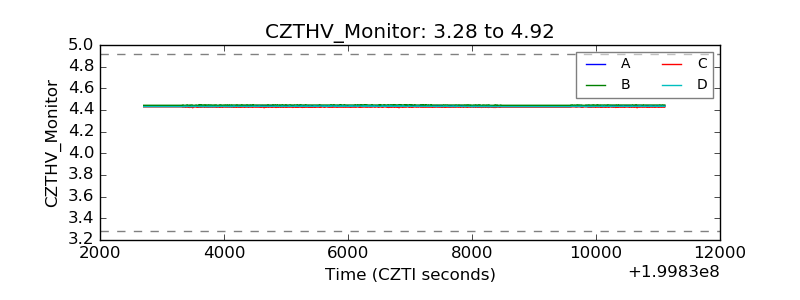 |
| D_VDD | 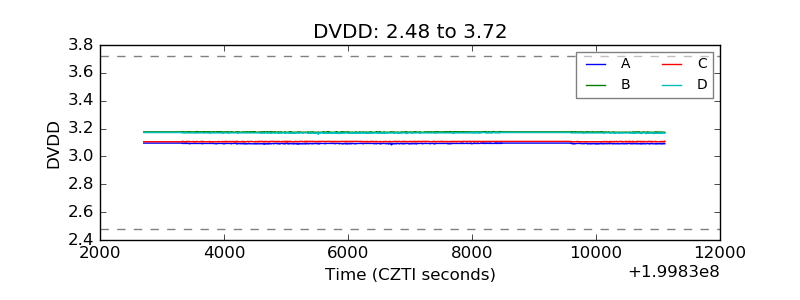 |
| Temperature 1 | 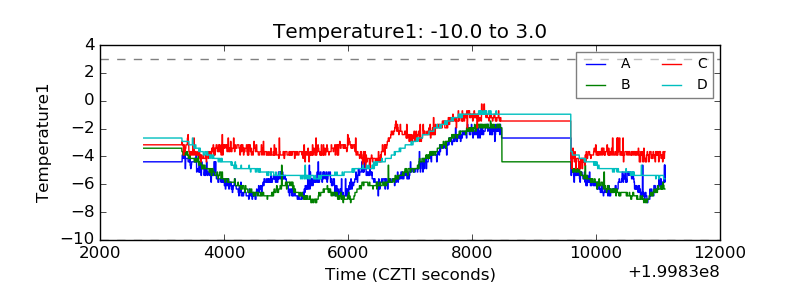 |
| Veto HV Monitor | 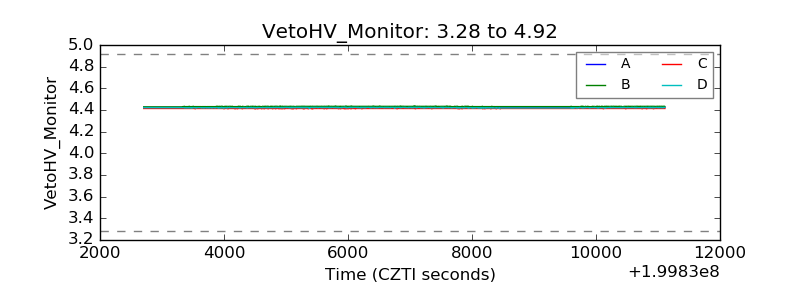 |
| Veto LLD | 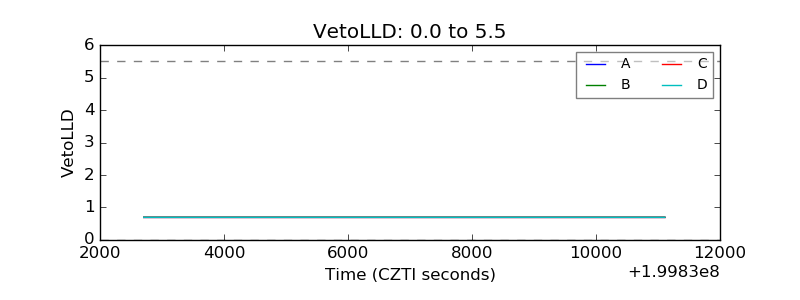 |
| Alpha Counter | 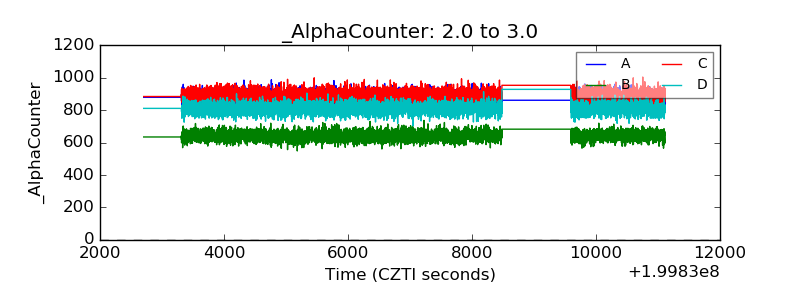 |
| _CPM_Rate | 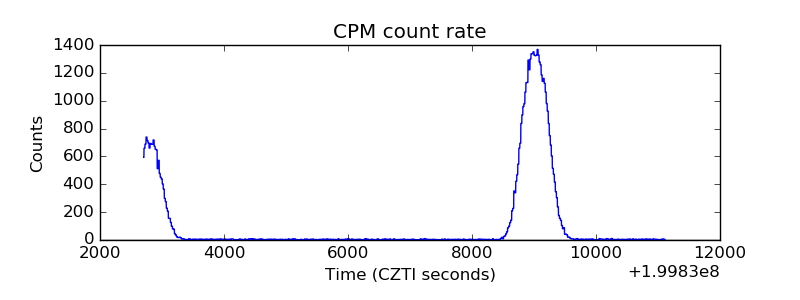 |
| CZT Counter |  |
| +2.5 Volts monitor | 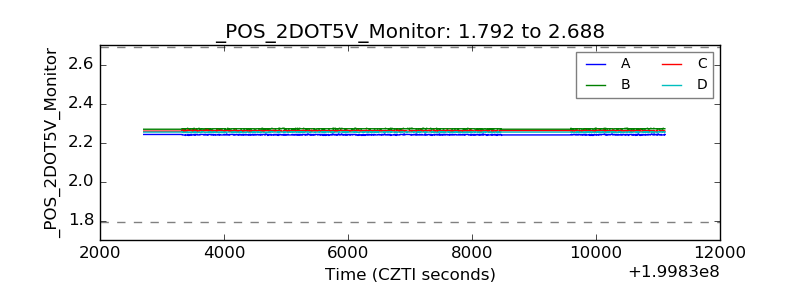 |
| +5 Volts monitor |  |
| Veto Counter |  |