| Param | Original file | Final file |
|---|---|---|
| Filename | modeM0/AS1G05_233T10_9000000438_03211cztM0_level2.evt | modeM0/AS1G05_233T10_9000000438_03211cztM0_level2_quad_clean.evt |
| Size (bytes) | 807,557,760 | 81,938,880 |
| Size | 770.1 MB | 78.1 MB |
| Events in quadrant A | 3,069,857 | 560,605 |
| Events in quadrant B | 3,832,686 | 564,720 |
| Events in quadrant C | 13,583,378 | 365,417 |
| Events in quadrant D | 3,522,481 | 525,991 |
| Mode M9 | |||
|---|---|---|---|
| Quadrant | BADHDUFLAG | Total packets | Discarded packets |
| A | 0 | 17 | 0 |
| B | 0 | 17 | 0 |
| C | 0 | 17 | 0 |
| D | 0 | 18 | 0 |
| Mode M0 | |||
|---|---|---|---|
| Quadrant | BADHDUFLAG | Total packets | Discarded packets |
| A | 0 | 13805 | 3 |
| B | 0 | 15760 | 2 |
| C | 0 | 44899 | 2 |
| D | 0 | 15183 | 2 |
| Mode SS | |||
|---|---|---|---|
| Quadrant | BADHDUFLAG | Total packets | Discarded packets |
| A | 0 | 136 | 0 |
| B | 0 | 136 | 0 |
| C | 0 | 136 | 0 |
| D | 0 | 136 | 0 |
| Quadrant | Total seconds | Saturated seconds | Saturation percentage |
|---|---|---|---|
| A | 6637 | 20 | 0.301341% |
| B | 6637 | 53 | 0.798554% |
| C | 6637 | 3809 | 57.390387% |
| D | 6637 | 95 | 1.431370% |
Noise dominated data is calculated using 1-second bins in cleaned event files. If a bin has >2000 counts, and if more than 50% of those come from <1% of pixels, then it is considered to be noise-dominated and hence unusable.
| Quadrant | # 1 sec bins | Bins with >0 counts | Bins with >2000 counts | High rate bins dominated by noise | Noise dominated (total time) | Noise dominated (detector-on time) | Marked lightcurve |
|---|---|---|---|---|---|---|---|
| A | 7812 | 6638 | 2 | 2 | 0.03% | 0.03% | 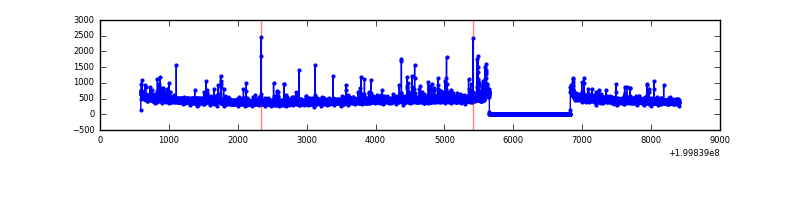 |
| B | 7812 | 6637 | 7 | 7 | 0.09% | 0.11% |  |
| C | 7812 | 6637 | 3899 | 3899 | 49.91% | 58.75% | 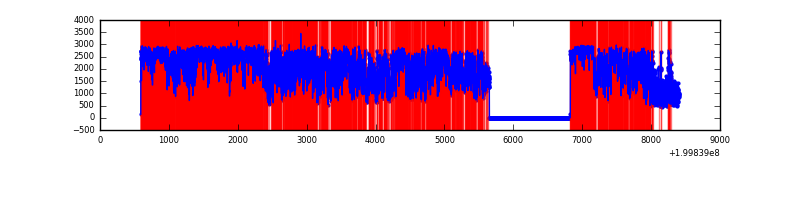 |
| D | 7812 | 6638 | 87 | 87 | 1.11% | 1.31% | 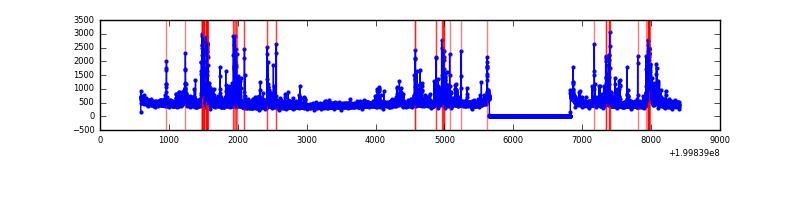 |
Top three noisy pixels from each quadrant. If the there are fewer than three noisy pixels in the level2.evt file, extra rows are filled as -1
| Pixel properties | Quadrant properties | ||||||
|---|---|---|---|---|---|---|---|
| Quadrant | DetID | PixID | Counts | Sigma | Mean | Median | Sigma |
| A | 8 | 15 | 116297 | 754.79 | 755 | 740 | 153.1 |
| A | 0 | 118 | 31157 | 198.68 | 755 | 740 | 153.1 |
| A | 0 | 226 | 10786 | 65.62 | 755 | 740 | 153.1 |
| B | 15 | 204 | 701840 | 4765.36 | 777 | 758 | 147.1 |
| B | 2 | 249 | 38414 | 255.95 | 777 | 758 | 147.1 |
| B | 0 | 229 | 26644 | 175.95 | 777 | 758 | 147.1 |
| C | 12 | 206 | 10467016 | 79063.82 | 568 | 571 | 132.4 |
| C | 1 | 192 | 846548 | 6390.53 | 568 | 571 | 132.4 |
| C | 2 | 53 | 16506 | 120.37 | 568 | 571 | 132.4 |
| D | 13 | 223 | 228842 | 1300.07 | 725 | 702 | 175.5 |
| D | 12 | 16 | 217668 | 1236.4 | 725 | 702 | 175.5 |
| D | 13 | 120 | 157937 | 896.01 | 725 | 702 | 175.5 |
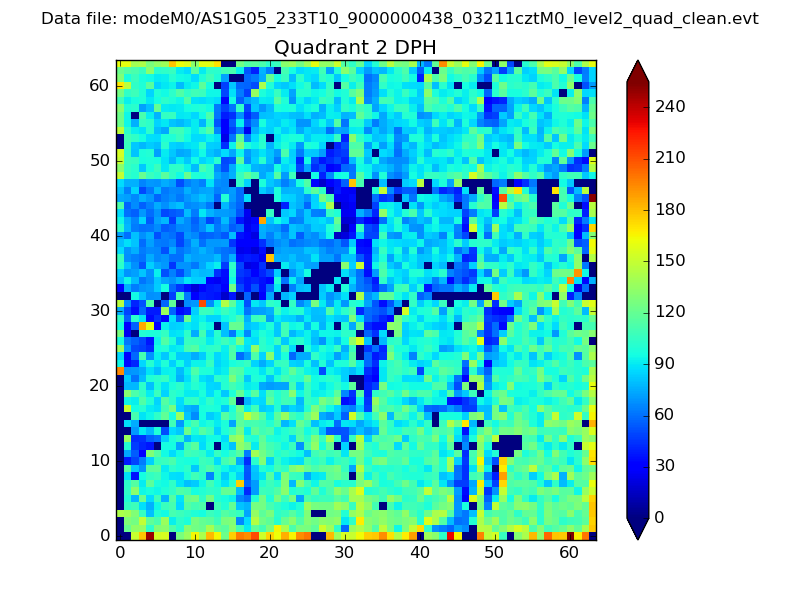
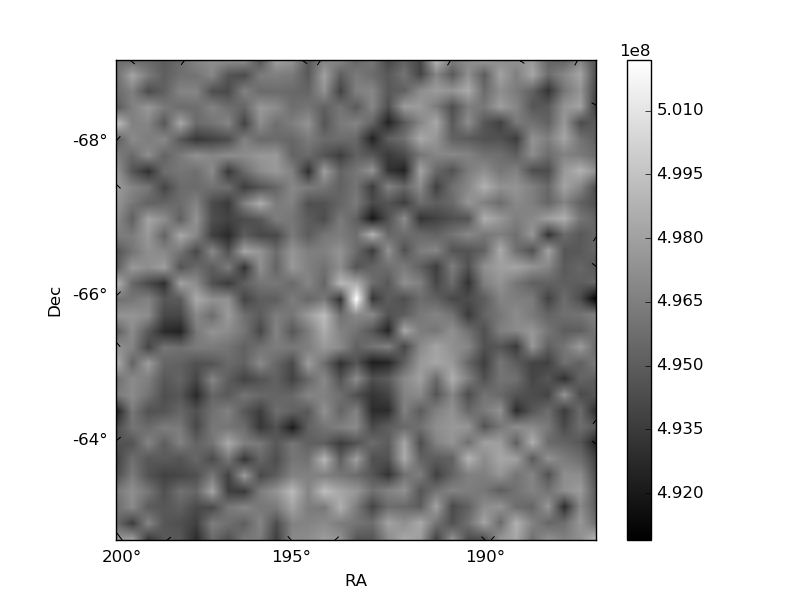
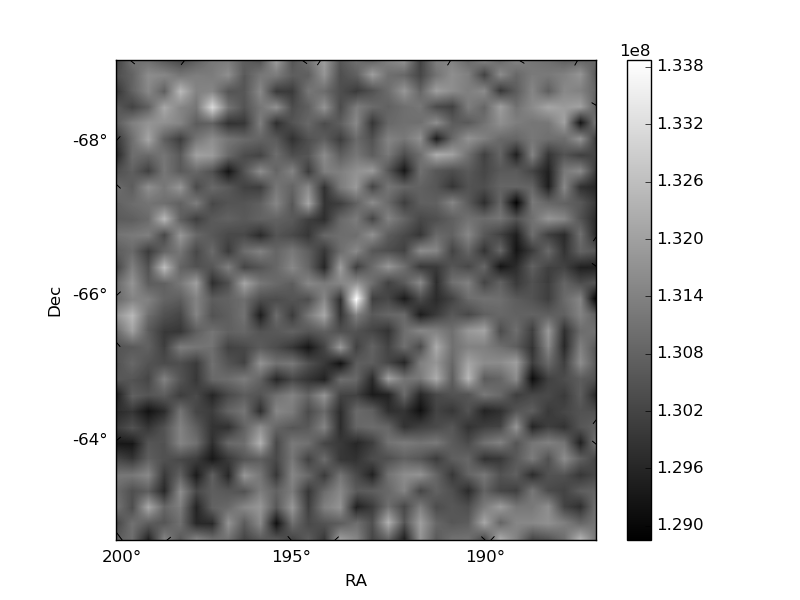
Histogram calculated using DETX and DETY for each event in the final _common_clean file
| Quadrant A | 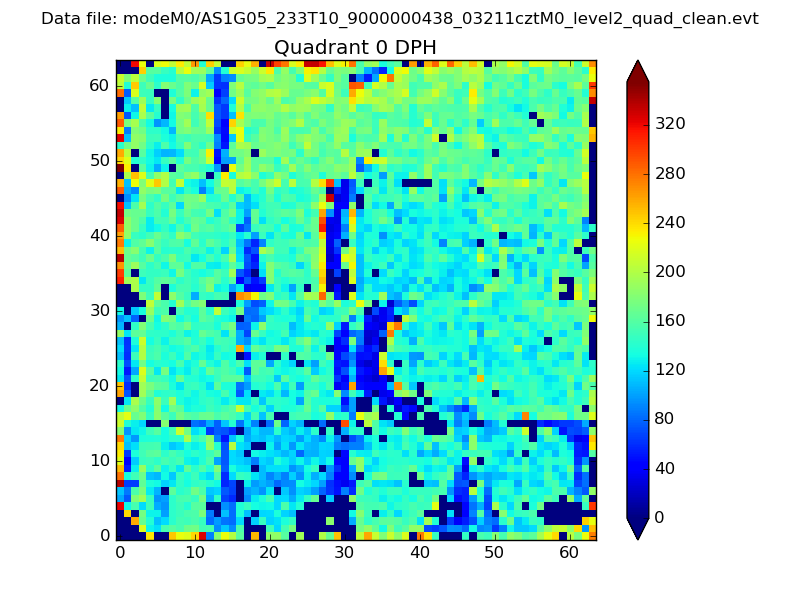 |
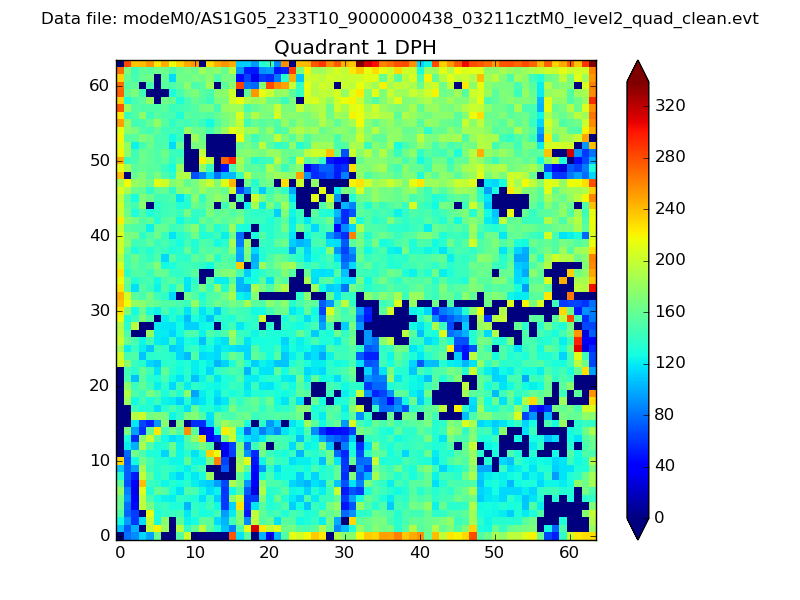 |
Quadrant B |
|---|---|---|---|
| Quadrant D | 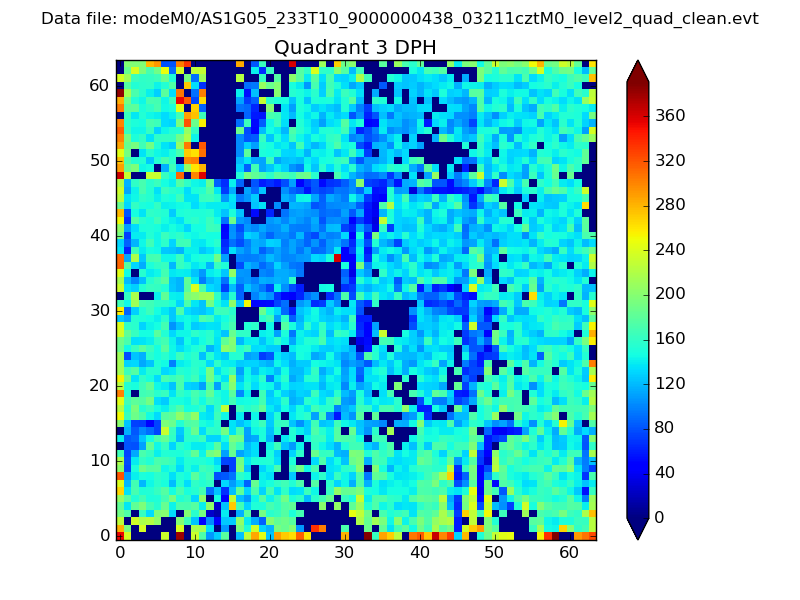 |
 |
Quadrant C |
| Plot type | Count rate plots | Images |
|---|---|---|
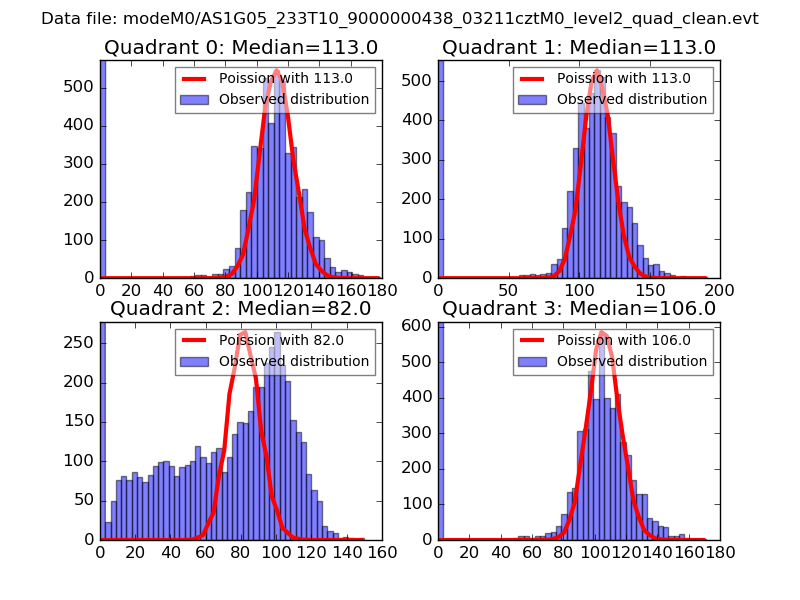
| Comparison with Poisson distribution Blue bars denote a histogram of data divided into 1 sec bins. Red curve is a Poisson curve with rate = median count rate of data. |
 |
 |
| Quadrant-wise count rates Data is divided into 100 sec bins |
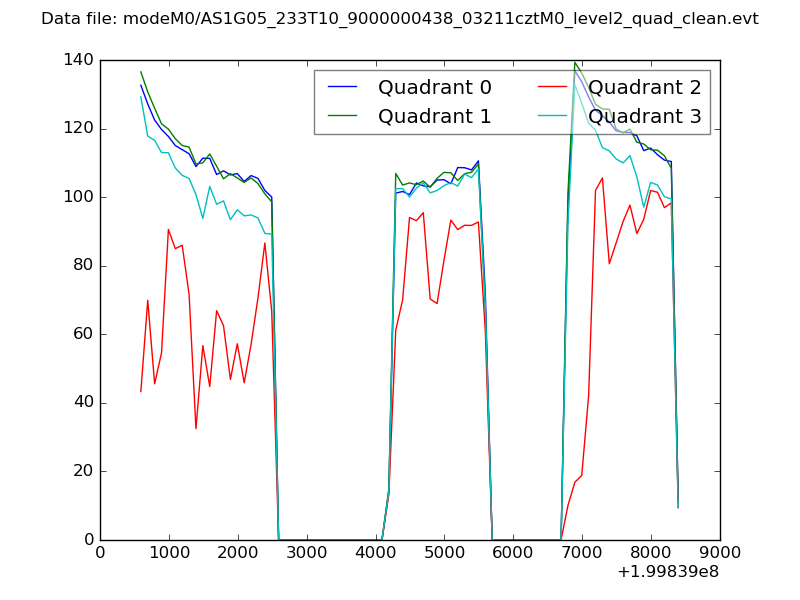 |
|
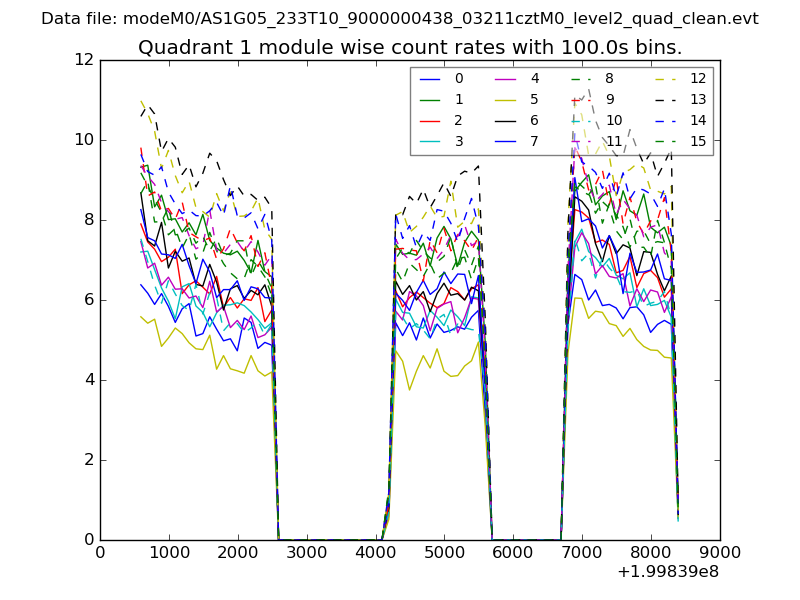
| Module-wise count rates for Quadrant A Data is divided into 100 sec bins |
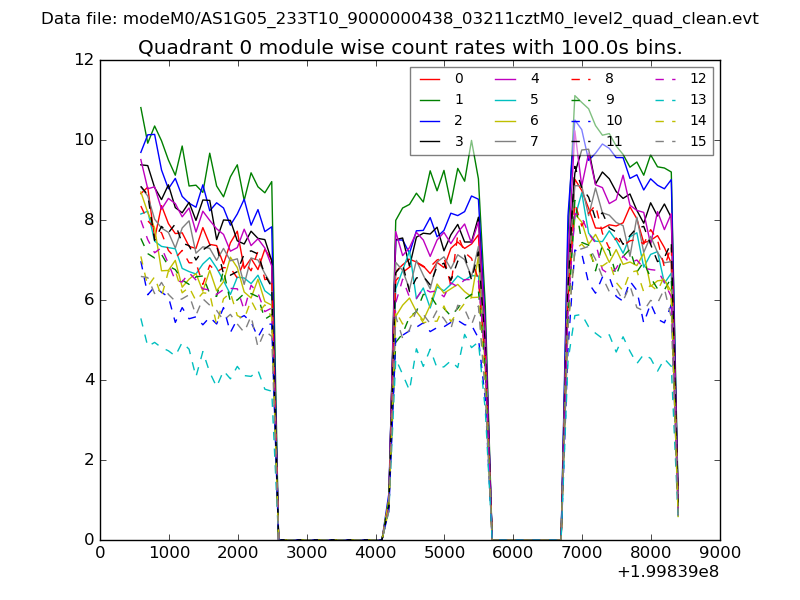 |
 |
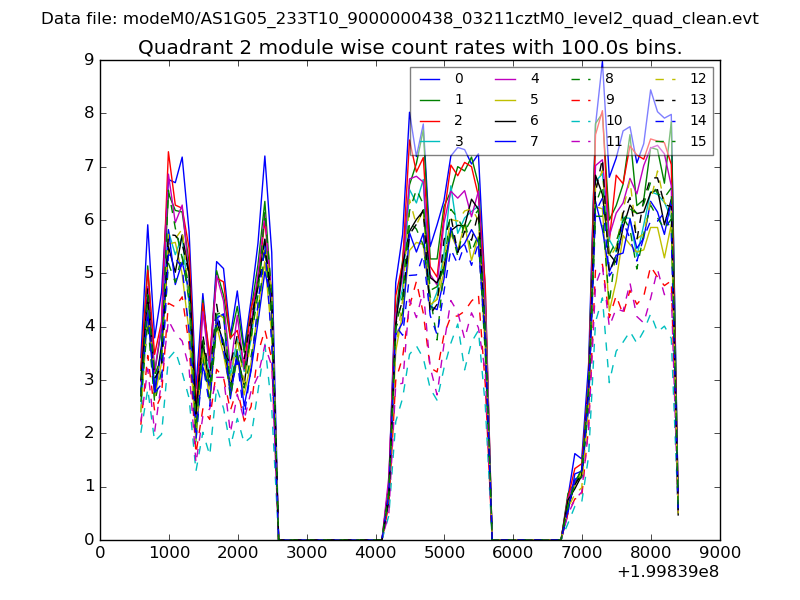
| Module-wise count rates for Quadrant B Data is divided into 100 sec bins |
 |
 |
| Module-wise count rates for Quadrant C Data is divided into 100 sec bins |
 |
 |
| Module-wise count rates for Quadrant D Data is divided into 100 sec bins |
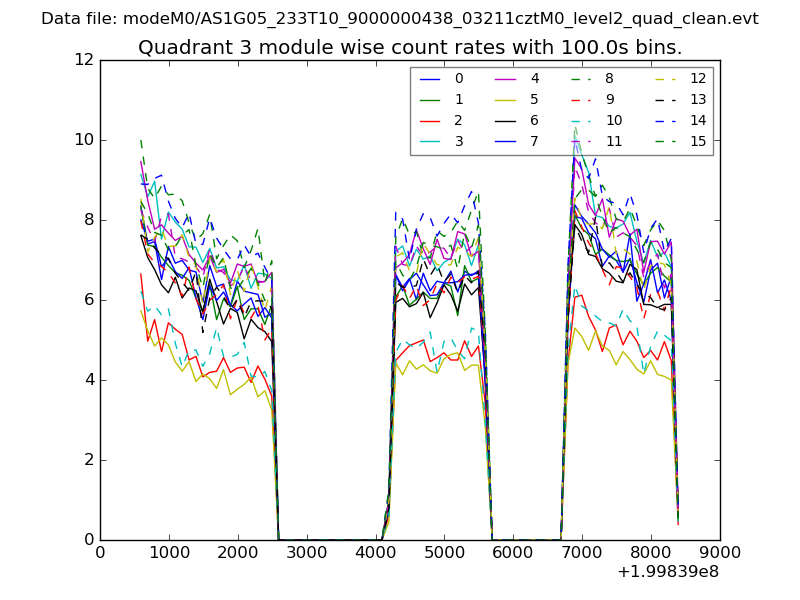 |
 |
| Parameter | Plot |
|---|---|
| CZT HV Monitor | 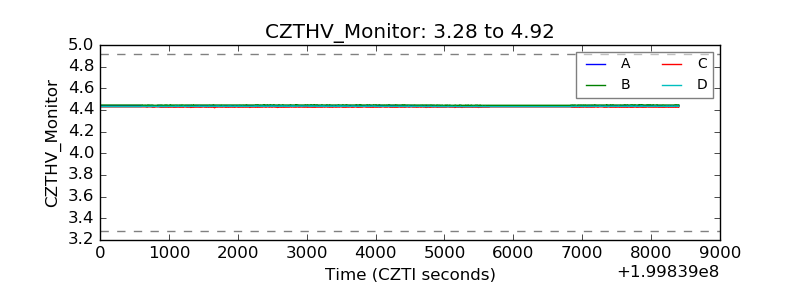 |
| D_VDD | 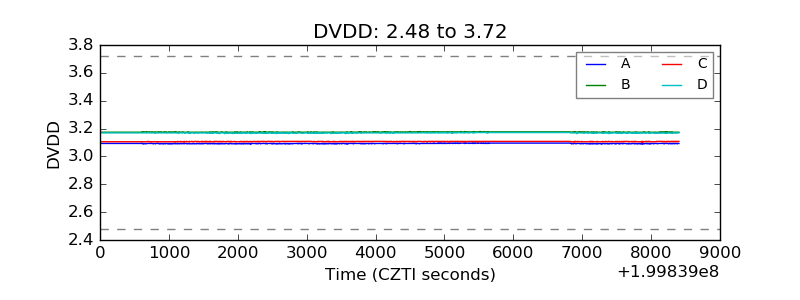 |
| Temperature 1 | 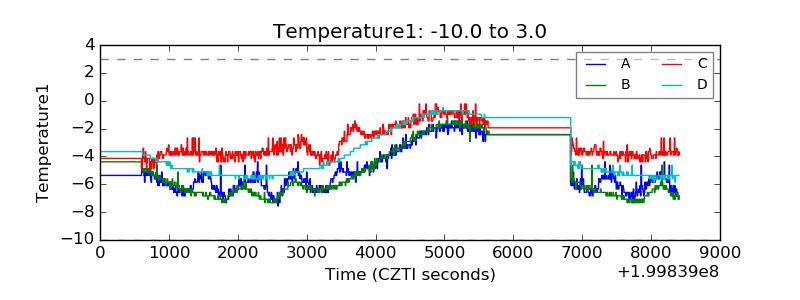 |
| Veto HV Monitor | 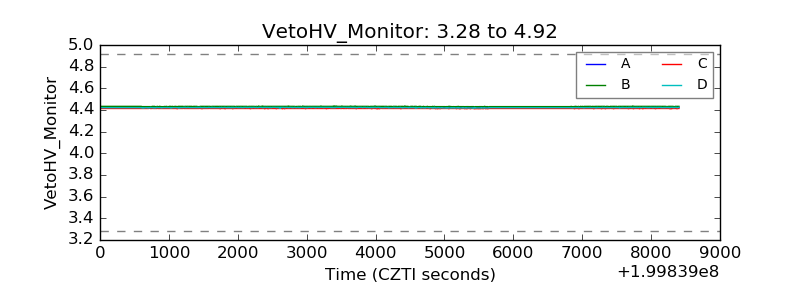 |
| Veto LLD | 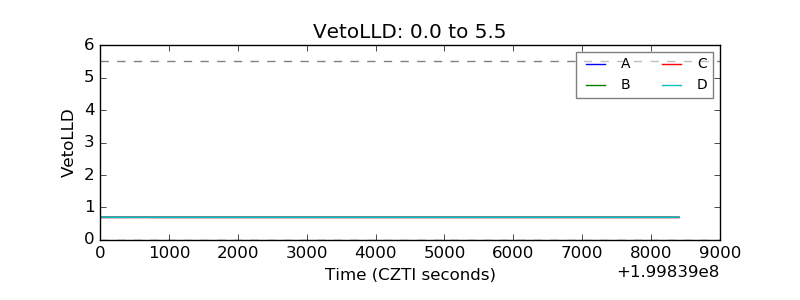 |
| Alpha Counter | 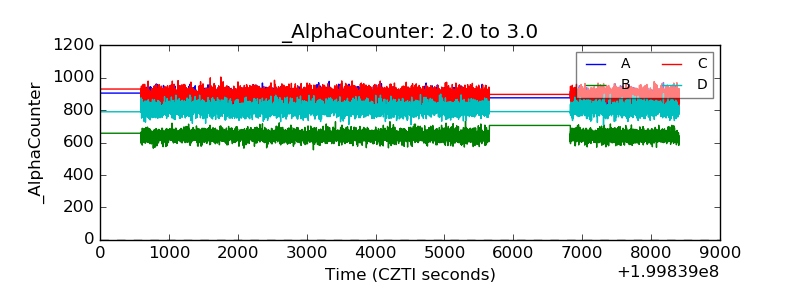 |
| _CPM_Rate | 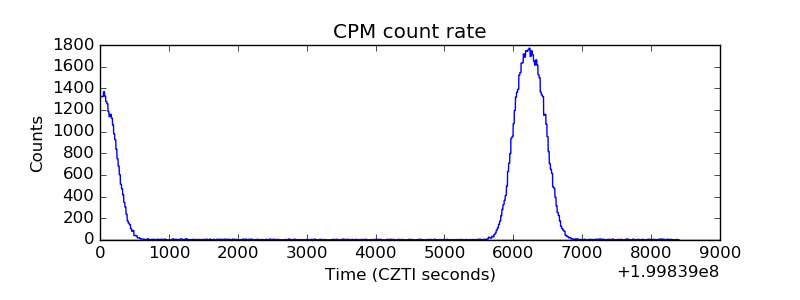 |
| CZT Counter | 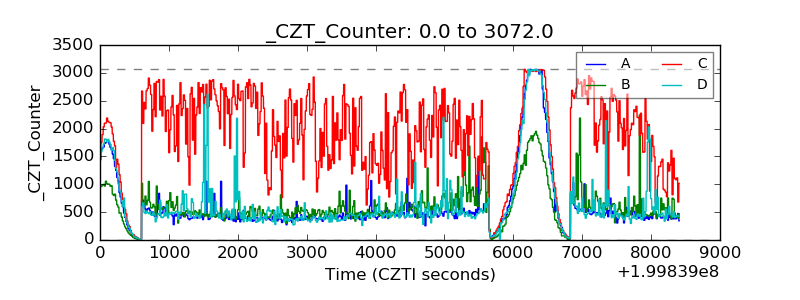 |
| +2.5 Volts monitor | 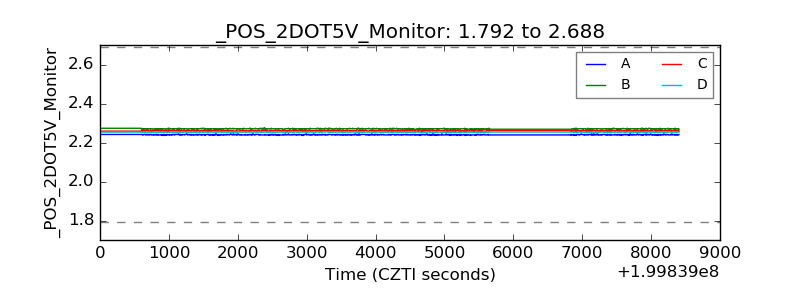 |
| +5 Volts monitor |  |
| Veto Counter | 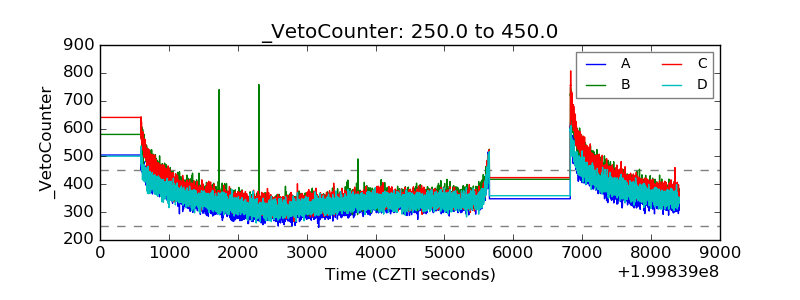 |