| Param | Original file | Final file |
|---|---|---|
| Filename | modeM0/AS1G05_233T10_9000000438_03212cztM0_level2.evt | modeM0/AS1G05_233T10_9000000438_03212cztM0_level2_quad_clean.evt |
| Size (bytes) | 776,566,080 | 80,501,760 |
| Size | 740.6 MB | 76.8 MB |
| Events in quadrant A | 3,047,219 | 535,161 |
| Events in quadrant B | 3,780,688 | 544,910 |
| Events in quadrant C | 12,666,171 | 389,610 |
| Events in quadrant D | 3,579,141 | 507,308 |
| Mode M9 | |||
|---|---|---|---|
| Quadrant | BADHDUFLAG | Total packets | Discarded packets |
| A | 0 | 17 | 0 |
| B | 0 | 17 | 0 |
| C | 0 | 17 | 0 |
| D | 0 | 18 | 0 |
| Mode M0 | |||
|---|---|---|---|
| Quadrant | BADHDUFLAG | Total packets | Discarded packets |
| A | 0 | 13544 | 3 |
| B | 0 | 15458 | 2 |
| C | 0 | 42145 | 2 |
| D | 0 | 15198 | 2 |
| Mode SS | |||
|---|---|---|---|
| Quadrant | BADHDUFLAG | Total packets | Discarded packets |
| A | 0 | 134 | 0 |
| B | 0 | 134 | 0 |
| C | 0 | 134 | 0 |
| D | 0 | 134 | 0 |
| Quadrant | Total seconds | Saturated seconds | Saturation percentage |
|---|---|---|---|
| A | 6589 | 31 | 0.470481% |
| B | 6589 | 102 | 1.548035% |
| C | 6589 | 3274 | 49.688875% |
| D | 6589 | 96 | 1.456974% |
Noise dominated data is calculated using 1-second bins in cleaned event files. If a bin has >2000 counts, and if more than 50% of those come from <1% of pixels, then it is considered to be noise-dominated and hence unusable.
| Quadrant | # 1 sec bins | Bins with >0 counts | Bins with >2000 counts | High rate bins dominated by noise | Noise dominated (total time) | Noise dominated (detector-on time) | Marked lightcurve |
|---|---|---|---|---|---|---|---|
| A | 7819 | 6590 | 0 | 0 | 0.00% | 0.00% | 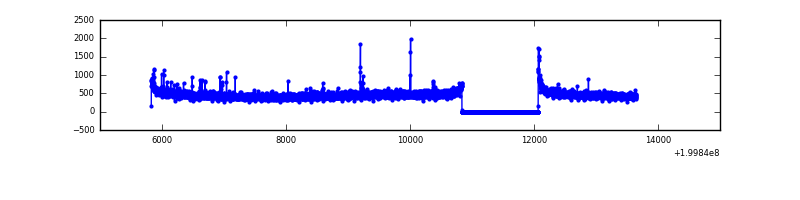 |
| B | 7819 | 6589 | 33 | 33 | 0.42% | 0.50% | 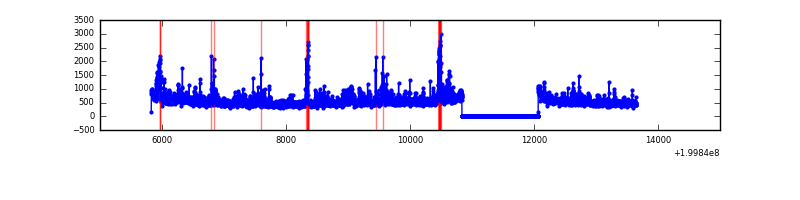 |
| C | 7819 | 6589 | 3369 | 3369 | 43.09% | 51.13% | 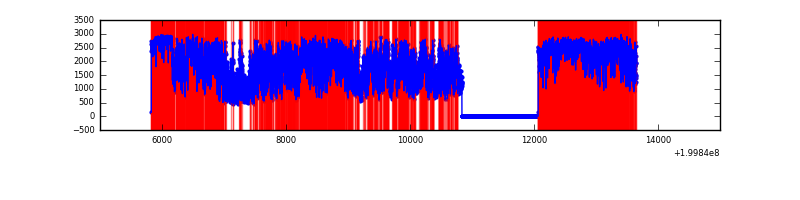 |
| D | 7819 | 6590 | 69 | 69 | 0.88% | 1.05% | 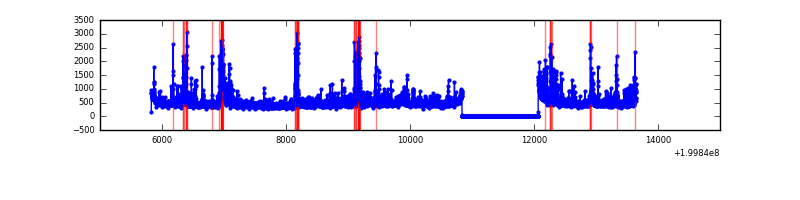 |
Top three noisy pixels from each quadrant. If the there are fewer than three noisy pixels in the level2.evt file, extra rows are filled as -1
| Pixel properties | Quadrant properties | ||||||
|---|---|---|---|---|---|---|---|
| Quadrant | DetID | PixID | Counts | Sigma | Mean | Median | Sigma |
| A | 8 | 15 | 17751 | 107.75 | 776 | 761 | 157.7 |
| A | 0 | 199 | 17313 | 104.98 | 776 | 761 | 157.7 |
| A | 7 | 16 | 11340 | 67.09 | 776 | 761 | 157.7 |
| B | 15 | 204 | 508345 | 3352.39 | 798 | 780 | 151.4 |
| B | 2 | 249 | 77582 | 507.27 | 798 | 780 | 151.4 |
| B | 8 | 128 | 66059 | 431.16 | 798 | 780 | 151.4 |
| C | 12 | 206 | 8665663 | 60296.73 | 626 | 630 | 143.7 |
| C | 1 | 192 | 1481472 | 10304.63 | 626 | 630 | 143.7 |
| C | 6 | 80 | 31946 | 217.92 | 626 | 630 | 143.7 |
| D | 13 | 223 | 316035 | 1767.16 | 749 | 729 | 178.4 |
| D | 12 | 16 | 128694 | 717.19 | 749 | 729 | 178.4 |
| D | 13 | 120 | 112177 | 624.62 | 749 | 729 | 178.4 |
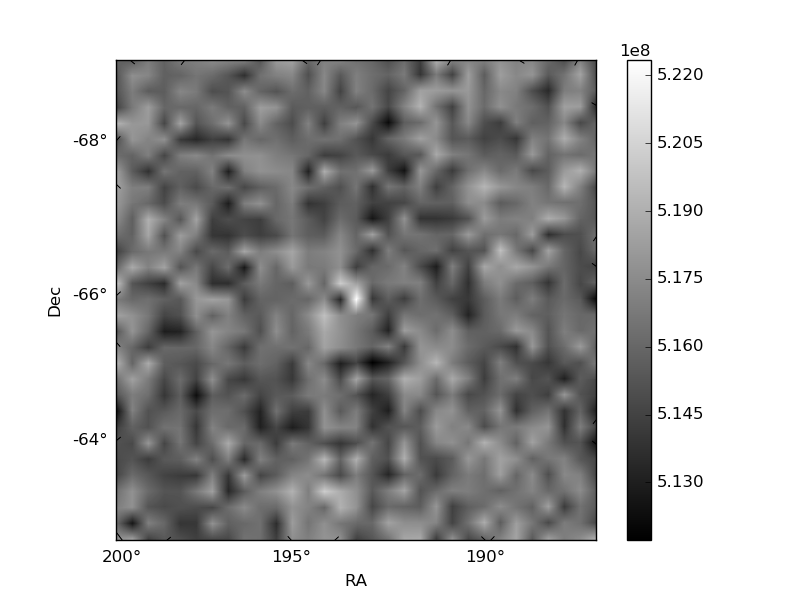
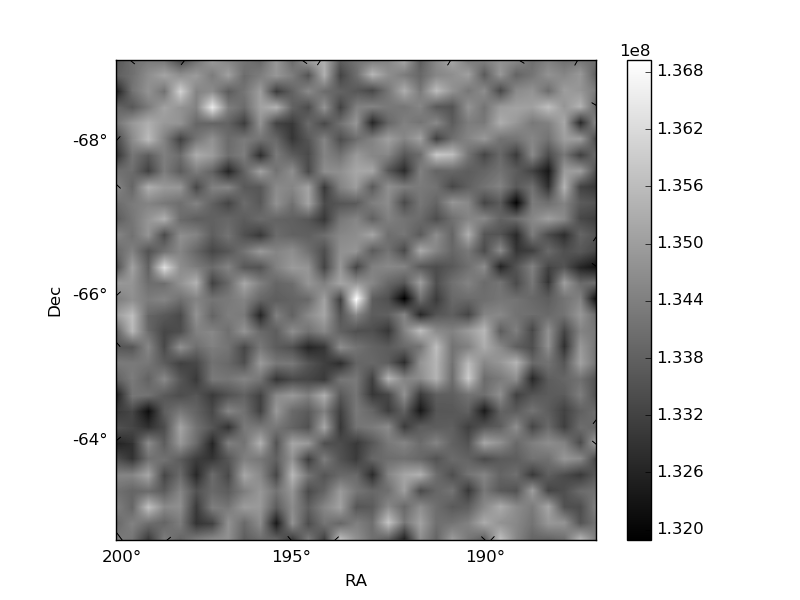
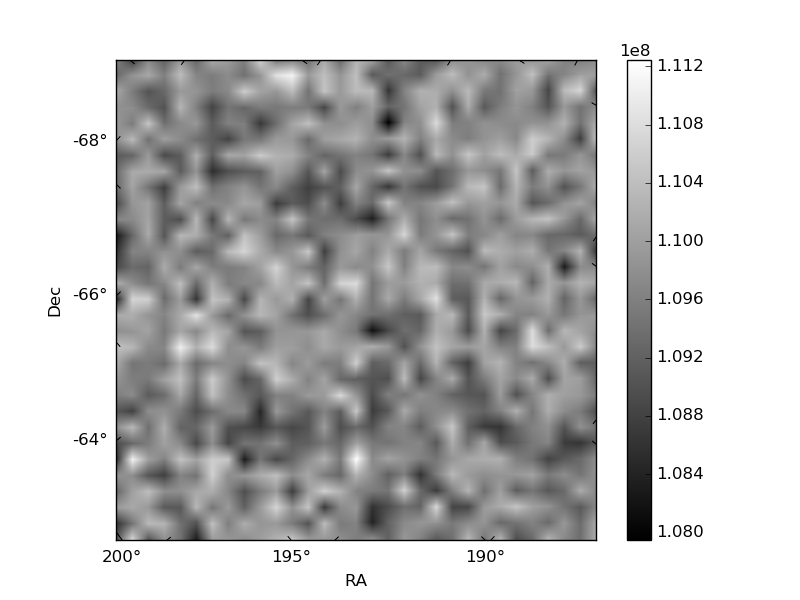
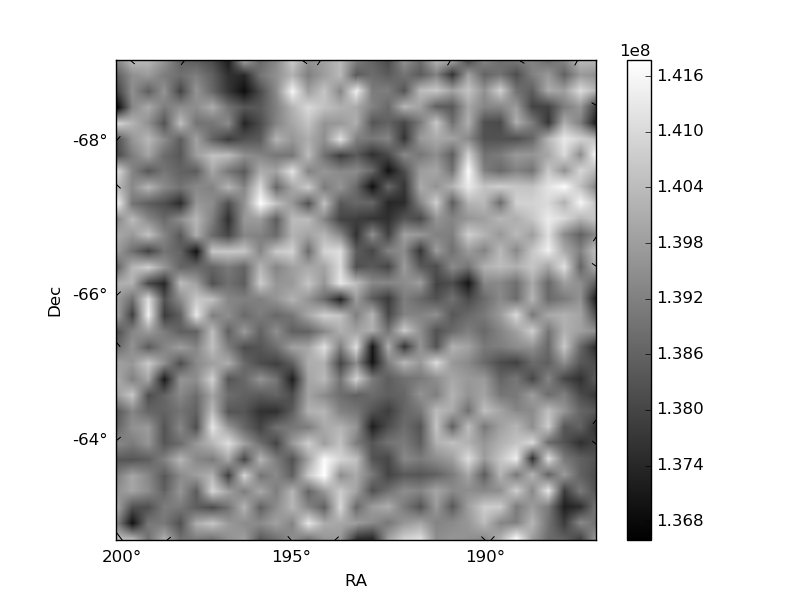
Histogram calculated using DETX and DETY for each event in the final _common_clean file
| Quadrant A | 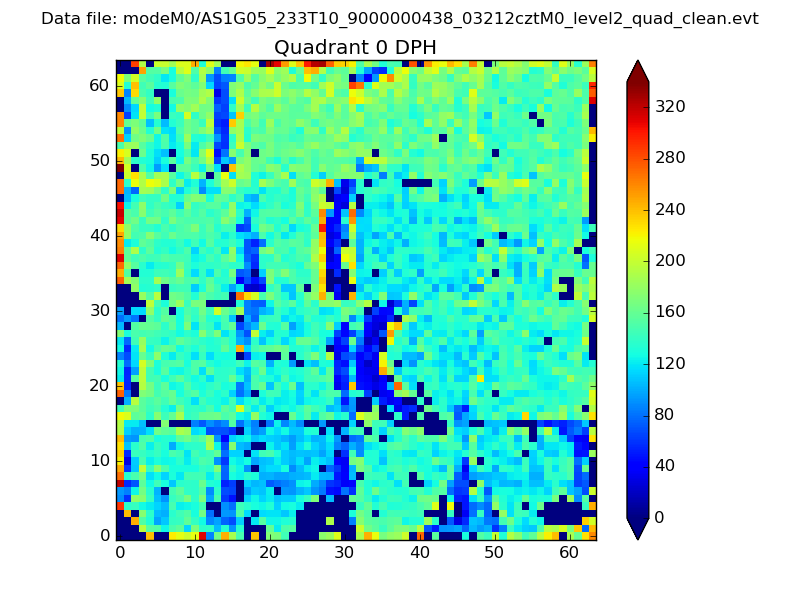 |
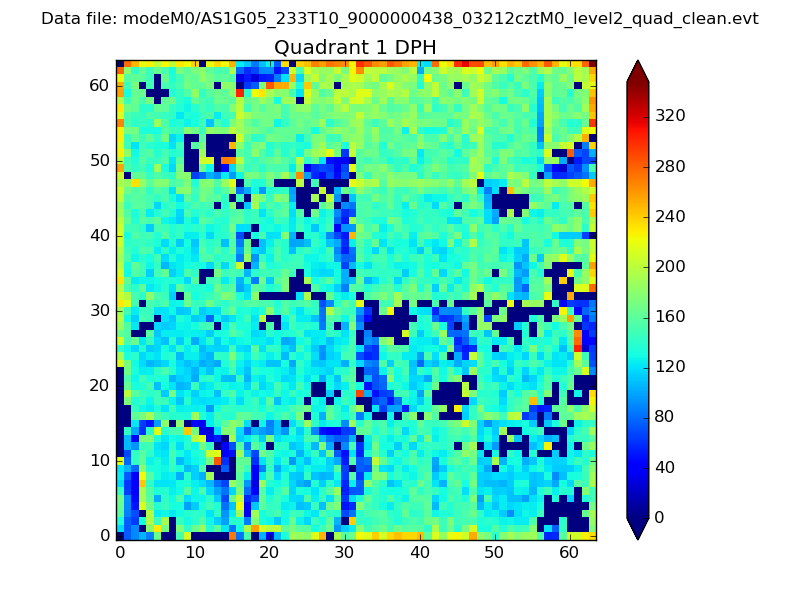 |
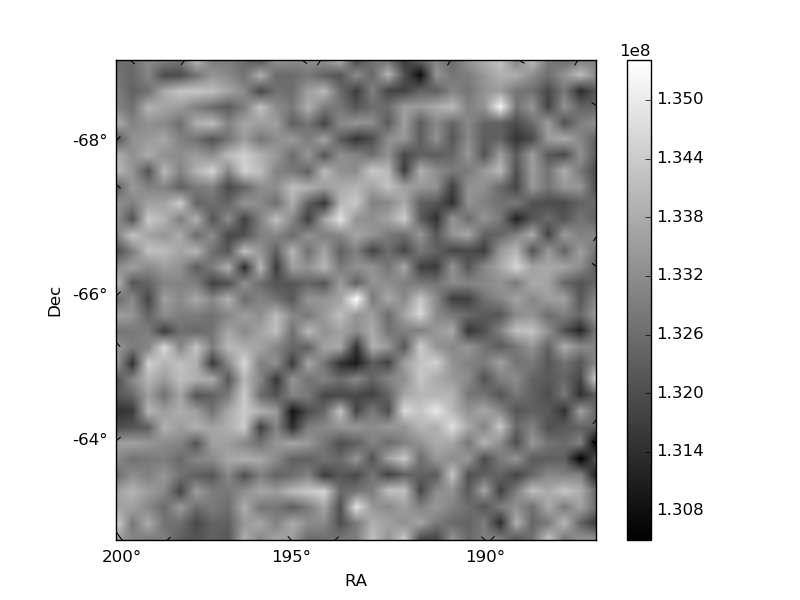
Quadrant B |
|---|---|---|---|
| Quadrant D | 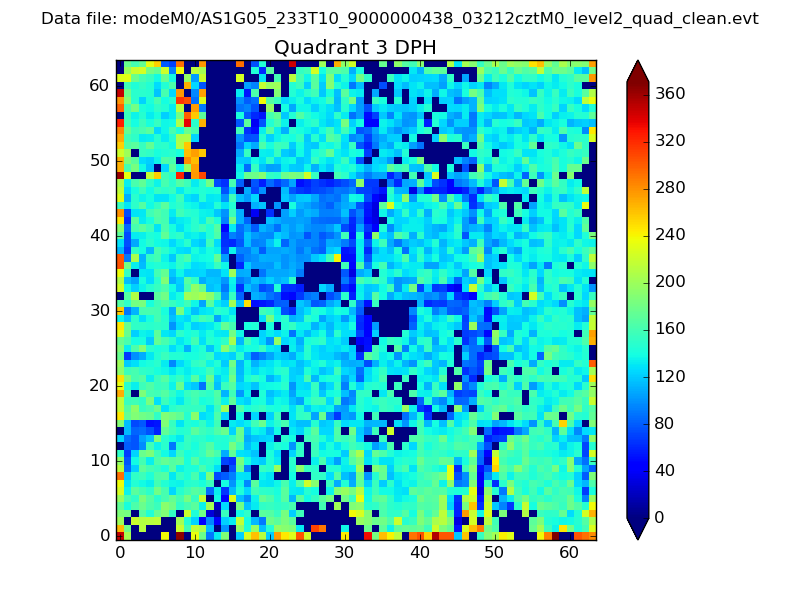 |
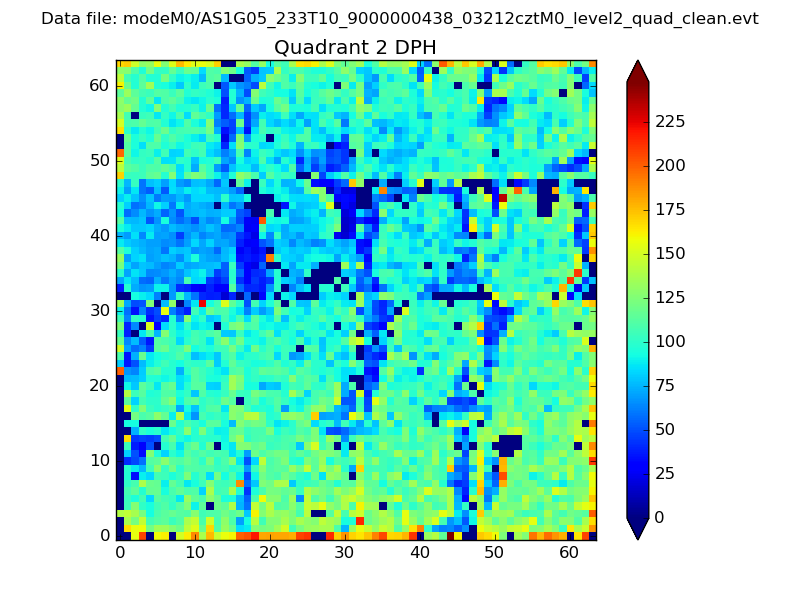 |
Quadrant C |
| Plot type | Count rate plots | Images |
|---|---|---|
| Comparison with Poisson distribution Blue bars denote a histogram of data divided into 1 sec bins. Red curve is a Poisson curve with rate = median count rate of data. |
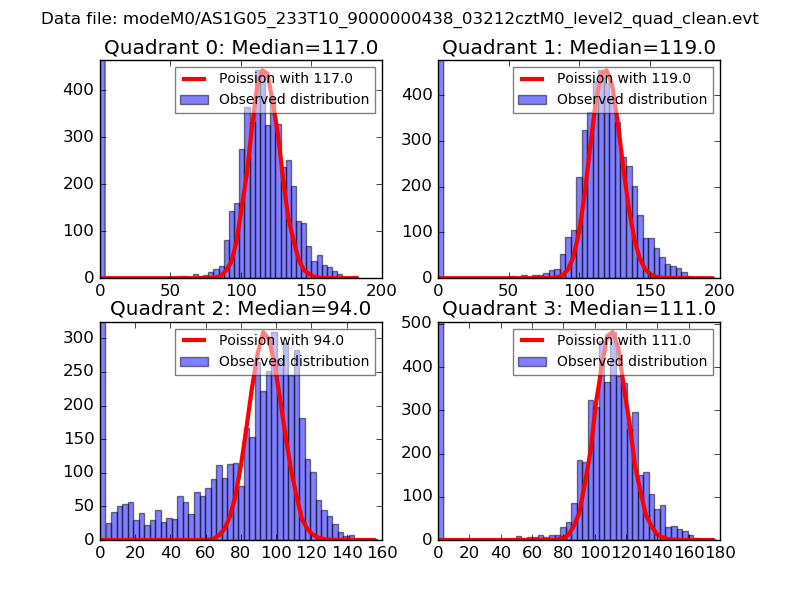 |
 |
| Quadrant-wise count rates Data is divided into 100 sec bins |
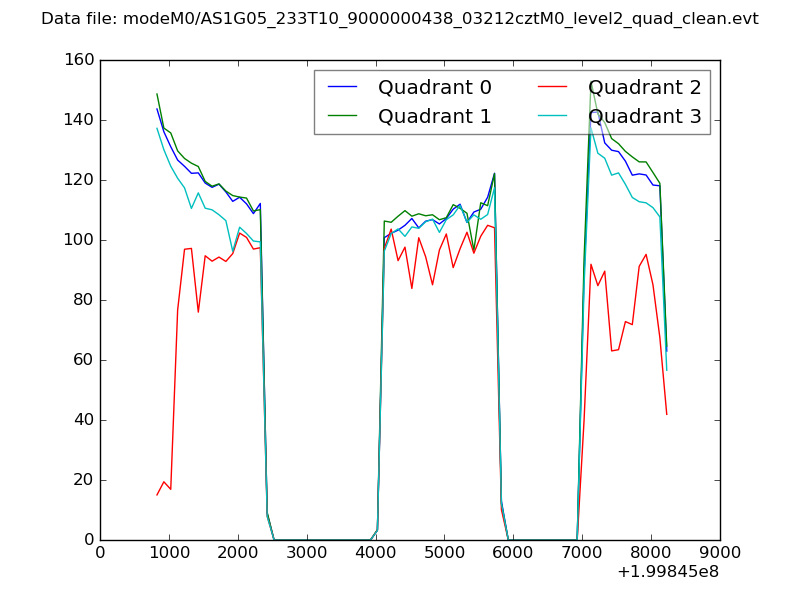 |
|
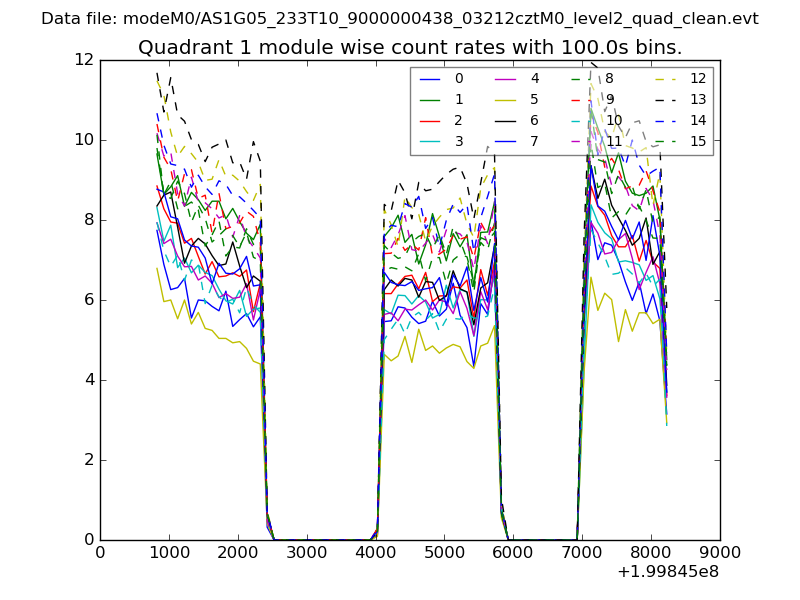
| Module-wise count rates for Quadrant A Data is divided into 100 sec bins |
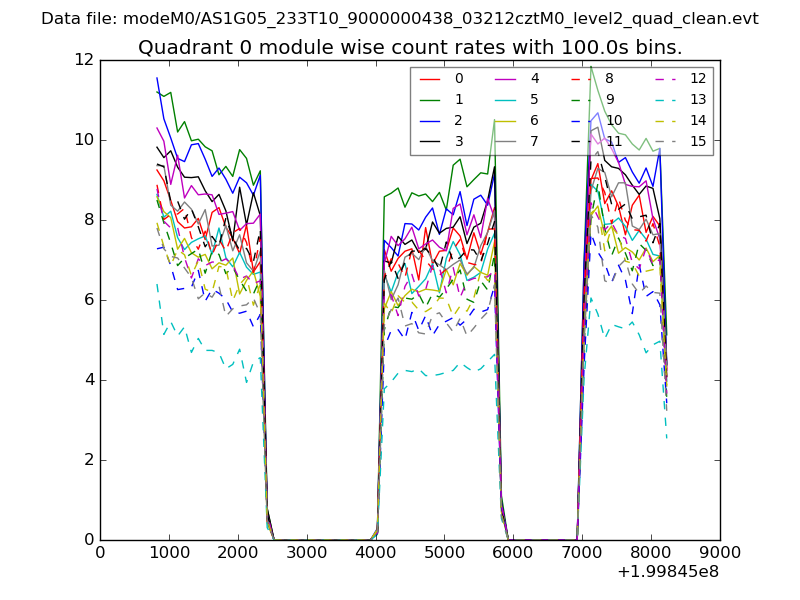 |
 |
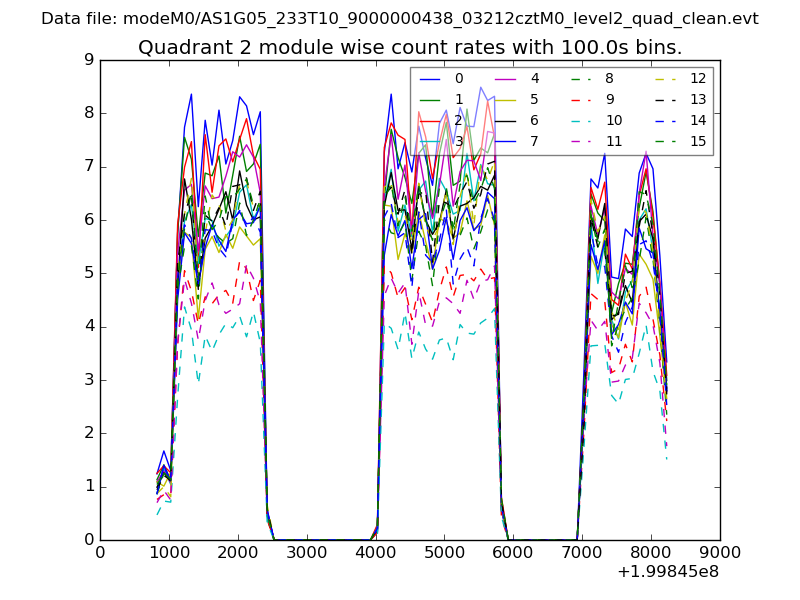
| Module-wise count rates for Quadrant B Data is divided into 100 sec bins |
 |
 |
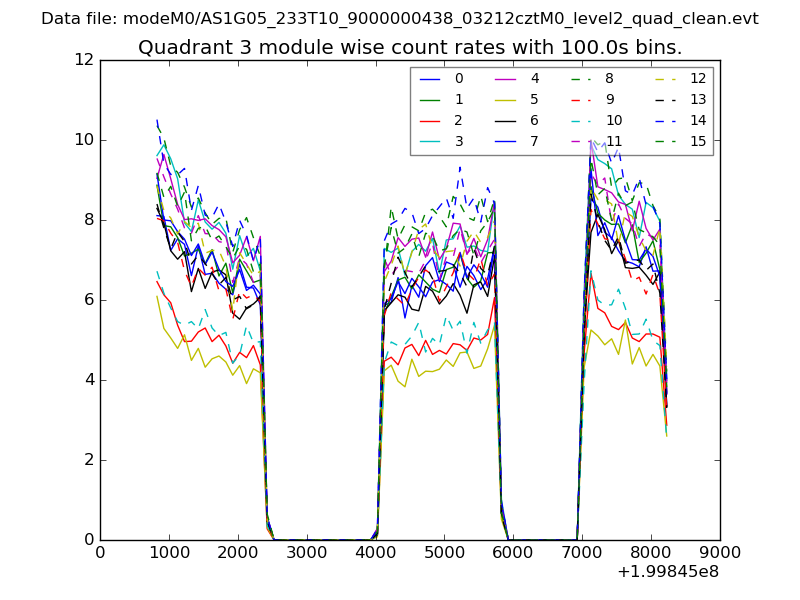
| Module-wise count rates for Quadrant C Data is divided into 100 sec bins |
 |
 |
| Module-wise count rates for Quadrant D Data is divided into 100 sec bins |
 |
 |
| Parameter | Plot |
|---|---|
| CZT HV Monitor | 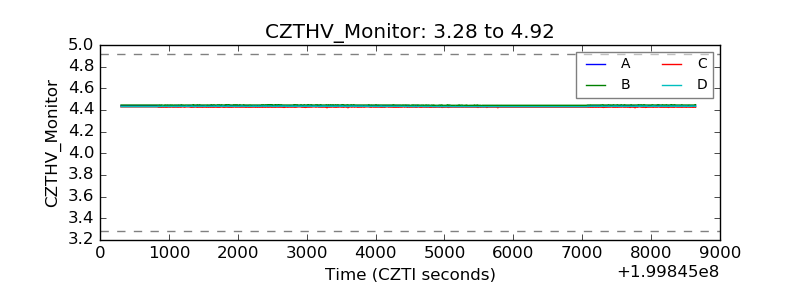 |
| D_VDD | 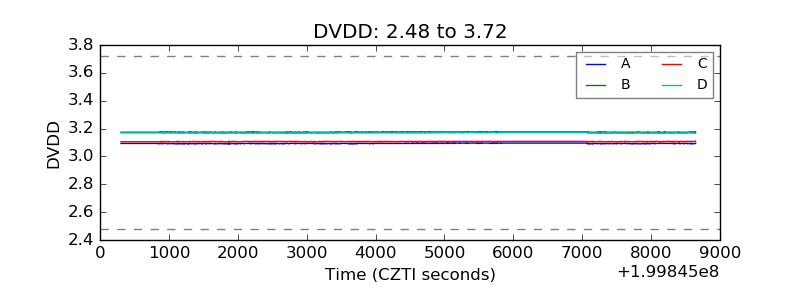 |
| Temperature 1 | 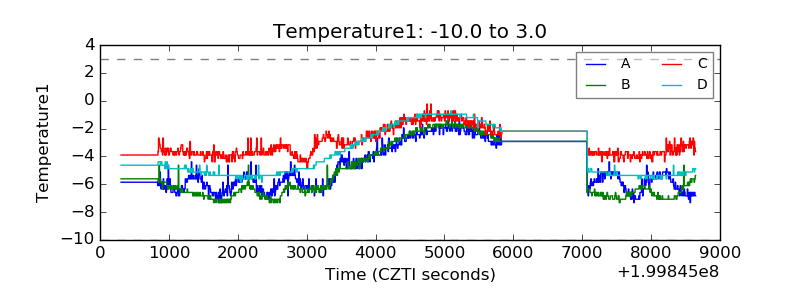 |
| Veto HV Monitor | 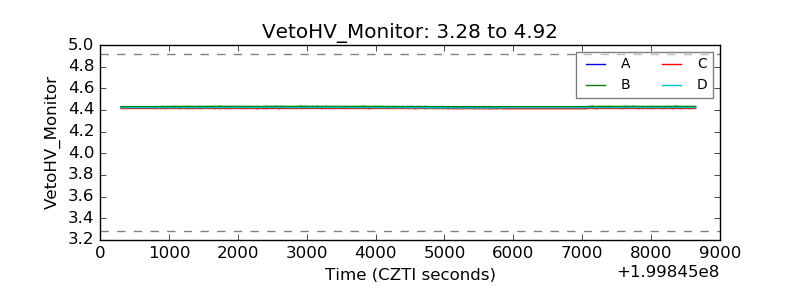 |
| Veto LLD | 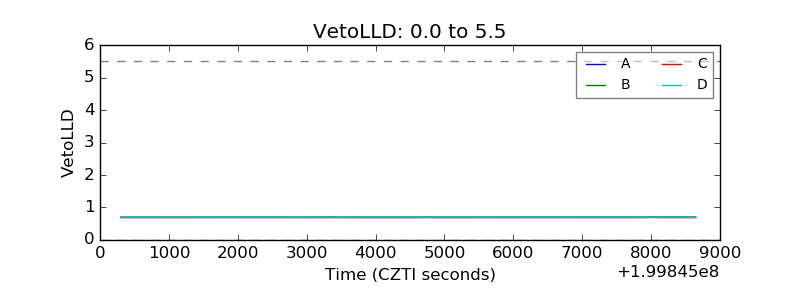 |
| Alpha Counter | 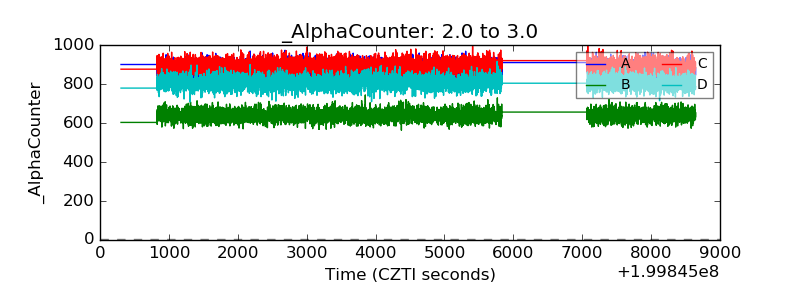 |
| _CPM_Rate | 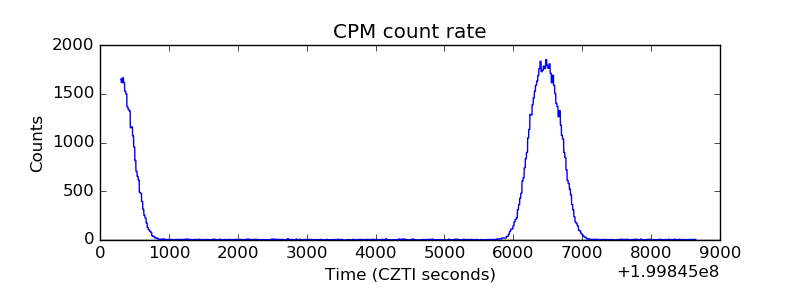 |
| CZT Counter | 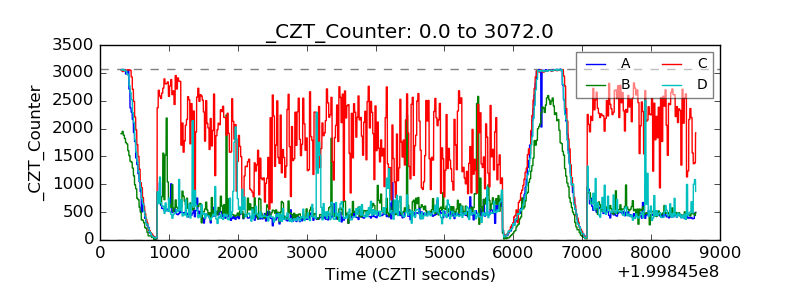 |
| +2.5 Volts monitor | 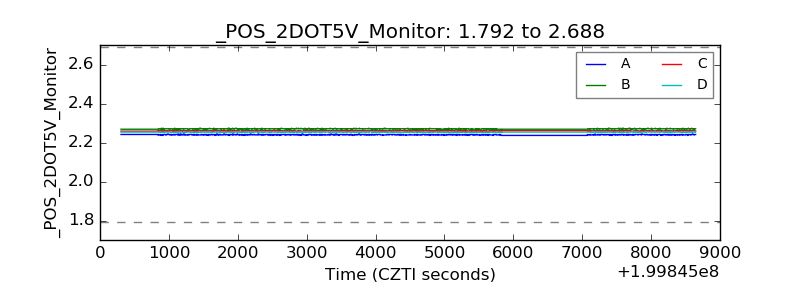 |
| +5 Volts monitor |  |
| Veto Counter | 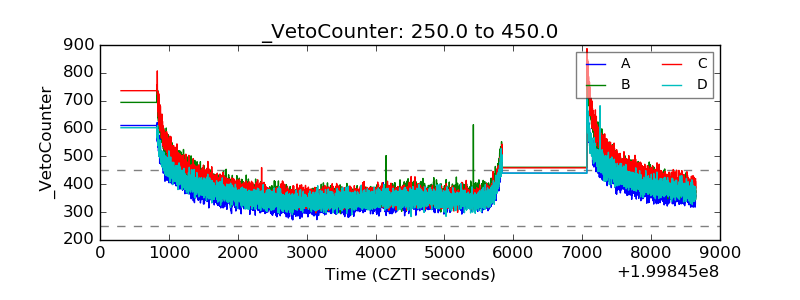 |