| Param | Original file | Final file |
|---|---|---|
| Filename | modeM0/AS1G05_233T10_9000000438_03222cztM0_level2.evt | modeM0/AS1G05_233T10_9000000438_03222cztM0_level2_quad_clean.evt |
| Size (bytes) | 1,688,952,960 | 264,464,640 |
| Size | 1.6 GB | 252.2 MB |
| Events in quadrant A | 12,489,912 | 1,648,316 |
| Events in quadrant B | 11,766,428 | 1,650,750 |
| Events in quadrant C | 14,051,544 | 1,599,471 |
| Events in quadrant D | 11,325,342 | 1,564,201 |
| Mode M9 | |||
|---|---|---|---|
| Quadrant | BADHDUFLAG | Total packets | Discarded packets |
| A | 0 | 25 | 0 |
| B | 0 | 25 | 0 |
| C | 0 | 25 | 0 |
| D | 0 | 25 | 0 |
| Mode M0 | |||
|---|---|---|---|
| Quadrant | BADHDUFLAG | Total packets | Discarded packets |
| A | 0 | 52671 | 3 |
| B | 0 | 49781 | 2 |
| C | 0 | 57587 | 2 |
| D | 0 | 50391 | 2 |
| Mode SS | |||
|---|---|---|---|
| Quadrant | BADHDUFLAG | Total packets | Discarded packets |
| A | 0 | 454 | 0 |
| B | 0 | 454 | 0 |
| C | 0 | 454 | 0 |
| D | 0 | 454 | 0 |
| Quadrant | Total seconds | Saturated seconds | Saturation percentage |
|---|---|---|---|
| A | 22486 | 534 | 2.374811% |
| B | 22486 | 213 | 0.947256% |
| C | 22486 | 738 | 3.282042% |
| D | 22486 | 303 | 1.347505% |
Noise dominated data is calculated using 1-second bins in cleaned event files. If a bin has >2000 counts, and if more than 50% of those come from <1% of pixels, then it is considered to be noise-dominated and hence unusable.
| Quadrant | # 1 sec bins | Bins with >0 counts | Bins with >2000 counts | High rate bins dominated by noise | Noise dominated (total time) | Noise dominated (detector-on time) | Marked lightcurve |
|---|---|---|---|---|---|---|---|
| A | 24846 | 22486 | 230 | 230 | 0.93% | 1.02% | 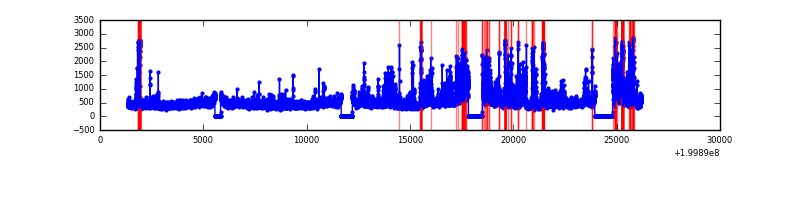 |
| B | 24846 | 22486 | 58 | 58 | 0.23% | 0.26% | 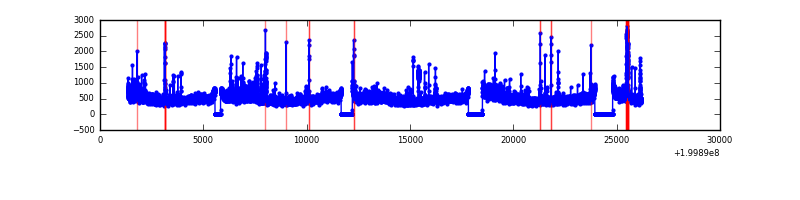 |
| C | 24846 | 22487 | 612 | 612 | 2.46% | 2.72% | 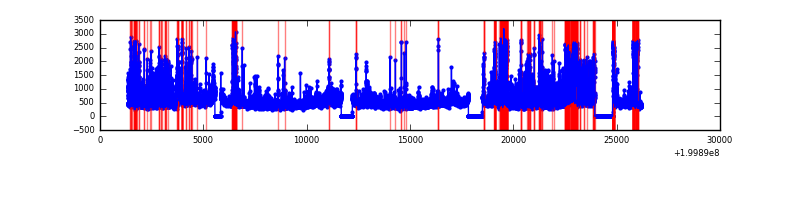 |
| D | 24846 | 22488 | 248 | 248 | 1.00% | 1.10% | 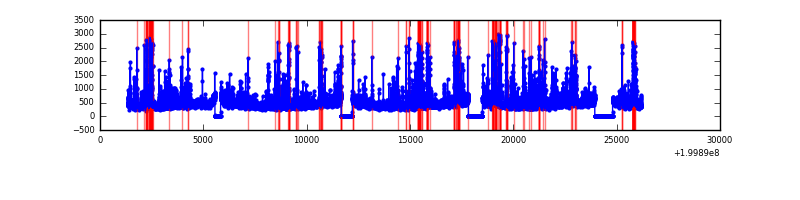 |
Top three noisy pixels from each quadrant. If the there are fewer than three noisy pixels in the level2.evt file, extra rows are filled as -1
| Pixel properties | Quadrant properties | ||||||
|---|---|---|---|---|---|---|---|
| Quadrant | DetID | PixID | Counts | Sigma | Mean | Median | Sigma |
| A | 0 | 199 | 2172667 | 4248.45 | 2508 | 2451 | 510.8 |
| A | 0 | 118 | 279911 | 543.16 | 2508 | 2451 | 510.8 |
| A | 0 | 226 | 252156 | 488.83 | 2508 | 2451 | 510.8 |
| B | 15 | 204 | 1210849 | 2448.17 | 2567 | 2506 | 493.6 |
| B | 2 | 249 | 307126 | 617.18 | 2567 | 2506 | 493.6 |
| B | 3 | 0 | 78229 | 153.42 | 2567 | 2506 | 493.6 |
| C | 1 | 192 | 3844368 | 6831.84 | 2418 | 2432 | 562.4 |
| C | 14 | 223 | 442101 | 781.83 | 2418 | 2432 | 562.4 |
| C | 6 | 80 | 151949 | 265.87 | 2418 | 2432 | 562.4 |
| D | 13 | 223 | 960971 | 1642.73 | 2416 | 2346 | 583.6 |
| D | 13 | 120 | 322819 | 549.17 | 2416 | 2346 | 583.6 |
| D | 13 | 239 | 268703 | 456.44 | 2416 | 2346 | 583.6 |
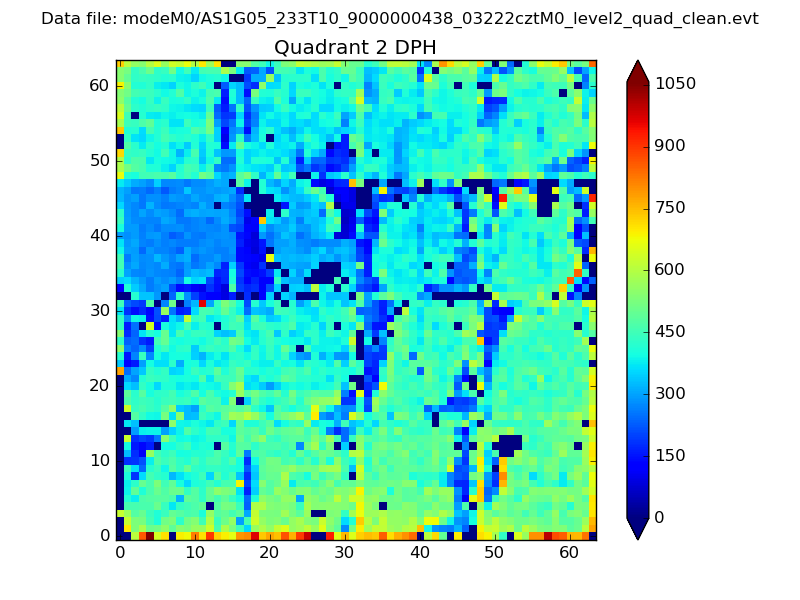
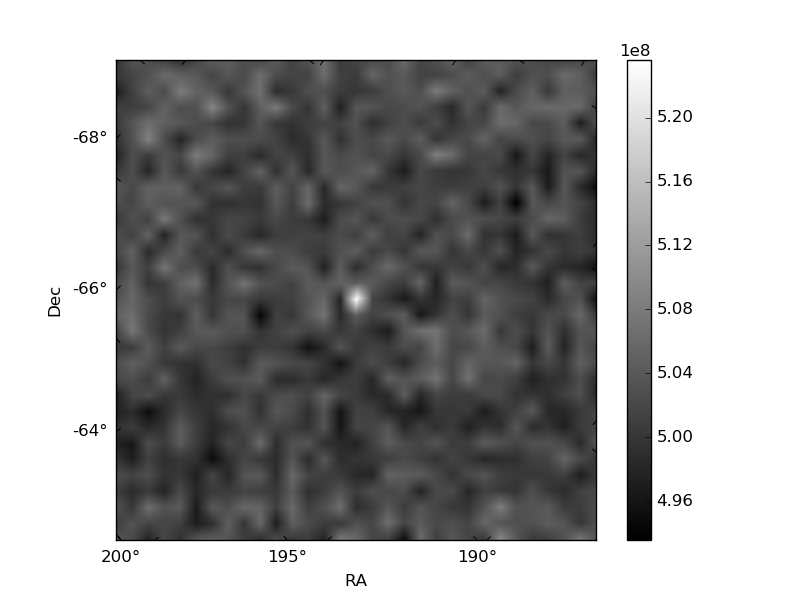
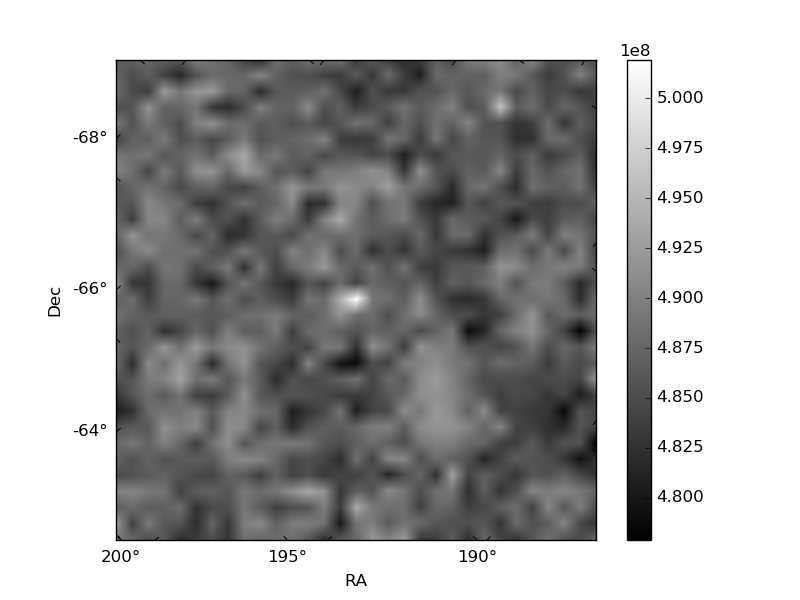
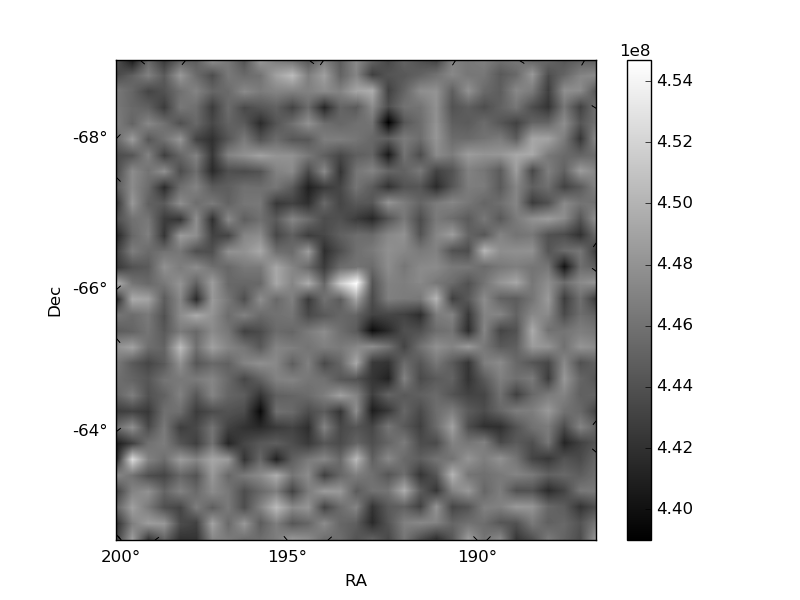
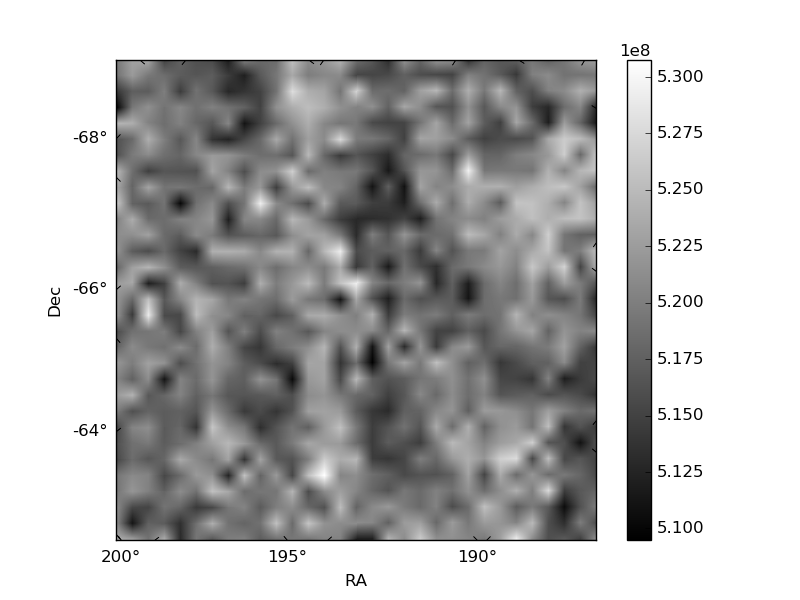
Histogram calculated using DETX and DETY for each event in the final _common_clean file
| Quadrant A | 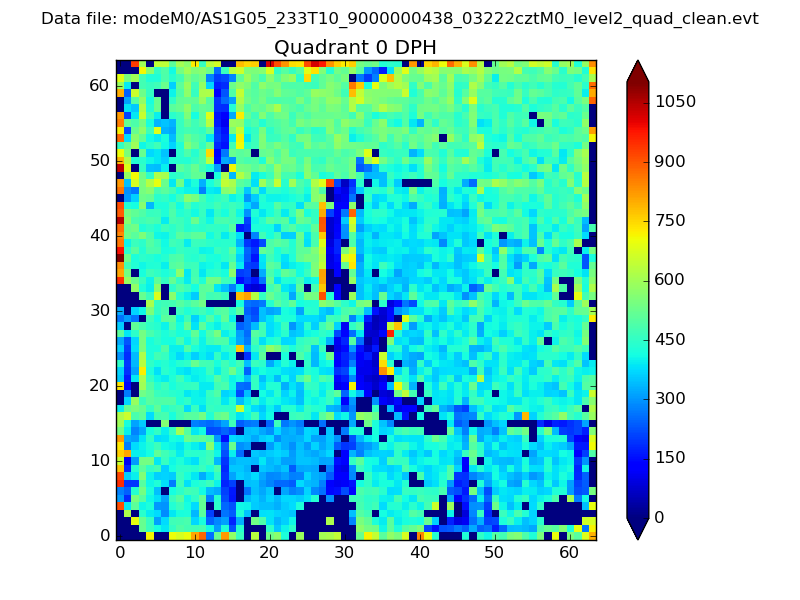 |
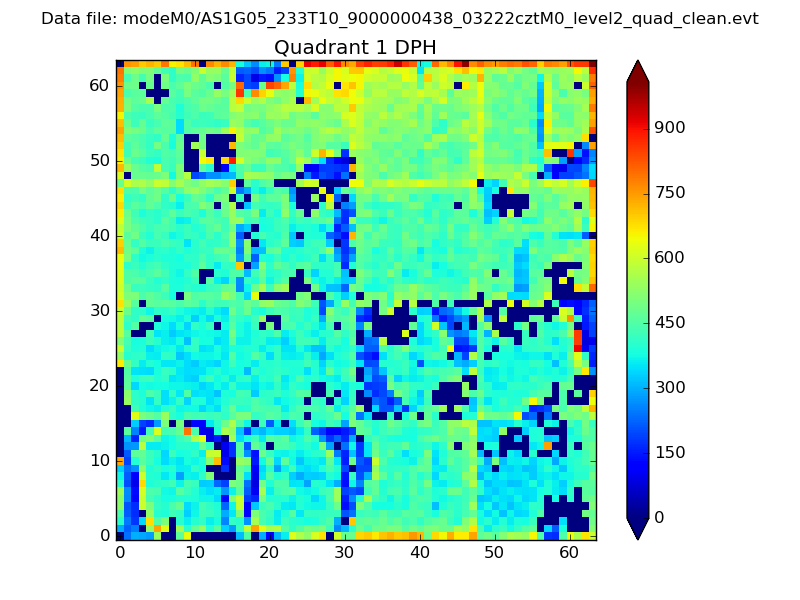 |
Quadrant B |
|---|---|---|---|
| Quadrant D | 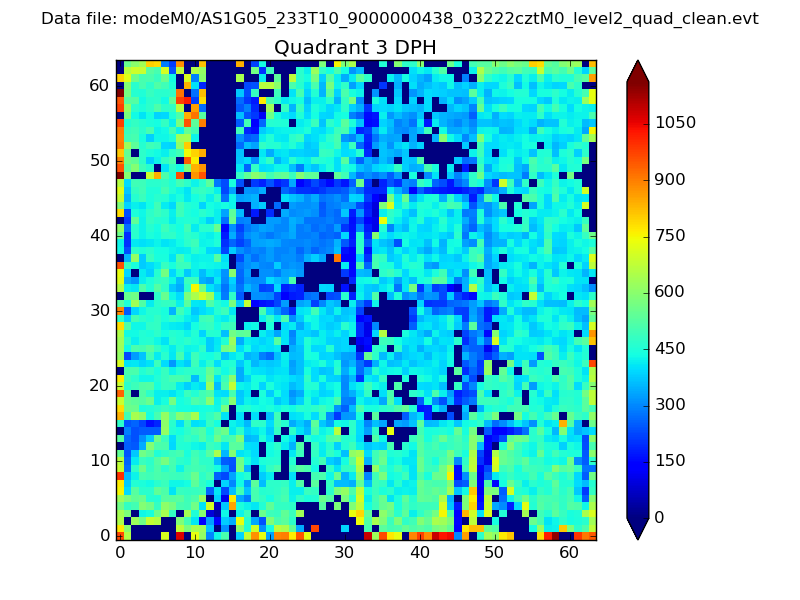 |
 |
Quadrant C |
| Plot type | Count rate plots | Images |
|---|---|---|
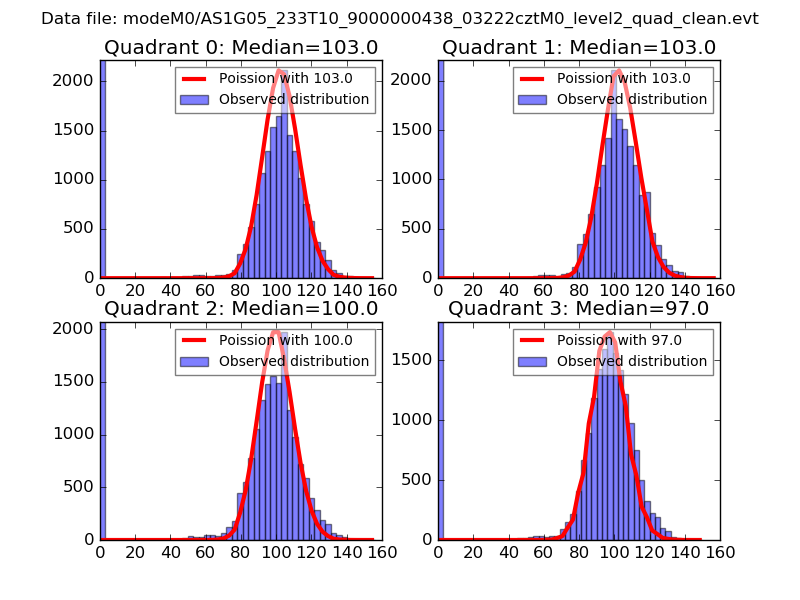
| Comparison with Poisson distribution Blue bars denote a histogram of data divided into 1 sec bins. Red curve is a Poisson curve with rate = median count rate of data. |
 |
 |
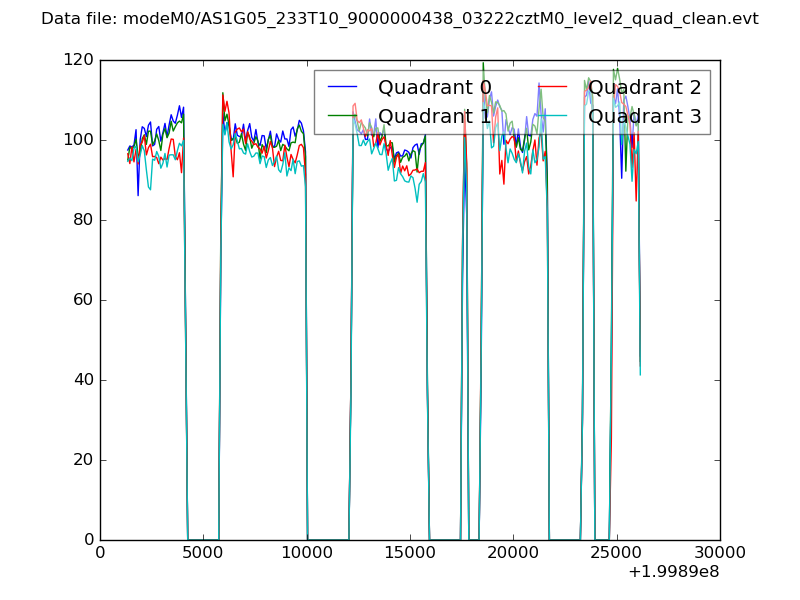
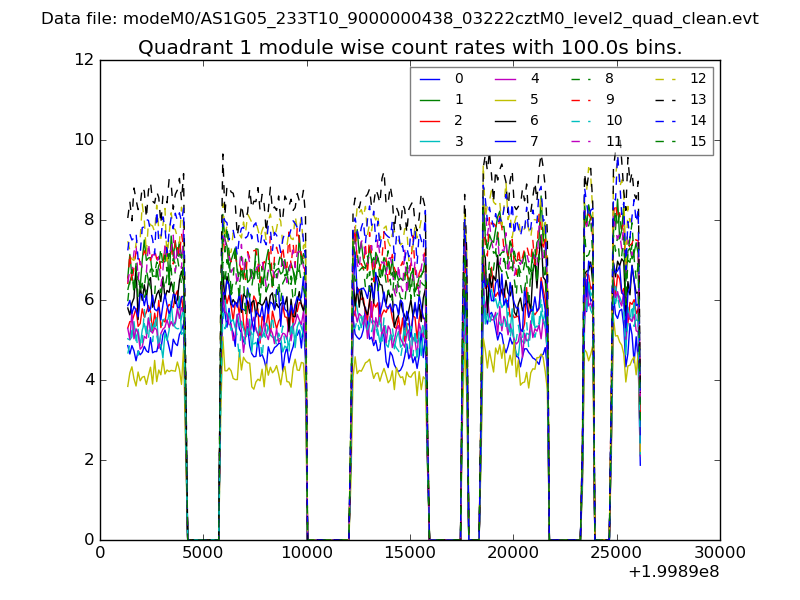
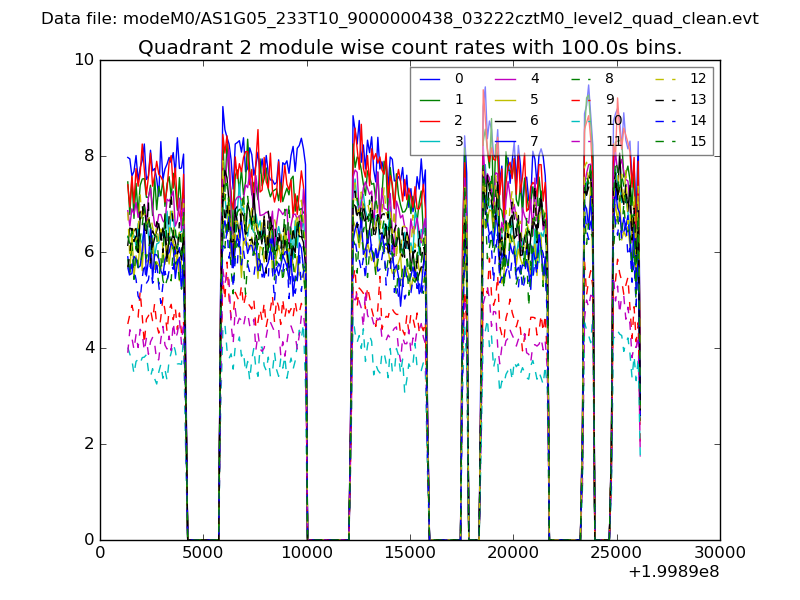
| Quadrant-wise count rates Data is divided into 100 sec bins |
 |
|
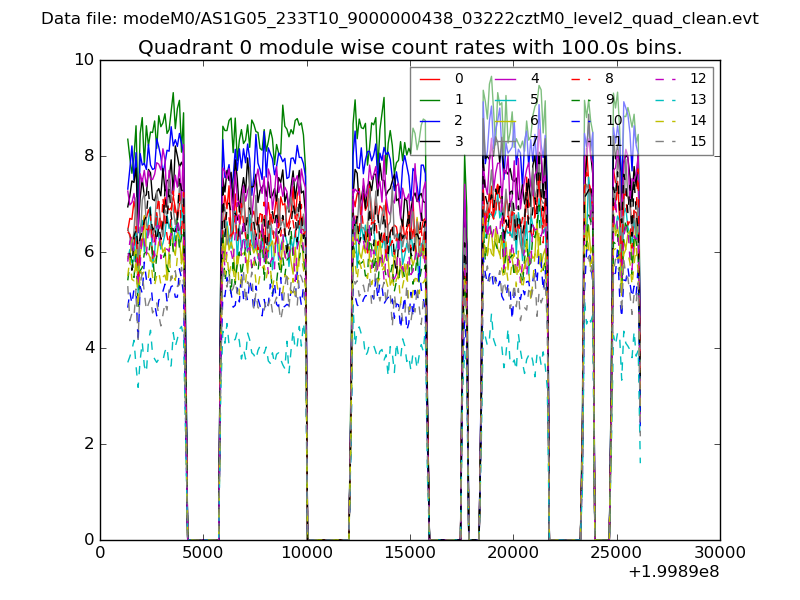
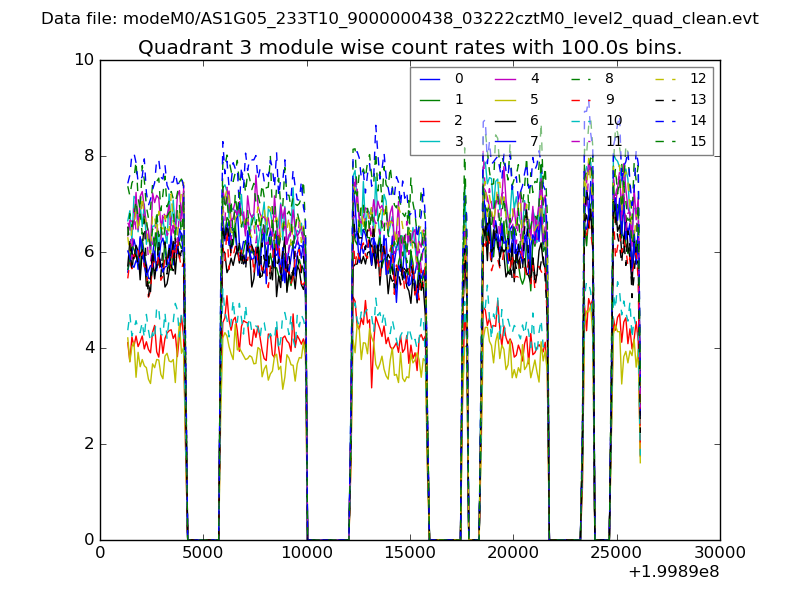
| Module-wise count rates for Quadrant A Data is divided into 100 sec bins |
 |
 |
| Module-wise count rates for Quadrant B Data is divided into 100 sec bins |
 |
 |
| Module-wise count rates for Quadrant C Data is divided into 100 sec bins |
 |
 |
| Module-wise count rates for Quadrant D Data is divided into 100 sec bins |
 |
 |
| Parameter | Plot |
|---|---|
| CZT HV Monitor | 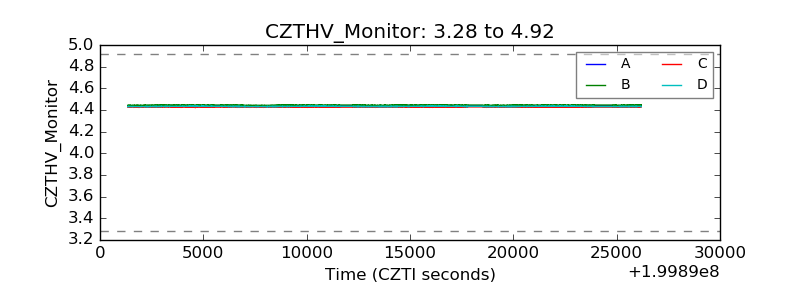 |
| D_VDD | 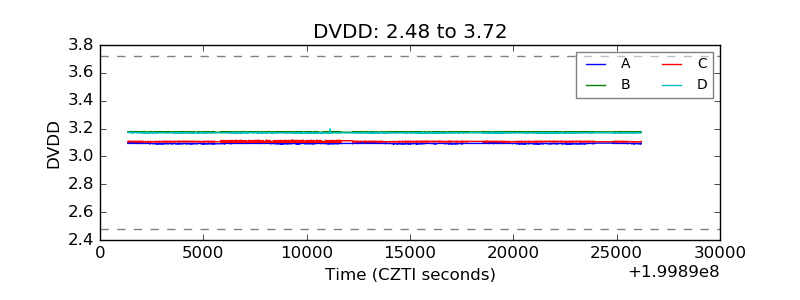 |
| Temperature 1 | 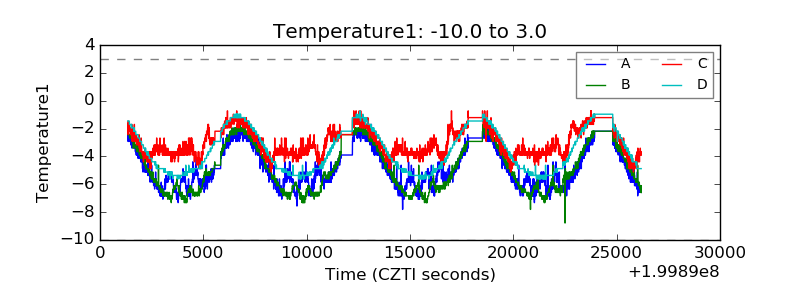 |
| Veto HV Monitor | 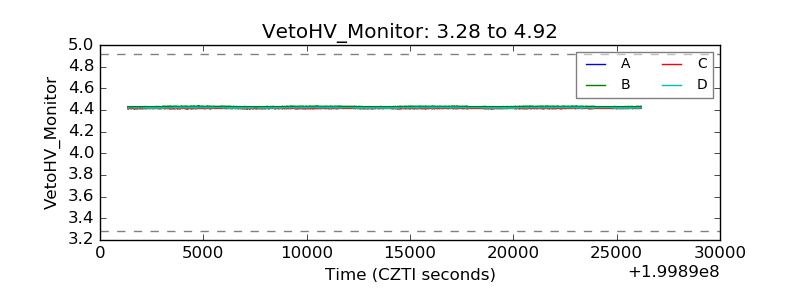 |
| Veto LLD | 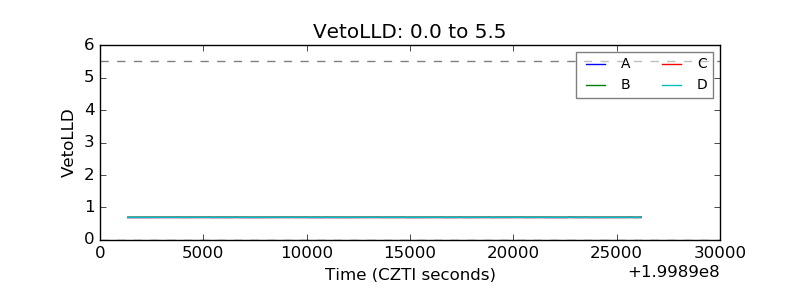 |
| Alpha Counter | 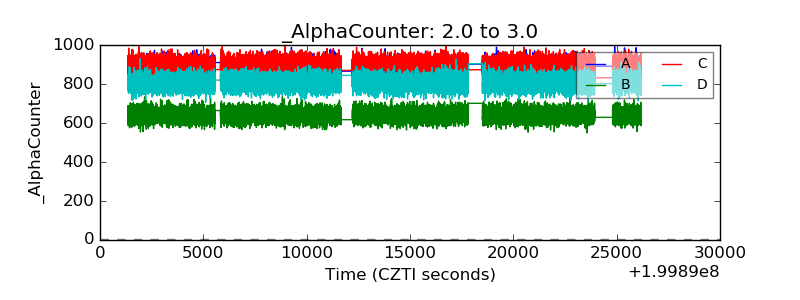 |
| _CPM_Rate | 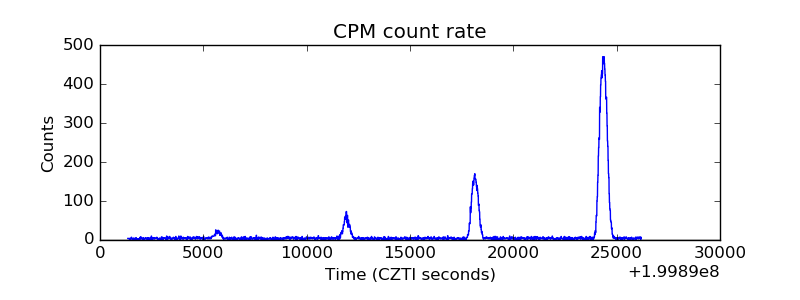 |
| CZT Counter | 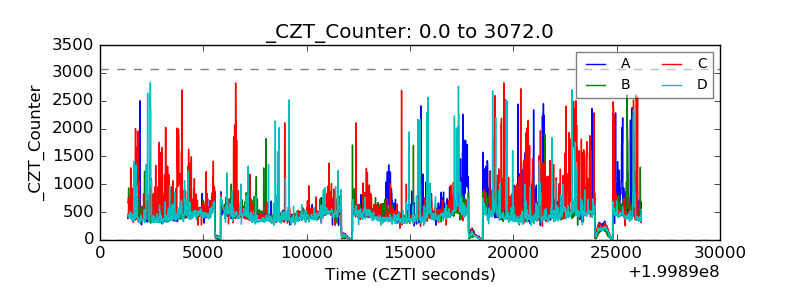 |
| +2.5 Volts monitor |  |
| +5 Volts monitor |  |
| Veto Counter | 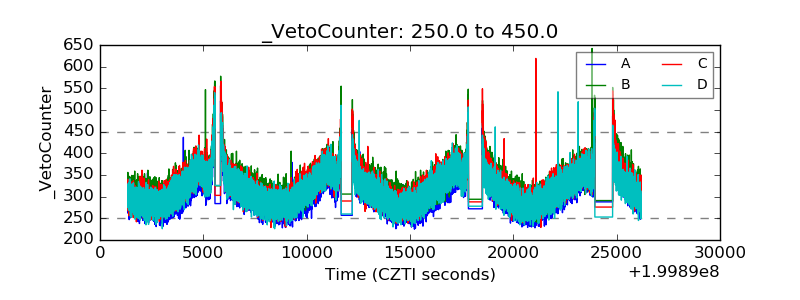 |