| Param | Original file | Final file |
|---|---|---|
| Filename | modeM0/AS1G05_233T10_9000000438_03223cztM0_level2.evt | modeM0/AS1G05_233T10_9000000438_03223cztM0_level2_quad_clean.evt |
| Size (bytes) | 517,242,240 | 85,199,040 |
| Size | 493.3 MB | 81.3 MB |
| Events in quadrant A | 4,163,090 | 540,123 |
| Events in quadrant B | 3,549,622 | 542,229 |
| Events in quadrant C | 4,331,353 | 525,583 |
| Events in quadrant D | 3,176,907 | 515,721 |
| Mode M9 | |||
|---|---|---|---|
| Quadrant | BADHDUFLAG | Total packets | Discarded packets |
| A | 0 | 16 | 0 |
| B | 0 | 16 | 0 |
| C | 0 | 16 | 0 |
| D | 0 | 17 | 0 |
| Mode M0 | |||
|---|---|---|---|
| Quadrant | BADHDUFLAG | Total packets | Discarded packets |
| A | 0 | 17012 | 1 |
| B | 0 | 14946 | 1 |
| C | 0 | 17604 | 1 |
| D | 0 | 14269 | 1 |
| Mode SS | |||
|---|---|---|---|
| Quadrant | BADHDUFLAG | Total packets | Discarded packets |
| A | 0 | 132 | 0 |
| B | 0 | 132 | 0 |
| C | 0 | 132 | 0 |
| D | 0 | 132 | 0 |
| Quadrant | Total seconds | Saturated seconds | Saturation percentage |
|---|---|---|---|
| A | 6543 | 210 | 3.209537% |
| B | 6543 | 78 | 1.192114% |
| C | 6543 | 196 | 2.995568% |
| D | 6543 | 61 | 0.932294% |
Noise dominated data is calculated using 1-second bins in cleaned event files. If a bin has >2000 counts, and if more than 50% of those come from <1% of pixels, then it is considered to be noise-dominated and hence unusable.
| Quadrant | # 1 sec bins | Bins with >0 counts | Bins with >2000 counts | High rate bins dominated by noise | Noise dominated (total time) | Noise dominated (detector-on time) | Marked lightcurve |
|---|---|---|---|---|---|---|---|
| A | 7543 | 6544 | 146 | 146 | 1.94% | 2.23% | 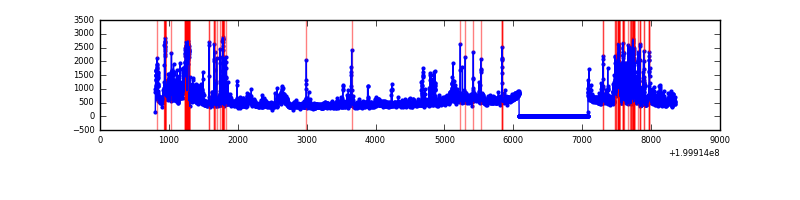 |
| B | 7543 | 6543 | 49 | 49 | 0.65% | 0.75% | 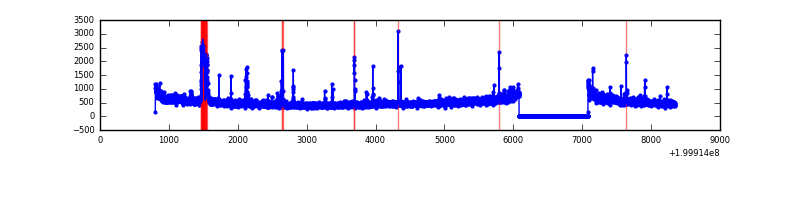 |
| C | 7543 | 6544 | 181 | 181 | 2.40% | 2.77% |  |
| D | 7543 | 6544 | 51 | 51 | 0.68% | 0.78% | 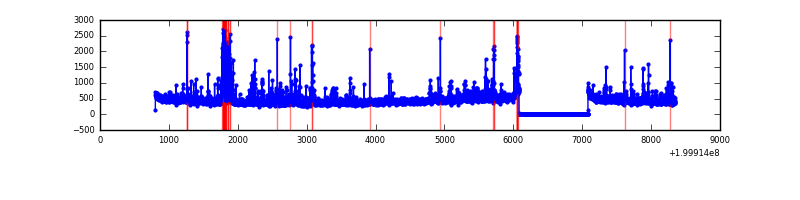 |
Top three noisy pixels from each quadrant. If the there are fewer than three noisy pixels in the level2.evt file, extra rows are filled as -1
| Pixel properties | Quadrant properties | ||||||
|---|---|---|---|---|---|---|---|
| Quadrant | DetID | PixID | Counts | Sigma | Mean | Median | Sigma |
| A | 0 | 199 | 771212 | 5031.97 | 737 | 724 | 153.1 |
| A | 0 | 118 | 385183 | 2510.85 | 737 | 724 | 153.1 |
| A | 0 | 226 | 117155 | 760.39 | 737 | 724 | 153.1 |
| B | 15 | 204 | 372926 | 2523.07 | 757 | 741 | 147.5 |
| B | 2 | 249 | 191884 | 1295.77 | 757 | 741 | 147.5 |
| B | 15 | 186 | 13497 | 86.47 | 757 | 741 | 147.5 |
| C | 1 | 192 | 1298978 | 7773.14 | 711 | 716 | 167.0 |
| C | 14 | 223 | 138826 | 826.91 | 711 | 716 | 167.0 |
| C | 6 | 80 | 75732 | 449.15 | 711 | 716 | 167.0 |
| D | 13 | 223 | 266225 | 1517.66 | 710 | 691 | 175.0 |
| D | 13 | 120 | 93061 | 527.94 | 710 | 691 | 175.0 |
| D | 5 | 233 | 47297 | 266.38 | 710 | 691 | 175.0 |
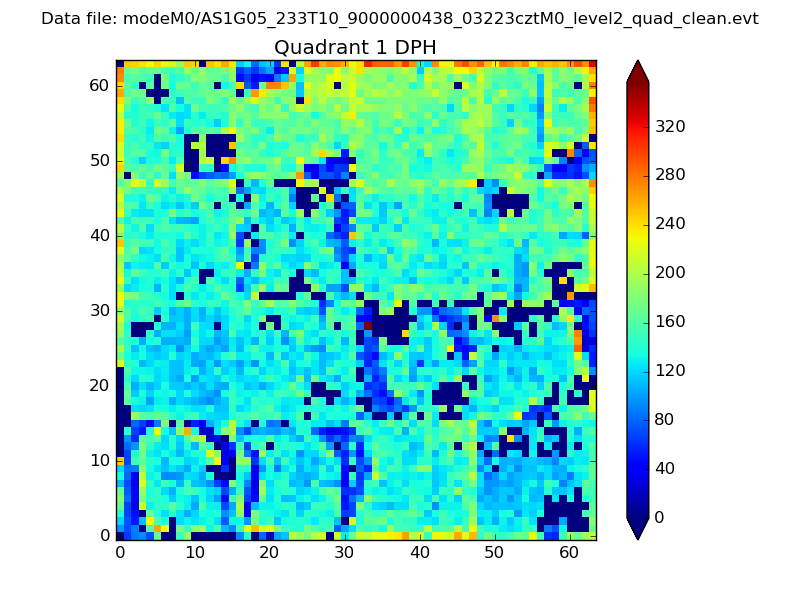
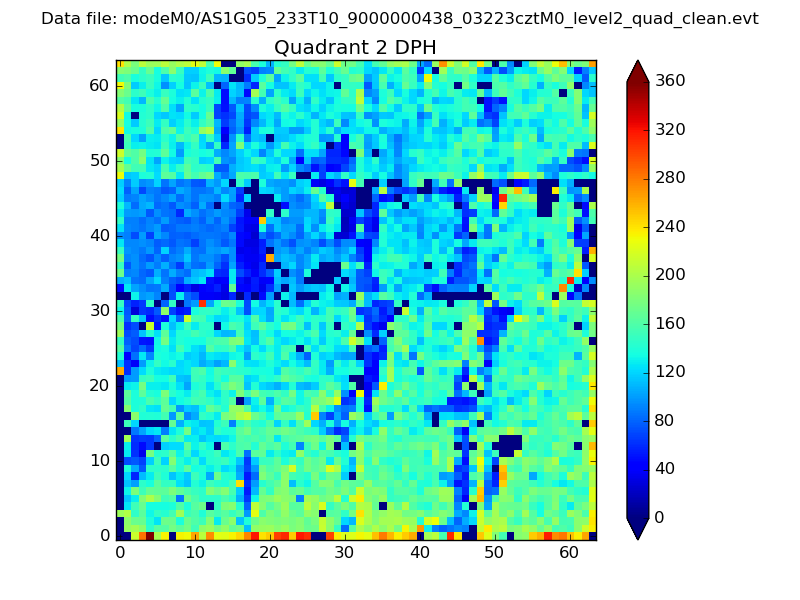
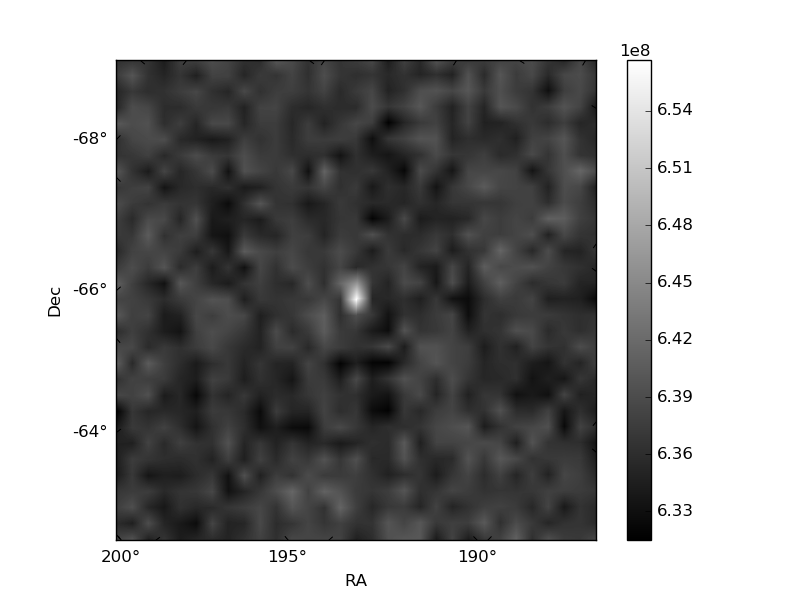
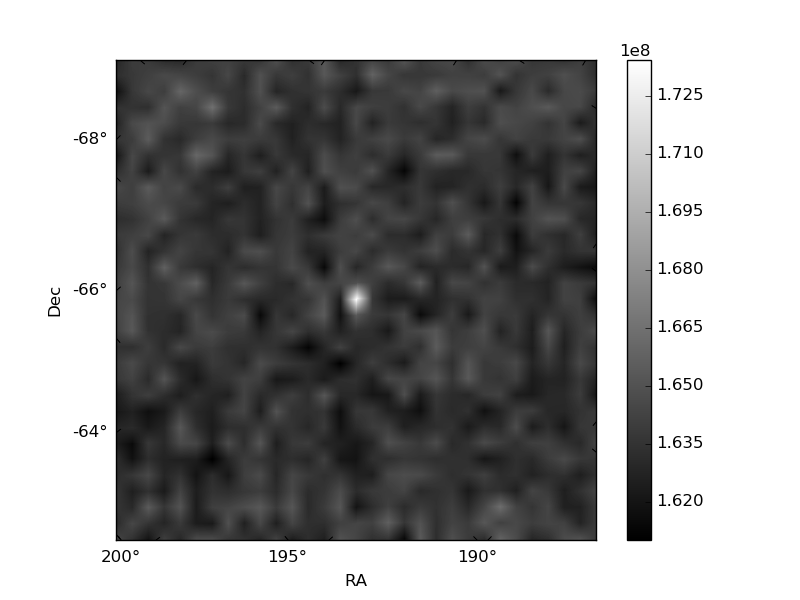
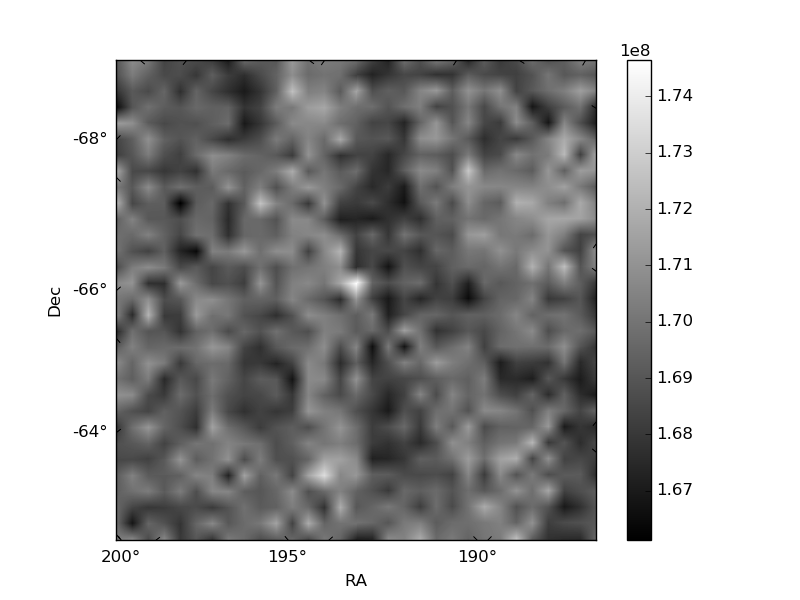
Histogram calculated using DETX and DETY for each event in the final _common_clean file
| Quadrant A | 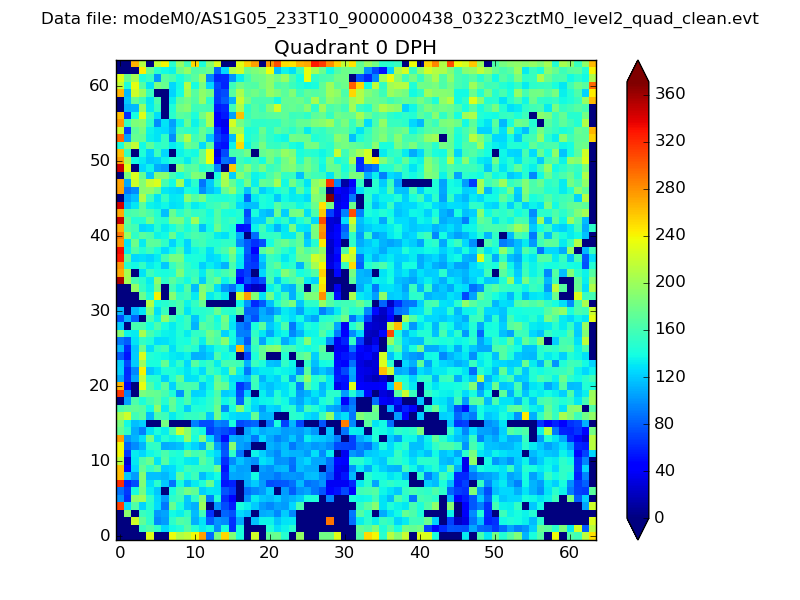 |
 |
Quadrant B |
|---|---|---|---|
| Quadrant D | 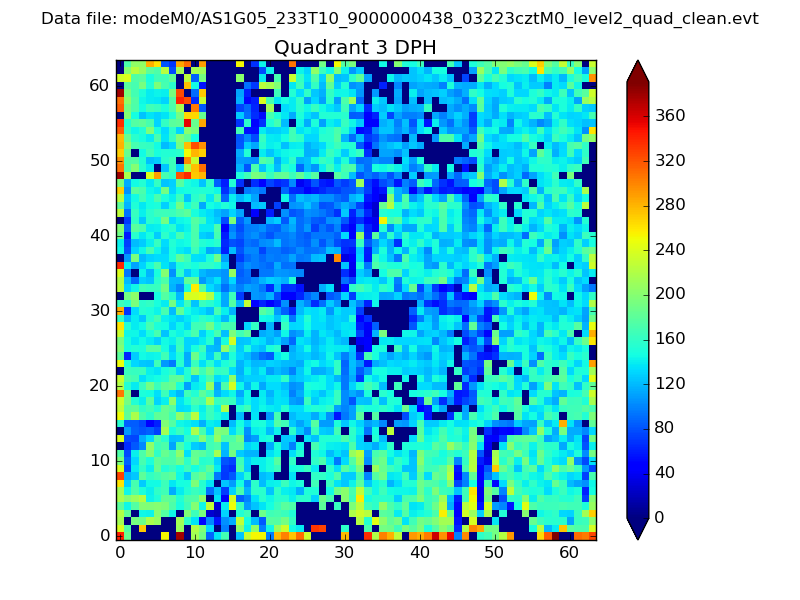 |
 |
Quadrant C |
| Plot type | Count rate plots | Images |
|---|---|---|
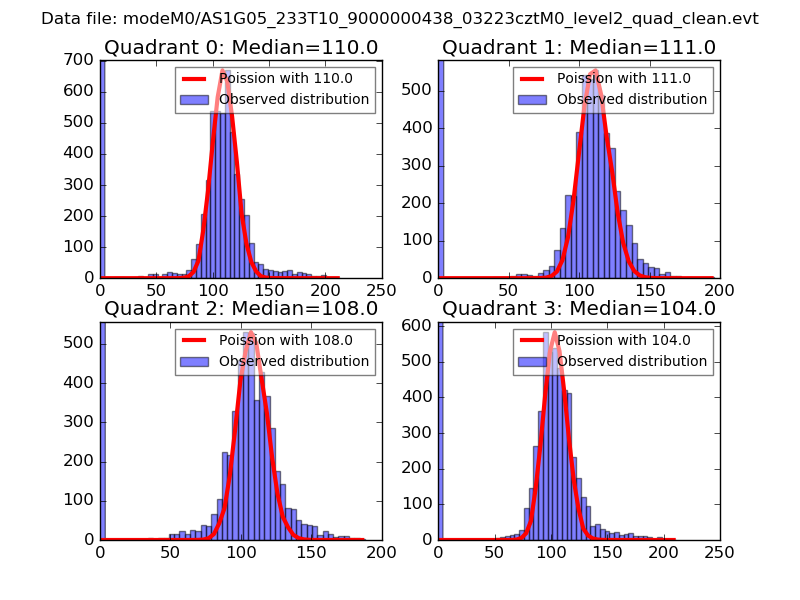
| Comparison with Poisson distribution Blue bars denote a histogram of data divided into 1 sec bins. Red curve is a Poisson curve with rate = median count rate of data. |
 |
 |
| Quadrant-wise count rates Data is divided into 100 sec bins |
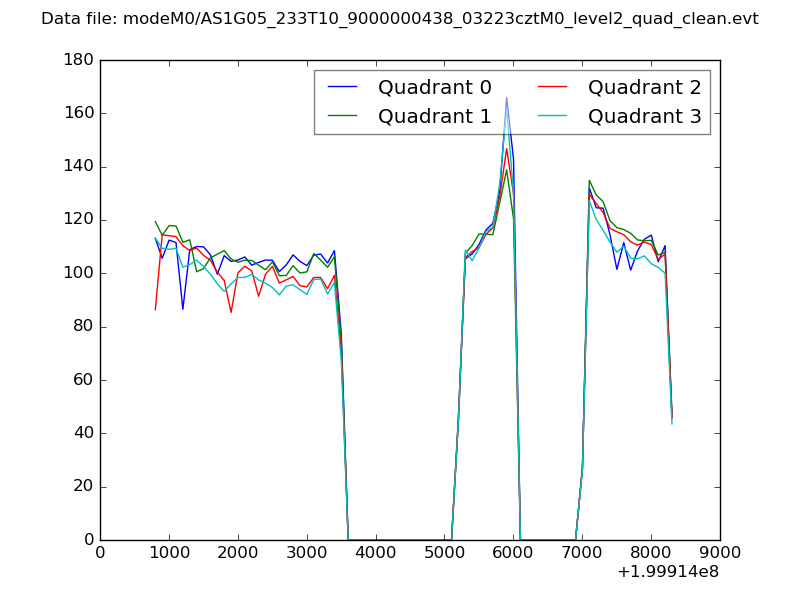 |
|
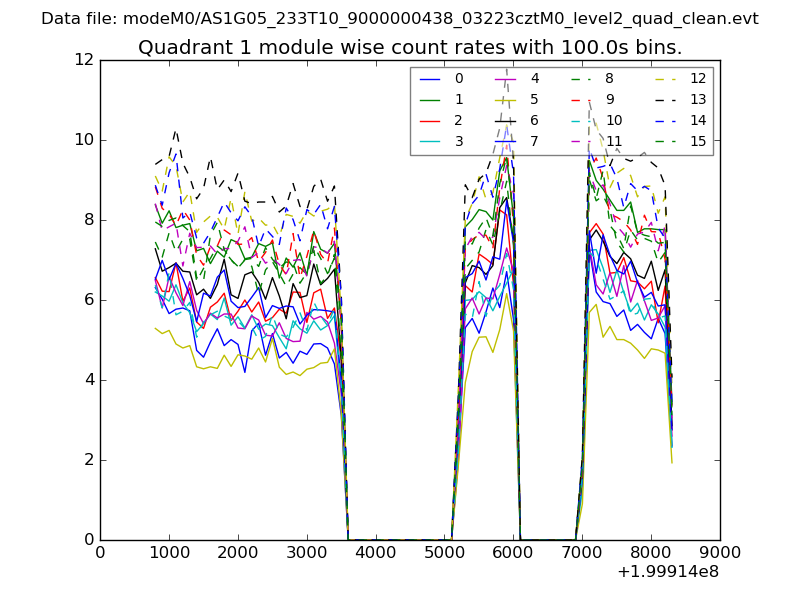
| Module-wise count rates for Quadrant A Data is divided into 100 sec bins |
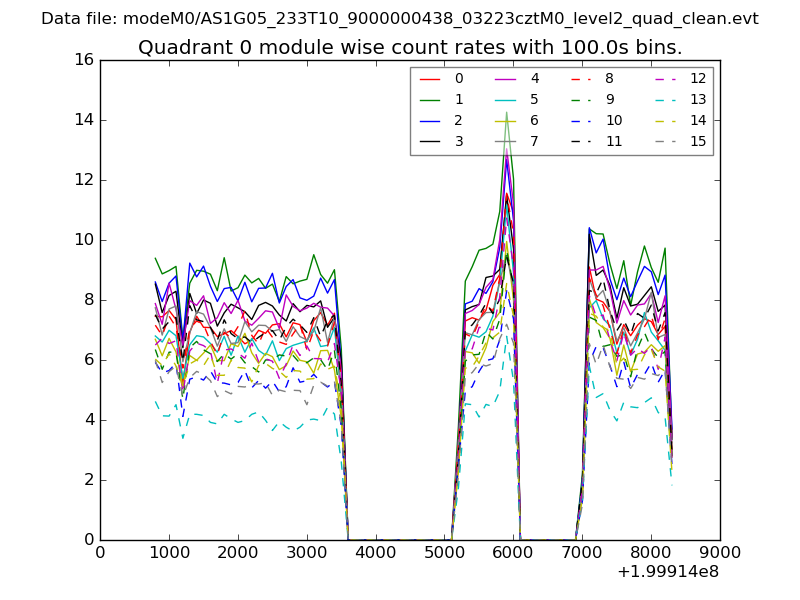 |
 |
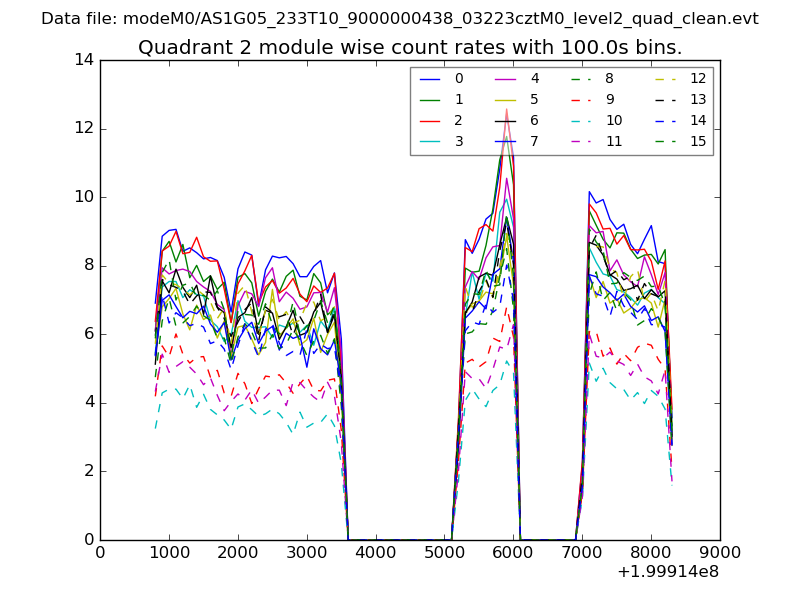
| Module-wise count rates for Quadrant B Data is divided into 100 sec bins |
 |
 |
| Module-wise count rates for Quadrant C Data is divided into 100 sec bins |
 |
 |
| Module-wise count rates for Quadrant D Data is divided into 100 sec bins |
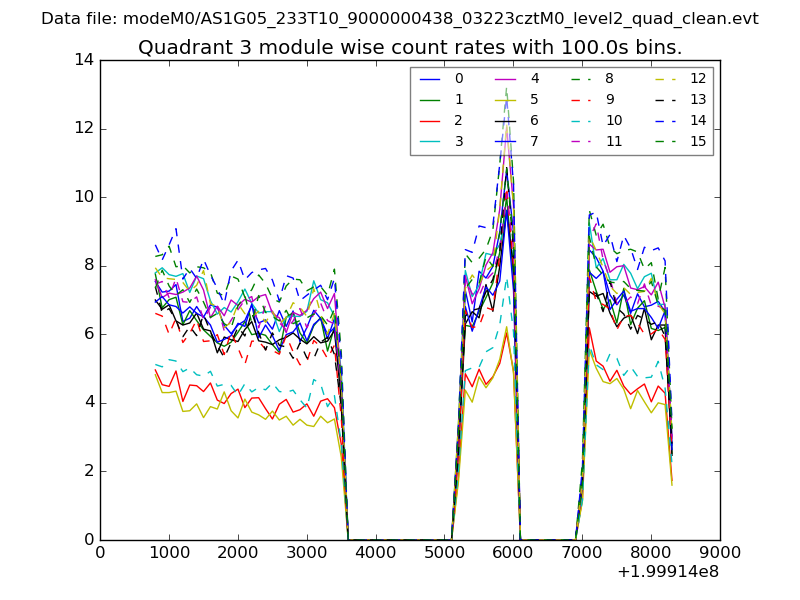 |
 |
| Parameter | Plot |
|---|---|
| CZT HV Monitor | 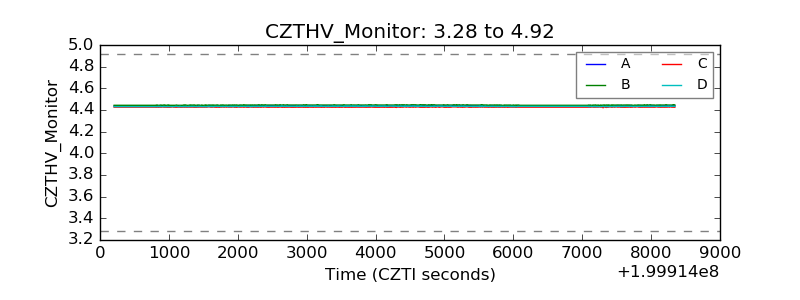 |
| D_VDD | 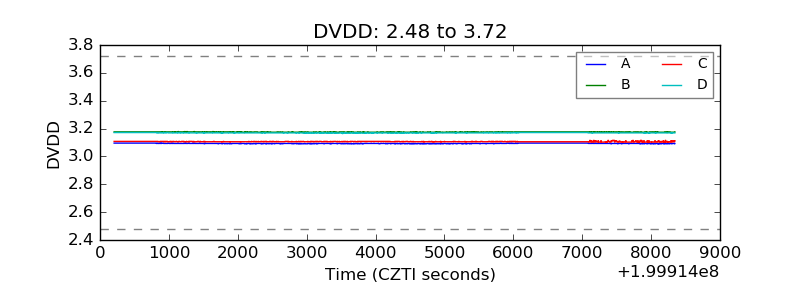 |
| Temperature 1 | 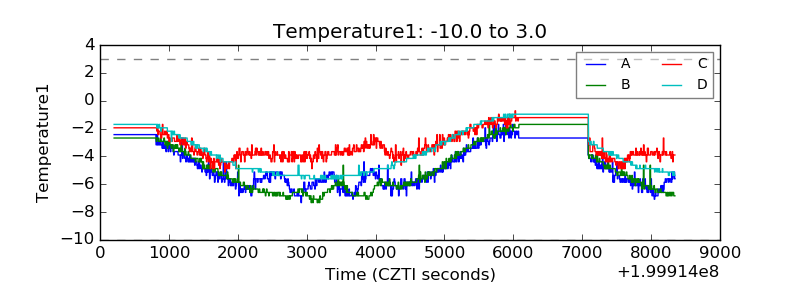 |
| Veto HV Monitor | 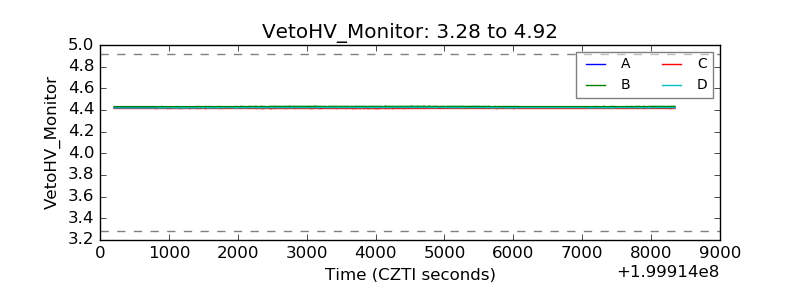 |
| Veto LLD | 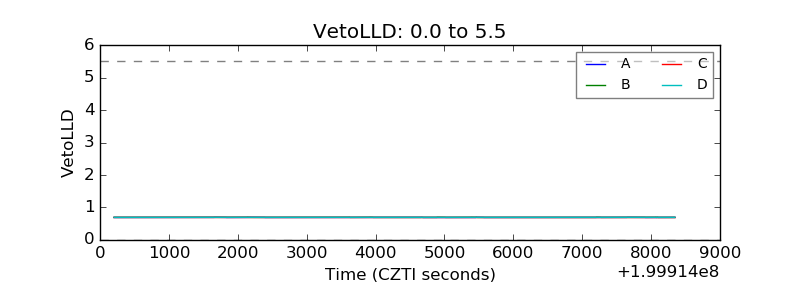 |
| Alpha Counter | 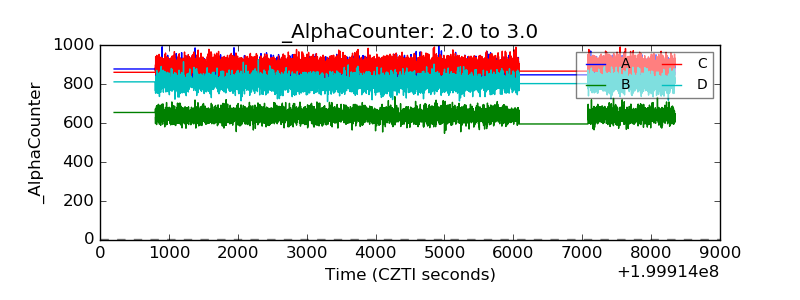 |
| _CPM_Rate | 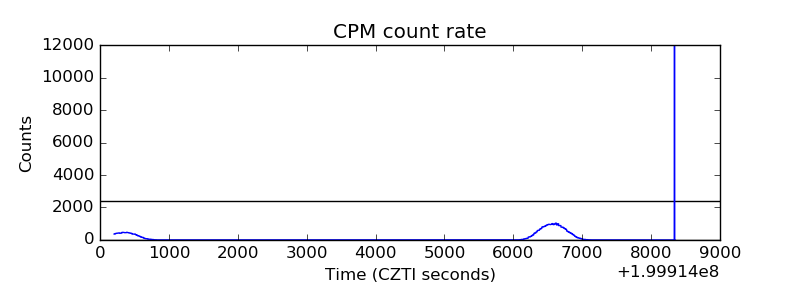 |
| CZT Counter |  |
| +2.5 Volts monitor | 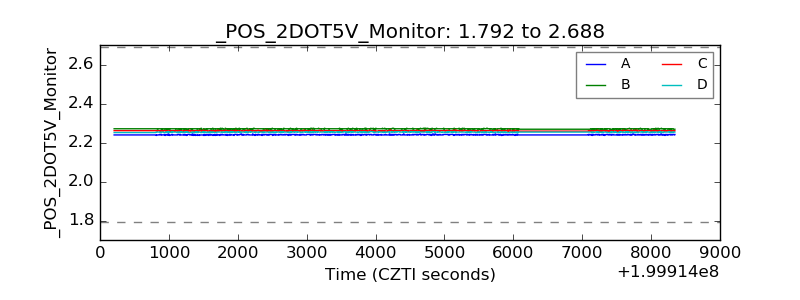 |
| +5 Volts monitor |  |
| Veto Counter | 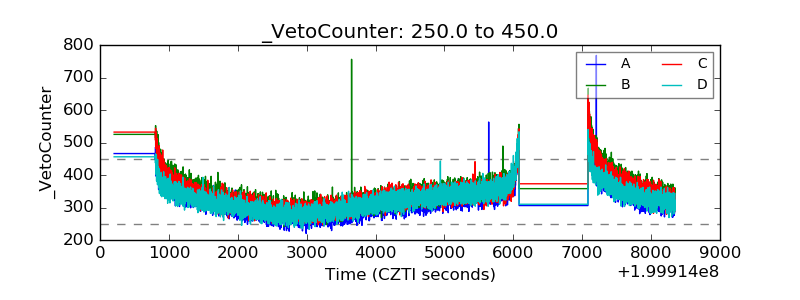 |