| Param | Original file | Final file |
|---|---|---|
| Filename | modeM0/AS1G05_233T10_9000000438_03225cztM0_level2.evt | modeM0/AS1G05_233T10_9000000438_03225cztM0_level2_quad_clean.evt |
| Size (bytes) | 100,385,280 | 22,207,680 |
| Size | 95.7 MB | 21.2 MB |
| Events in quadrant A | 994,955 | 143,047 |
| Events in quadrant B | 724,831 | 148,716 |
| Events in quadrant C | 629,325 | 145,808 |
| Events in quadrant D | 602,102 | 139,237 |
| Mode M9 | |||
|---|---|---|---|
| Quadrant | BADHDUFLAG | Total packets | Discarded packets |
| A | 0 | 5 | 0 |
| B | 0 | 5 | 0 |
| C | 0 | 5 | 0 |
| D | 0 | 6 | 0 |
| Mode M0 | |||
|---|---|---|---|
| Quadrant | BADHDUFLAG | Total packets | Discarded packets |
| A | 0 | 3797 | 1 |
| B | 0 | 2980 | 1 |
| C | 0 | 2701 | 1 |
| D | 0 | 2671 | 1 |
| Mode SS | |||
|---|---|---|---|
| Quadrant | BADHDUFLAG | Total packets | Discarded packets |
| A | 0 | 26 | 0 |
| B | 0 | 26 | 0 |
| C | 0 | 26 | 0 |
| D | 0 | 26 | 0 |
| Quadrant | Total seconds | Saturated seconds | Saturation percentage |
|---|---|---|---|
| A | 1263 | 68 | 5.384006% |
| B | 1263 | 12 | 0.950119% |
| C | 1263 | 4 | 0.316706% |
| D | 1263 | 3 | 0.237530% |
Noise dominated data is calculated using 1-second bins in cleaned event files. If a bin has >2000 counts, and if more than 50% of those come from <1% of pixels, then it is considered to be noise-dominated and hence unusable.
| Quadrant | # 1 sec bins | Bins with >0 counts | Bins with >2000 counts | High rate bins dominated by noise | Noise dominated (total time) | Noise dominated (detector-on time) | Marked lightcurve |
|---|---|---|---|---|---|---|---|
| A | 1263 | 1263 | 61 | 61 | 4.83% | 4.83% | 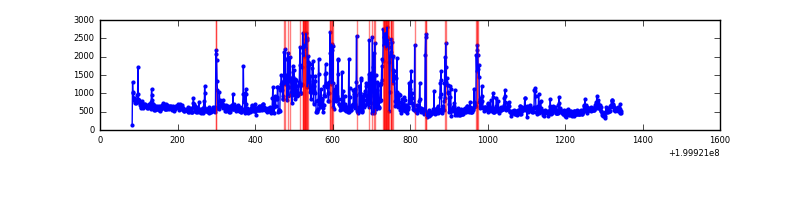 |
| B | 1263 | 1263 | 1 | 1 | 0.08% | 0.08% | 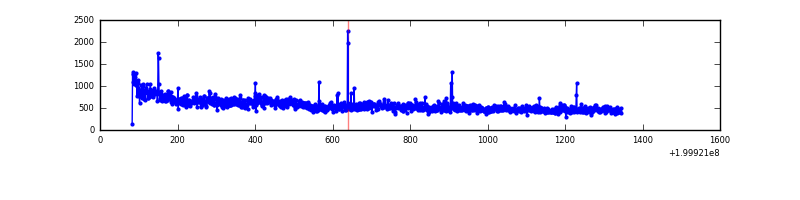 |
| C | 1263 | 1263 | 4 | 4 | 0.32% | 0.32% | 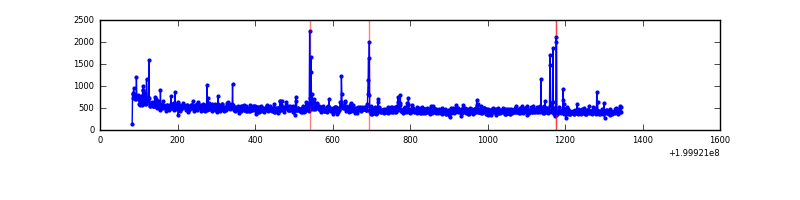 |
| D | 1263 | 1263 | 2 | 2 | 0.16% | 0.16% | 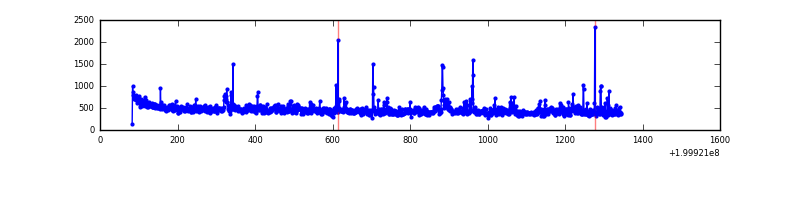 |
Top three noisy pixels from each quadrant. If the there are fewer than three noisy pixels in the level2.evt file, extra rows are filled as -1
| Pixel properties | Quadrant properties | ||||||
|---|---|---|---|---|---|---|---|
| Quadrant | DetID | PixID | Counts | Sigma | Mean | Median | Sigma |
| A | 0 | 199 | 266300 | 8139.22 | 147 | 144 | 32.7 |
| A | 0 | 118 | 122958 | 3755.73 | 147 | 144 | 32.7 |
| A | 0 | 226 | 38801 | 1182.15 | 147 | 144 | 32.7 |
| B | 15 | 204 | 100966 | 3117.51 | 155 | 152 | 32.3 |
| B | 4 | 170 | 5638 | 169.65 | 155 | 152 | 32.3 |
| B | 2 | 249 | 5211 | 156.44 | 155 | 152 | 32.3 |
| C | 6 | 80 | 21027 | 585.19 | 143 | 143 | 35.7 |
| C | 14 | 223 | 19928 | 554.4 | 143 | 143 | 35.7 |
| C | 1 | 192 | 16491 | 458.09 | 143 | 143 | 35.7 |
| D | 13 | 223 | 30287 | 829.55 | 140 | 136 | 36.3 |
| D | 13 | 120 | 25112 | 687.17 | 140 | 136 | 36.3 |
| D | 13 | 114 | 8662 | 234.58 | 140 | 136 | 36.3 |
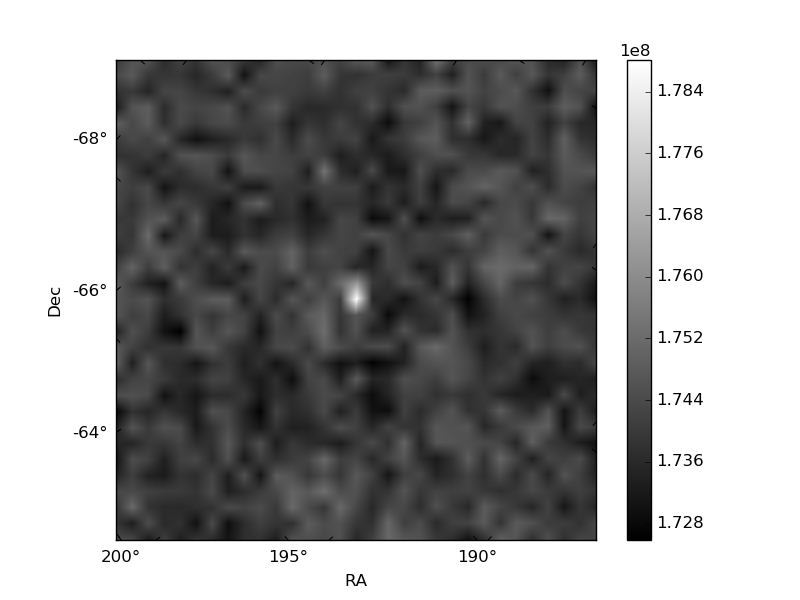
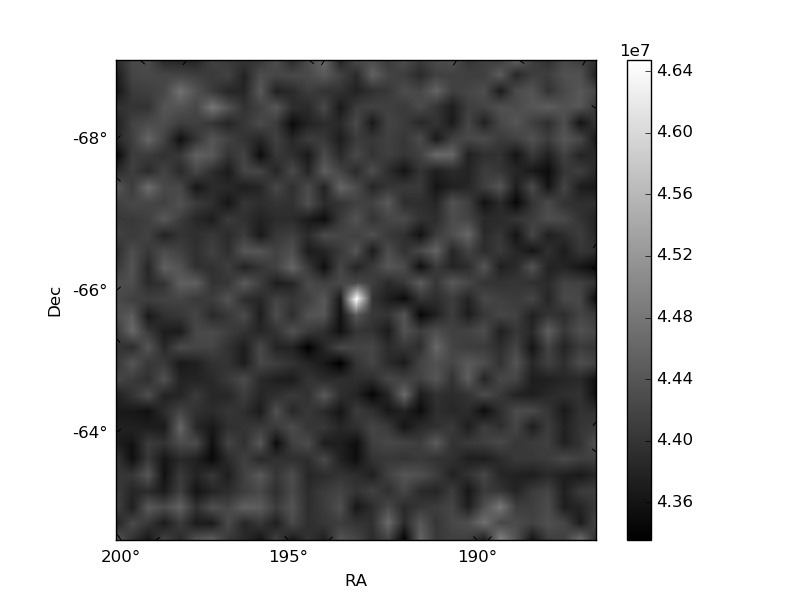
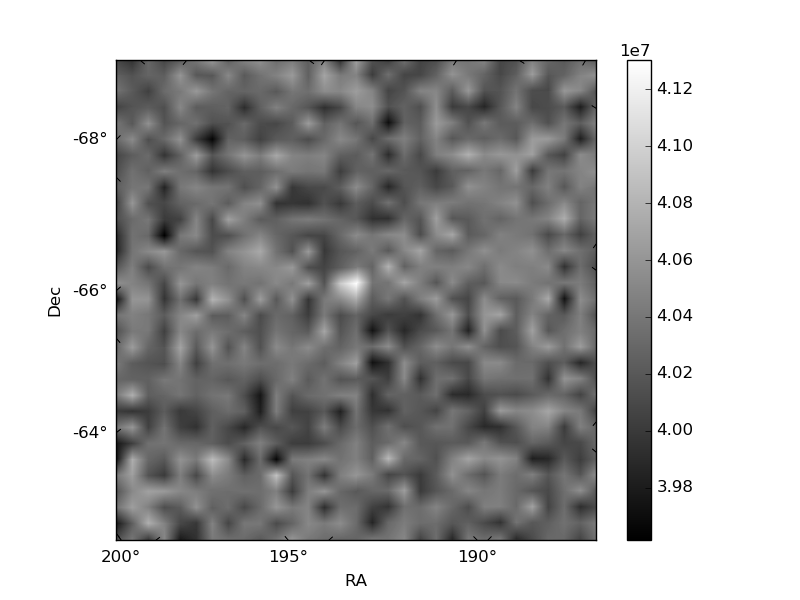
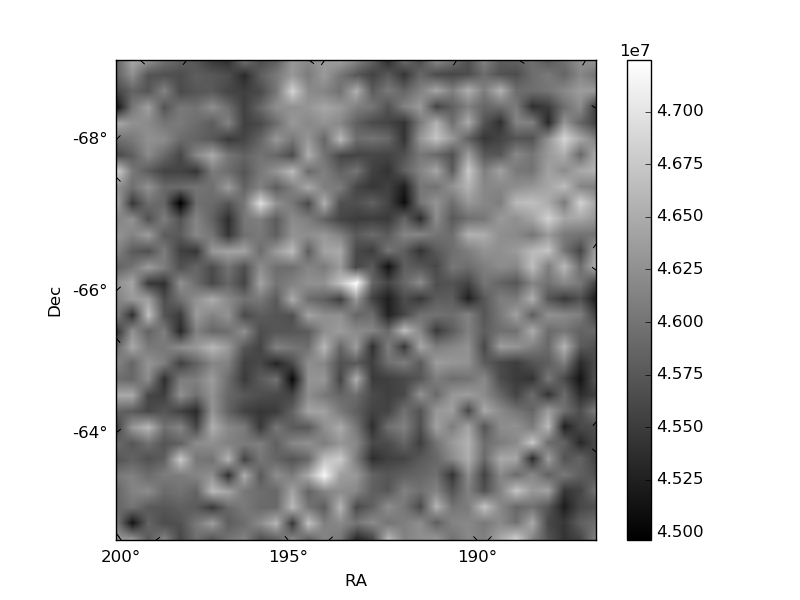
Histogram calculated using DETX and DETY for each event in the final _common_clean file
| Quadrant A | 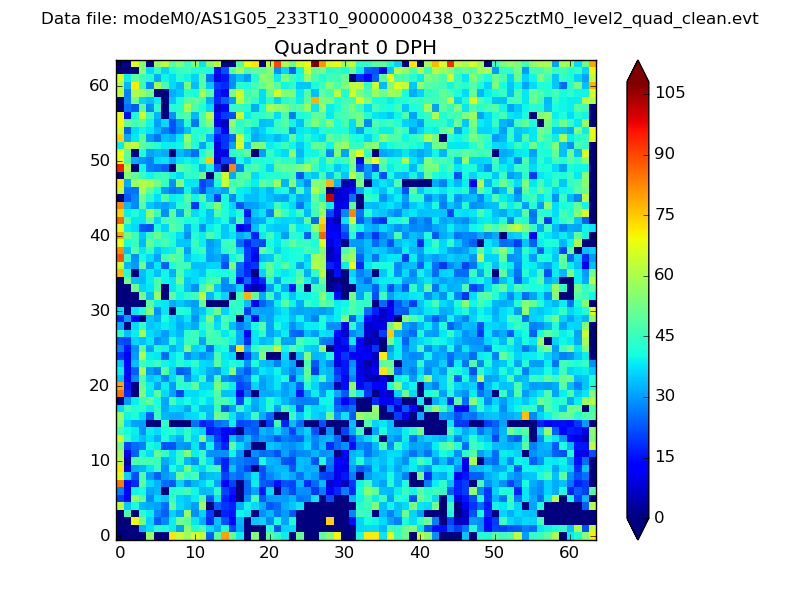 |
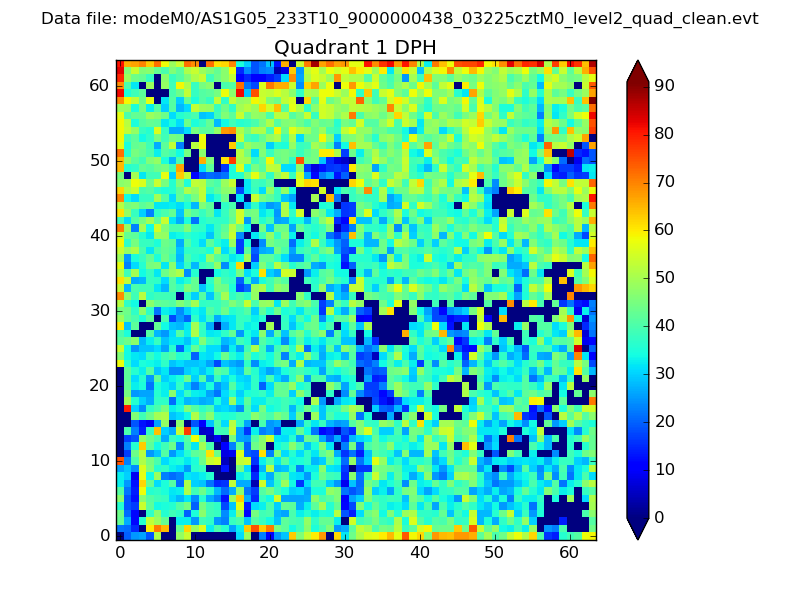 |
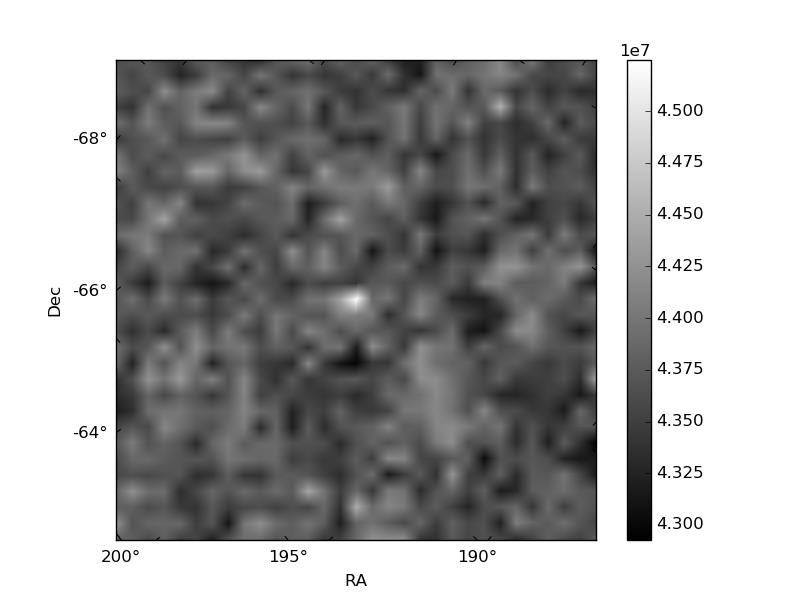
Quadrant B |
|---|---|---|---|
| Quadrant D | 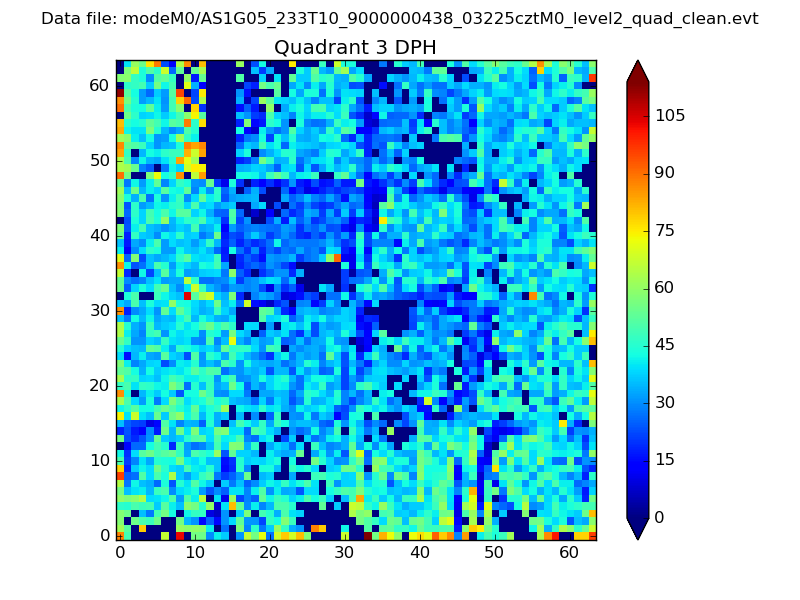 |
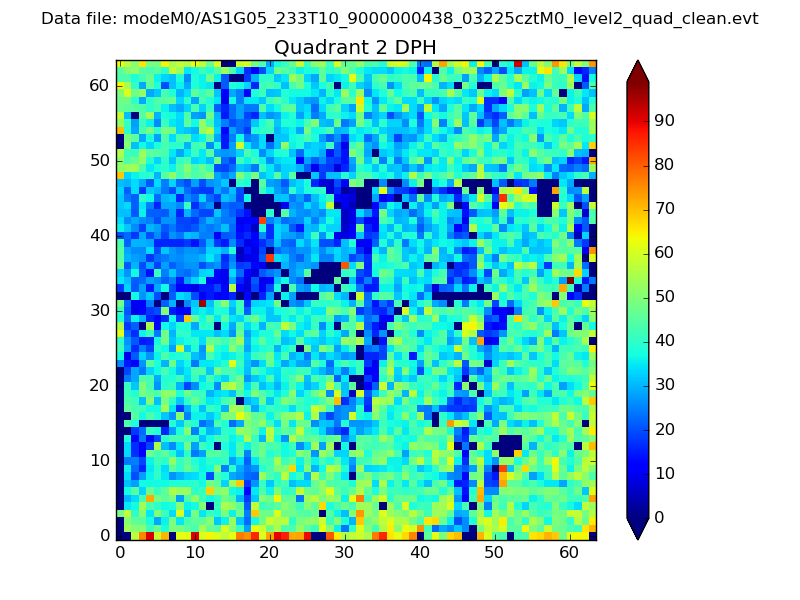 |
Quadrant C |
| Plot type | Count rate plots | Images |
|---|---|---|
| Comparison with Poisson distribution Blue bars denote a histogram of data divided into 1 sec bins. Red curve is a Poisson curve with rate = median count rate of data. |
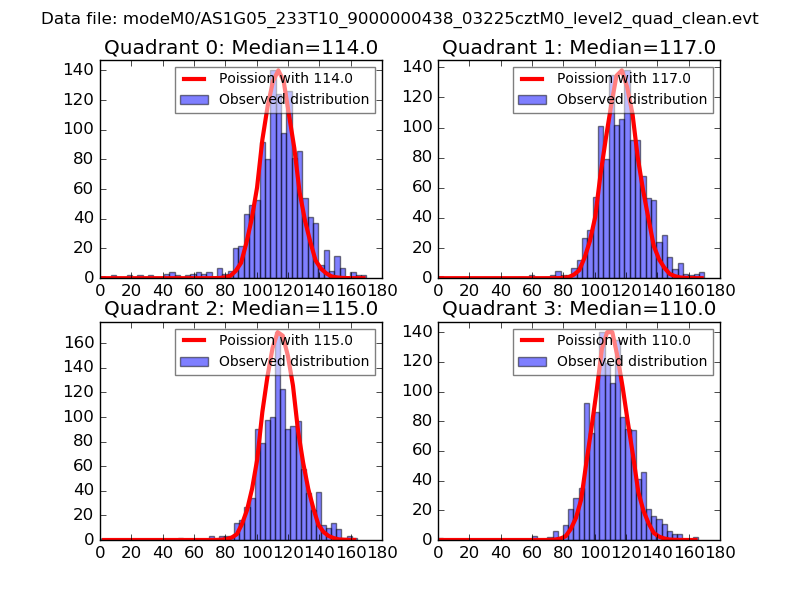 |
 |
| Quadrant-wise count rates Data is divided into 100 sec bins |
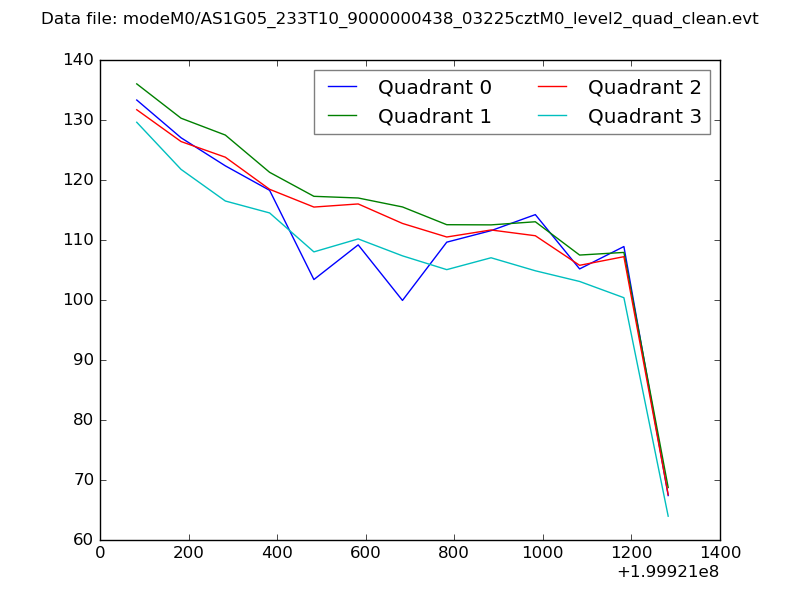 |
|
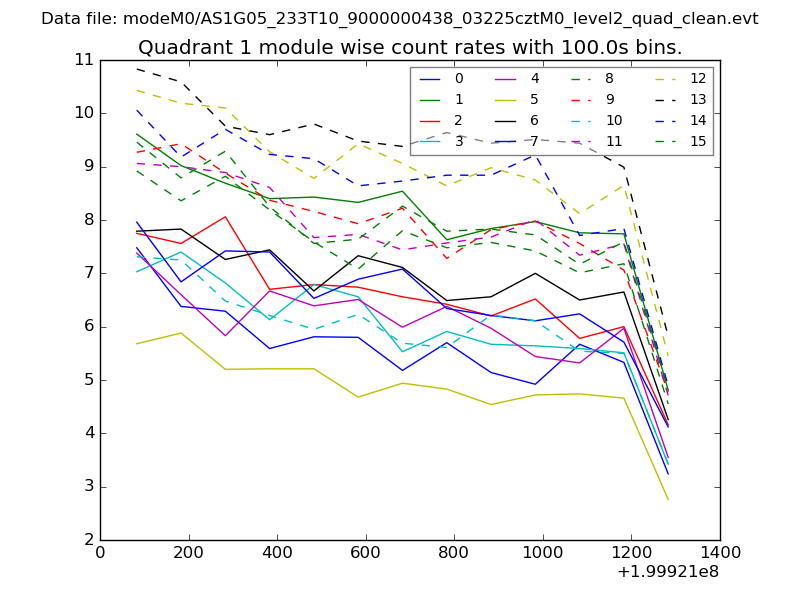
| Module-wise count rates for Quadrant A Data is divided into 100 sec bins |
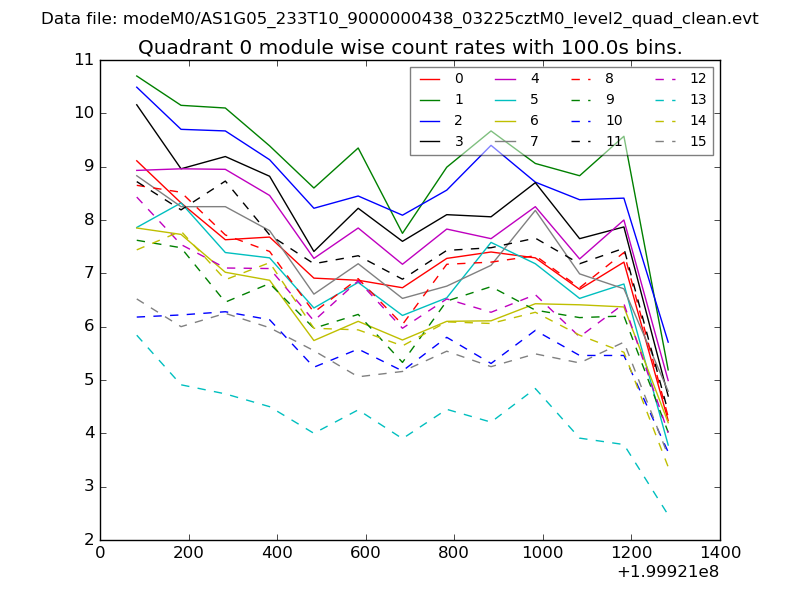 |
 |
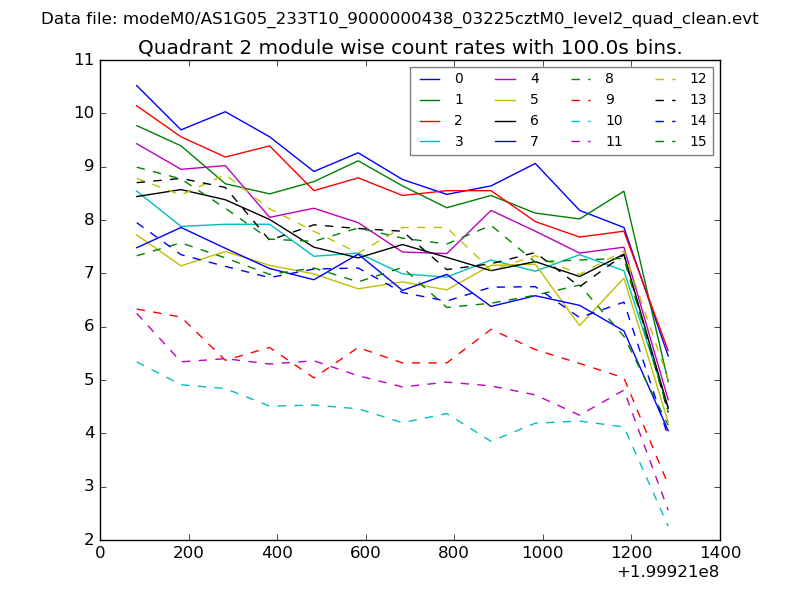
| Module-wise count rates for Quadrant B Data is divided into 100 sec bins |
 |
 |
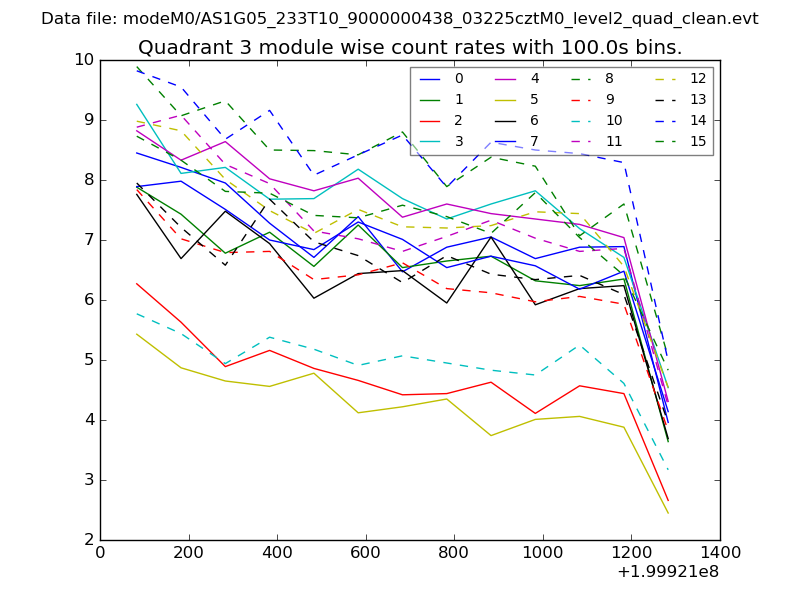
| Module-wise count rates for Quadrant C Data is divided into 100 sec bins |
 |
 |
| Module-wise count rates for Quadrant D Data is divided into 100 sec bins |
 |
 |
| Parameter | Plot |
|---|---|
| CZT HV Monitor | 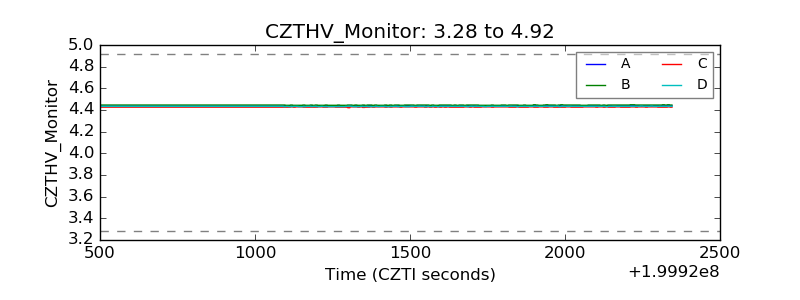 |
| D_VDD | 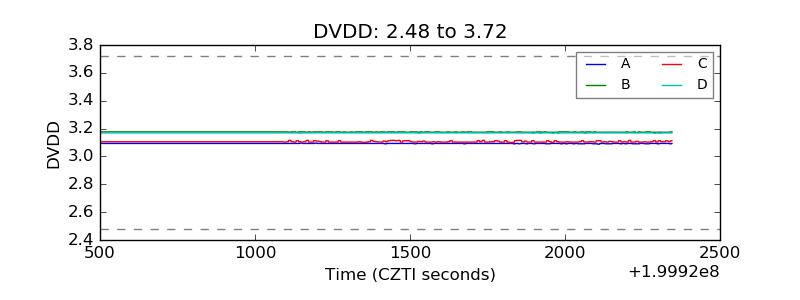 |
| Temperature 1 | 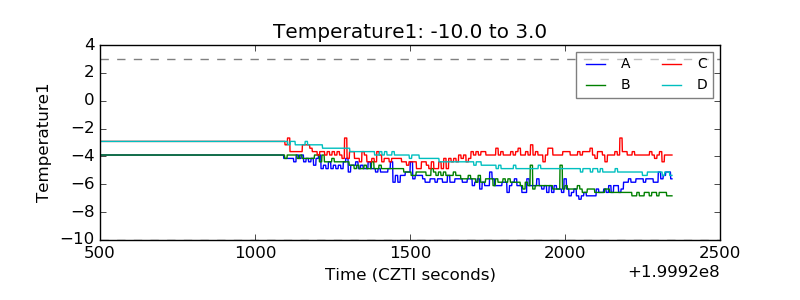 |
| Veto HV Monitor | 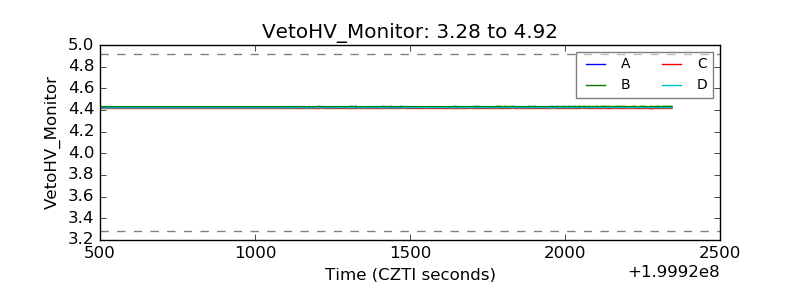 |
| Veto LLD | 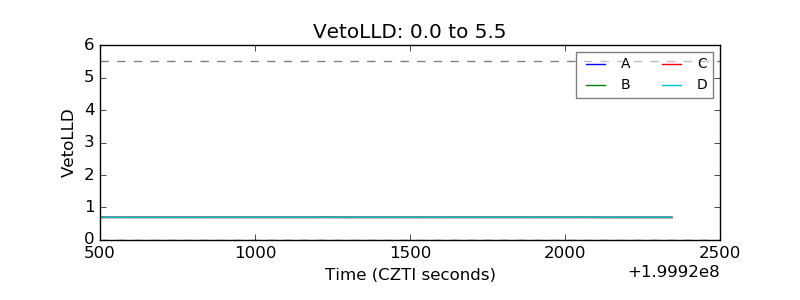 |
| Alpha Counter | 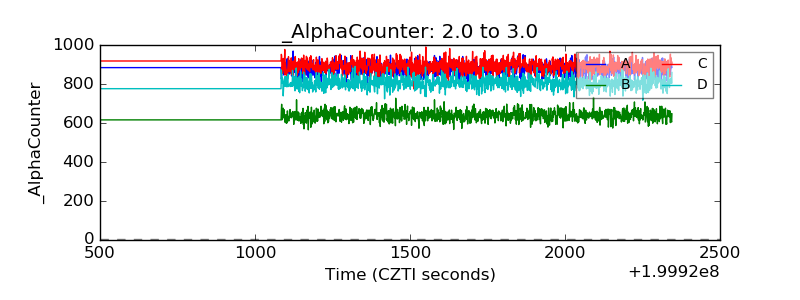 |
| _CPM_Rate | 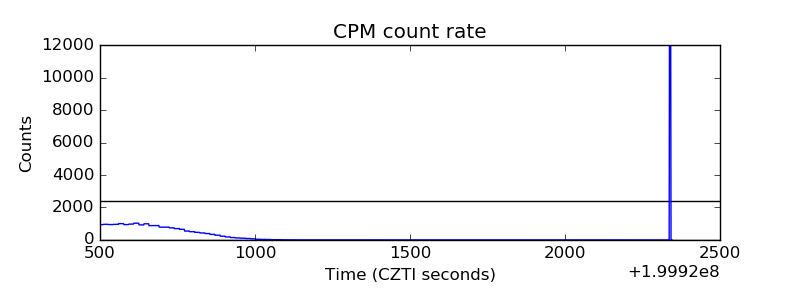 |
| CZT Counter | 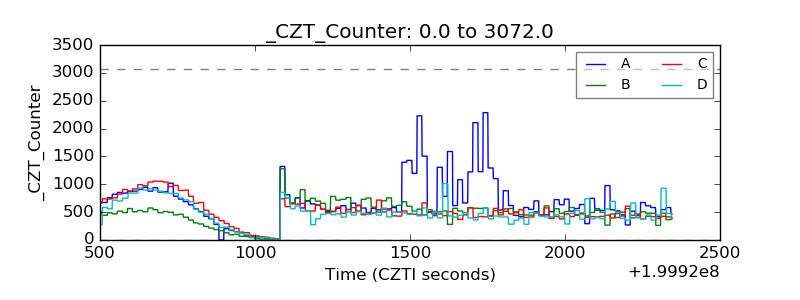 |
| +2.5 Volts monitor | 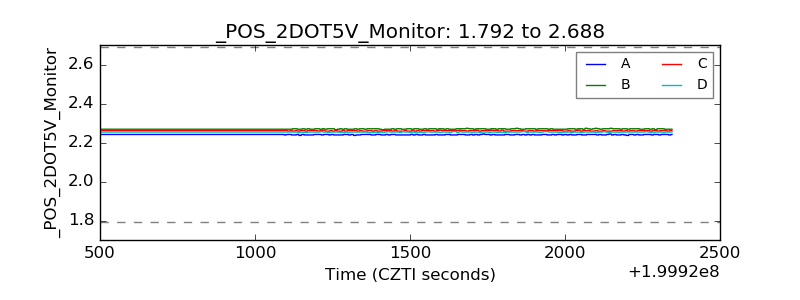 |
| +5 Volts monitor |  |
| Veto Counter | 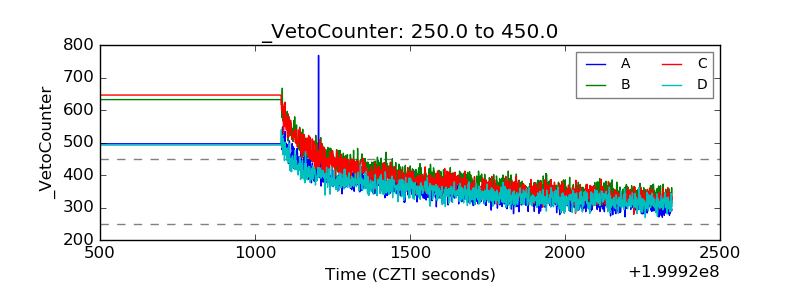 |