| Param | Original file | Final file |
|---|---|---|
| Filename | modeM0/AS1SLEW_01234_9000000437_03198cztM0_level2.evt | modeM0/AS1SLEW_01234_9000000437_03198cztM0_level2_quad_clean.evt |
| Size (bytes) | 54,656,640 | 13,561,920 |
| Size | 52.1 MB | 12.9 MB |
| Events in quadrant A | 317,295 | 88,851 |
| Events in quadrant B | 323,748 | 90,047 |
| Events in quadrant C | 639,640 | 86,281 |
| Events in quadrant D | 319,926 | 84,712 |
| Mode M0 | |||
|---|---|---|---|
| Quadrant | BADHDUFLAG | Total packets | Discarded packets |
| A | 0 | 1530 | 0 |
| B | 0 | 1543 | 0 |
| C | 0 | 2449 | 0 |
| D | 0 | 1563 | 0 |
| Mode SS | |||
|---|---|---|---|
| Quadrant | BADHDUFLAG | Total packets | Discarded packets |
| A | 0 | 14 | 0 |
| B | 0 | 14 | 0 |
| C | 0 | 14 | 0 |
| D | 0 | 14 | 0 |
| Quadrant | Total seconds | Saturated seconds | Saturation percentage |
|---|---|---|---|
| A | 759 | 1 | 0.131752% |
| B | 759 | 0 | 0.000000% |
| C | 759 | 3 | 0.395257% |
| D | 759 | 2 | 0.263505% |
Noise dominated data is calculated using 1-second bins in cleaned event files. If a bin has >2000 counts, and if more than 50% of those come from <1% of pixels, then it is considered to be noise-dominated and hence unusable.
| Quadrant | # 1 sec bins | Bins with >0 counts | Bins with >2000 counts | High rate bins dominated by noise | Noise dominated (total time) | Noise dominated (detector-on time) | Marked lightcurve |
|---|---|---|---|---|---|---|---|
| A | 759 | 759 | 0 | 0 | 0.00% | 0.00% | 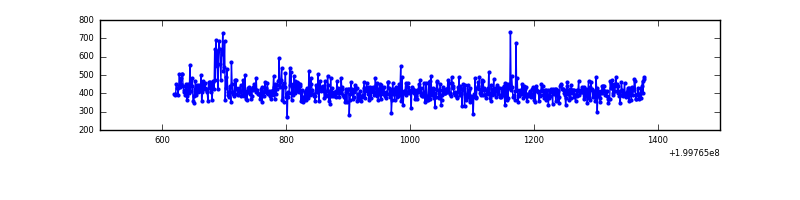 |
| B | 759 | 759 | 0 | 0 | 0.00% | 0.00% | 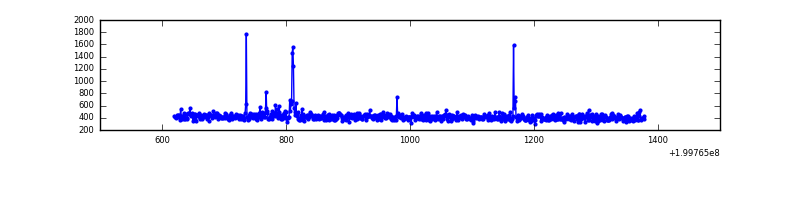 |
| C | 759 | 759 | 4 | 4 | 0.53% | 0.53% | 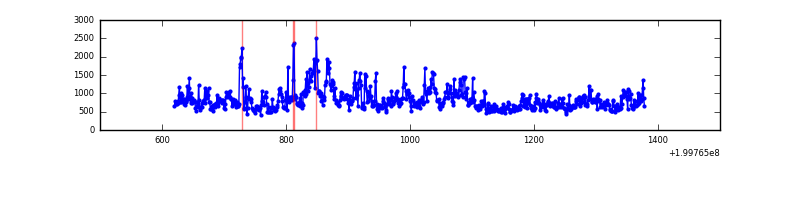 |
| D | 759 | 759 | 2 | 2 | 0.26% | 0.26% | 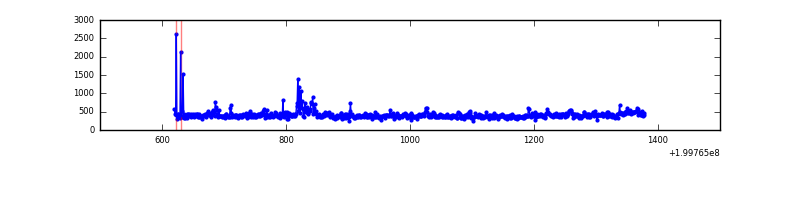 |
Top three noisy pixels from each quadrant. If the there are fewer than three noisy pixels in the level2.evt file, extra rows are filled as -1
| Pixel properties | Quadrant properties | ||||||
|---|---|---|---|---|---|---|---|
| Quadrant | DetID | PixID | Counts | Sigma | Mean | Median | Sigma |
| A | 3 | 1 | 4365 | 232.87 | 80 | 78 | 18.4 |
| A | 0 | 118 | 2703 | 142.59 | 80 | 78 | 18.4 |
| A | 0 | 226 | 1040 | 52.26 | 80 | 78 | 18.4 |
| B | 5 | 70 | 8134 | 455.2 | 81 | 80 | 17.7 |
| B | 4 | 81 | 2324 | 126.83 | 81 | 80 | 17.7 |
| B | 12 | 111 | 978 | 50.75 | 81 | 80 | 17.7 |
| C | 12 | 206 | 273422 | 13760.58 | 77 | 77 | 19.9 |
| C | 14 | 223 | 24664 | 1237.74 | 77 | 77 | 19.9 |
| C | 6 | 80 | 17220 | 863.0 | 77 | 77 | 19.9 |
| D | 13 | 223 | 24667 | 1236.19 | 75 | 73 | 19.9 |
| D | 13 | 239 | 4037 | 199.25 | 75 | 73 | 19.9 |
| D | 6 | 17 | 3712 | 182.91 | 75 | 73 | 19.9 |
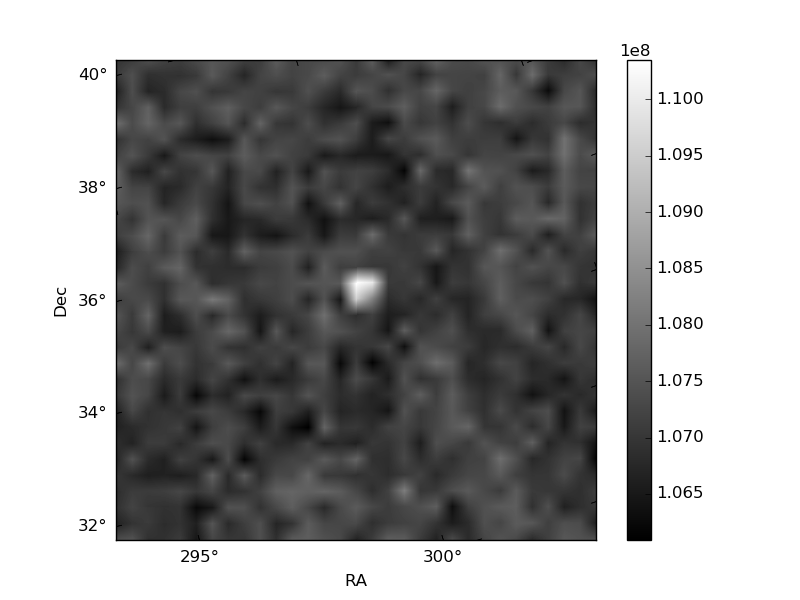
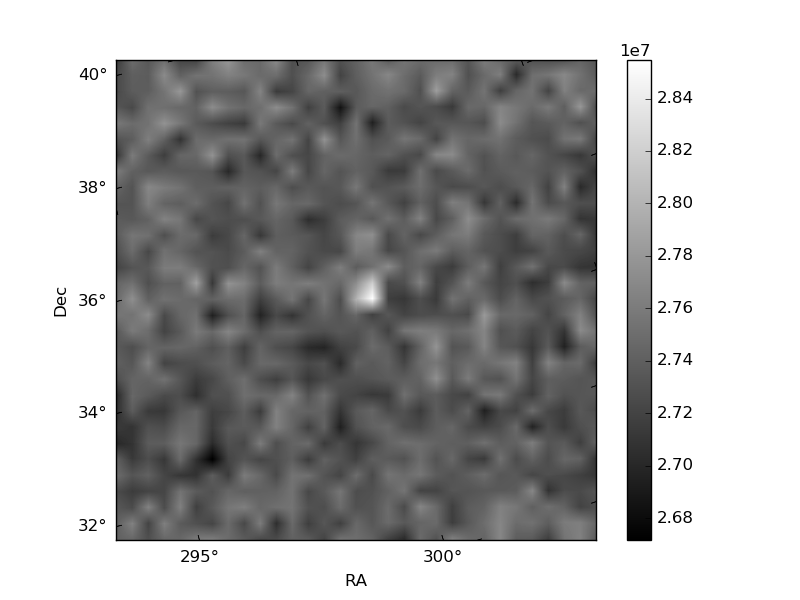
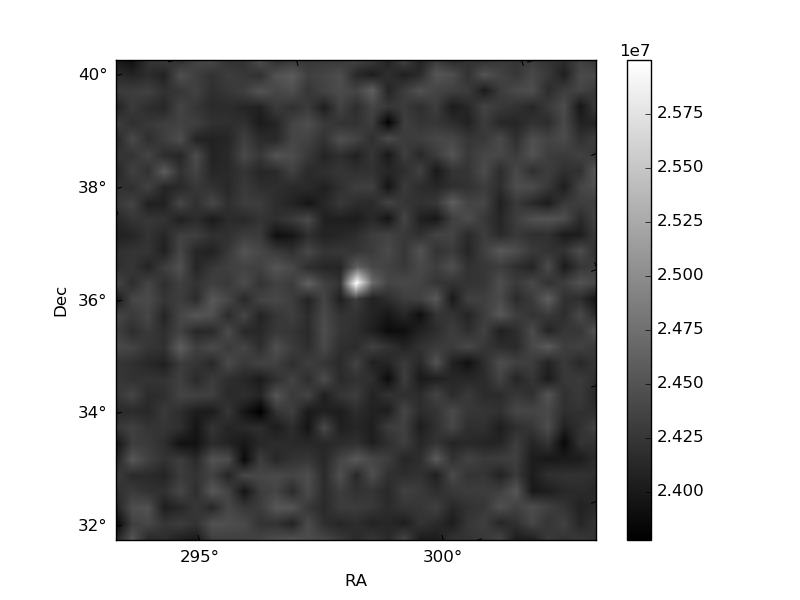
Histogram calculated using DETX and DETY for each event in the final _common_clean file
| Quadrant A | 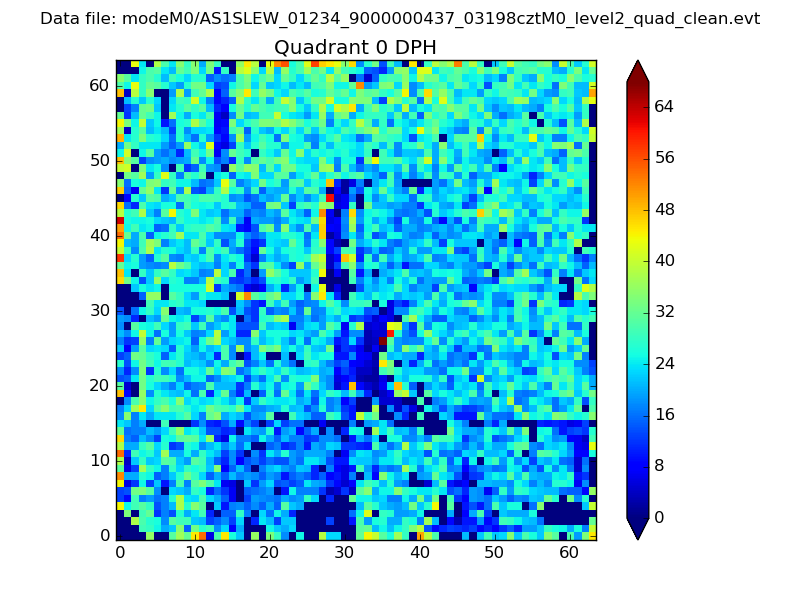 |
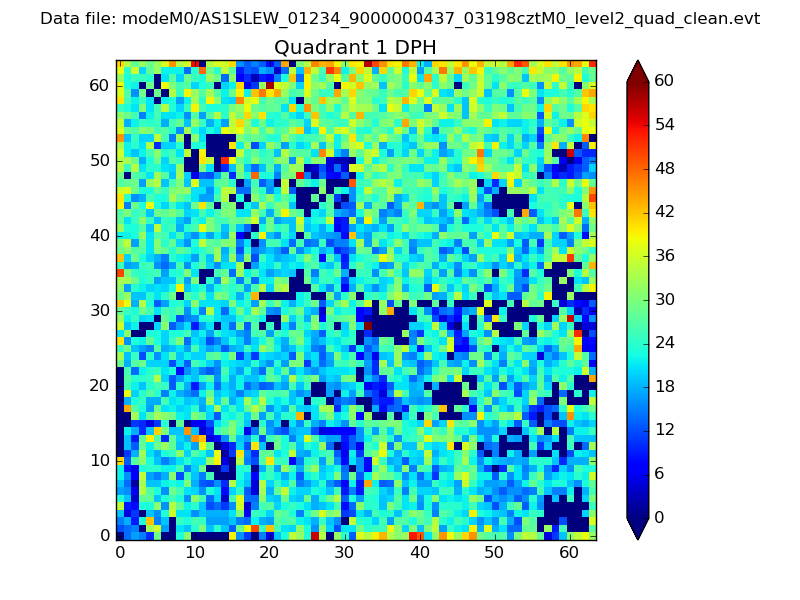 |
Quadrant B |
|---|---|---|---|
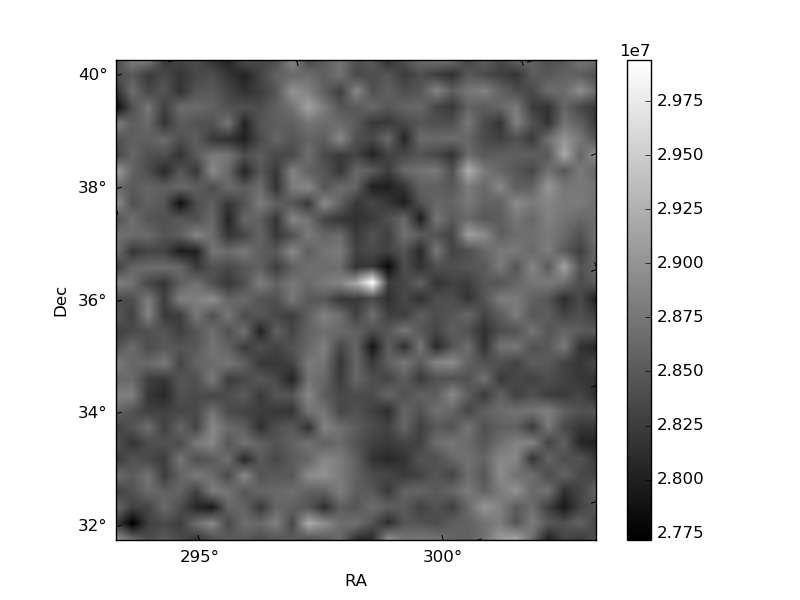
| Quadrant D | 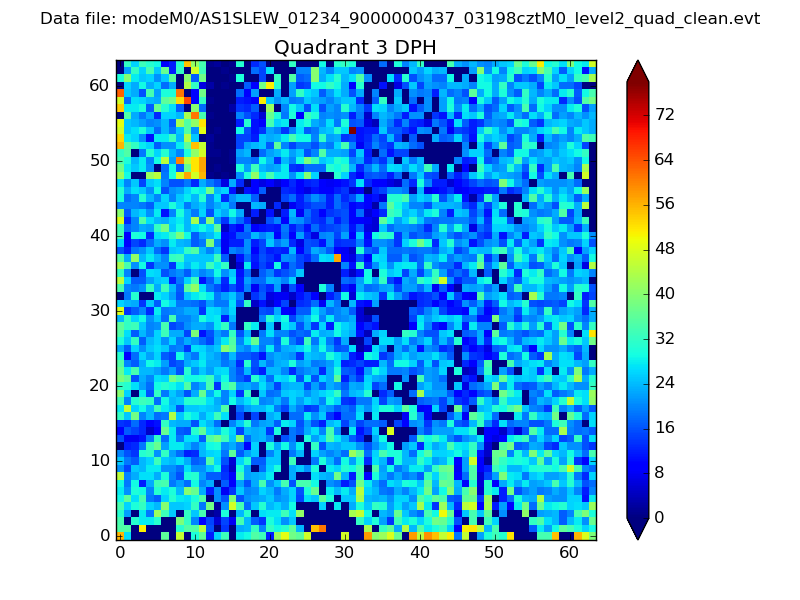 |
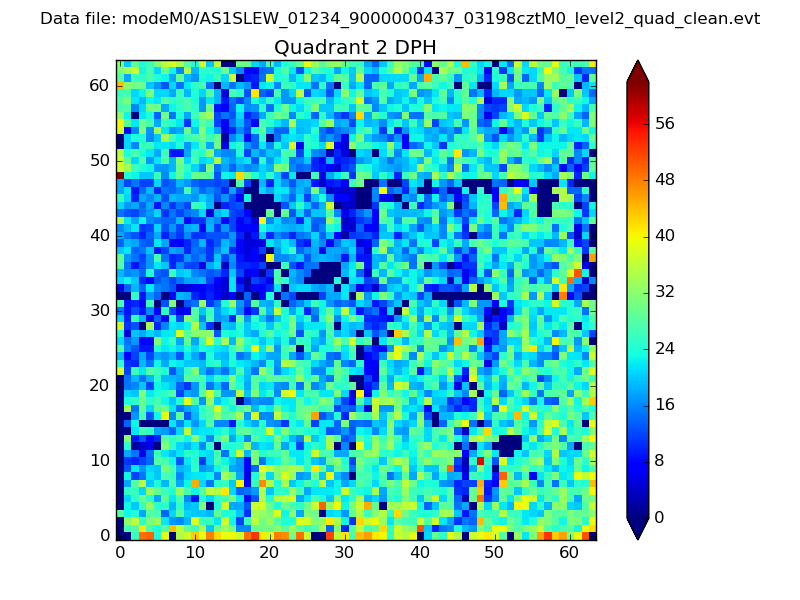 |
Quadrant C |
| Plot type | Count rate plots | Images |
|---|---|---|
| Comparison with Poisson distribution Blue bars denote a histogram of data divided into 1 sec bins. Red curve is a Poisson curve with rate = median count rate of data. |
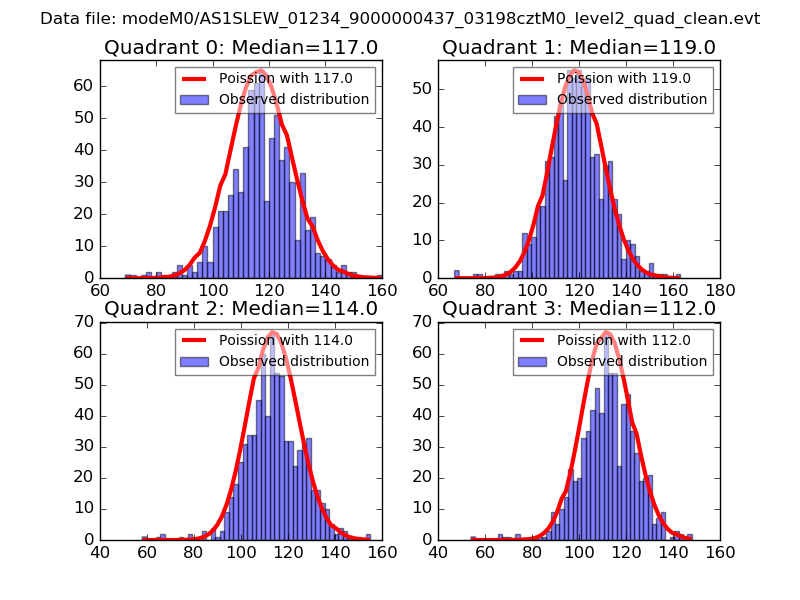 |
 |
| Quadrant-wise count rates Data is divided into 100 sec bins |
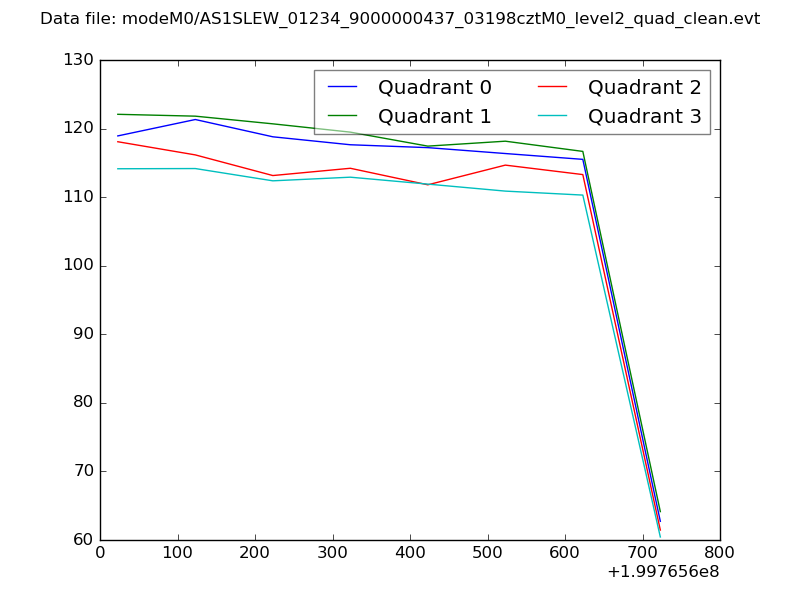 |
|
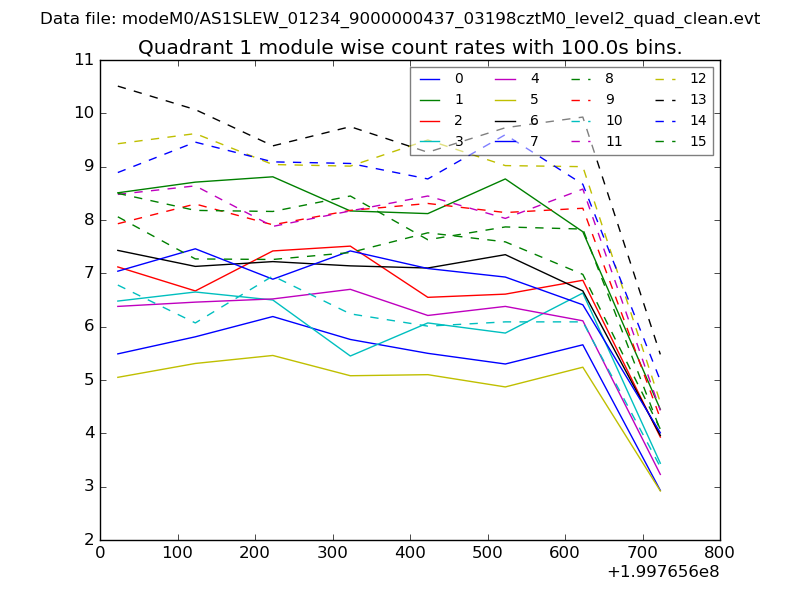
| Module-wise count rates for Quadrant A Data is divided into 100 sec bins |
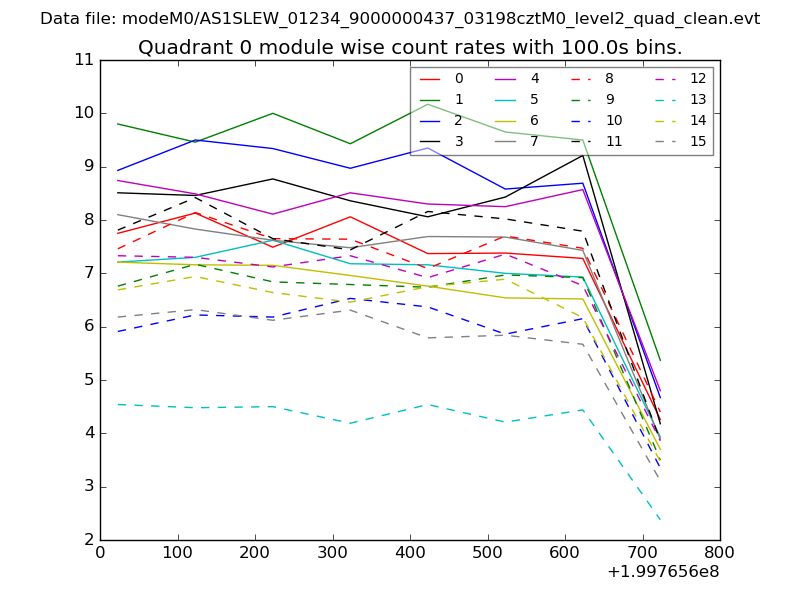 |
 |
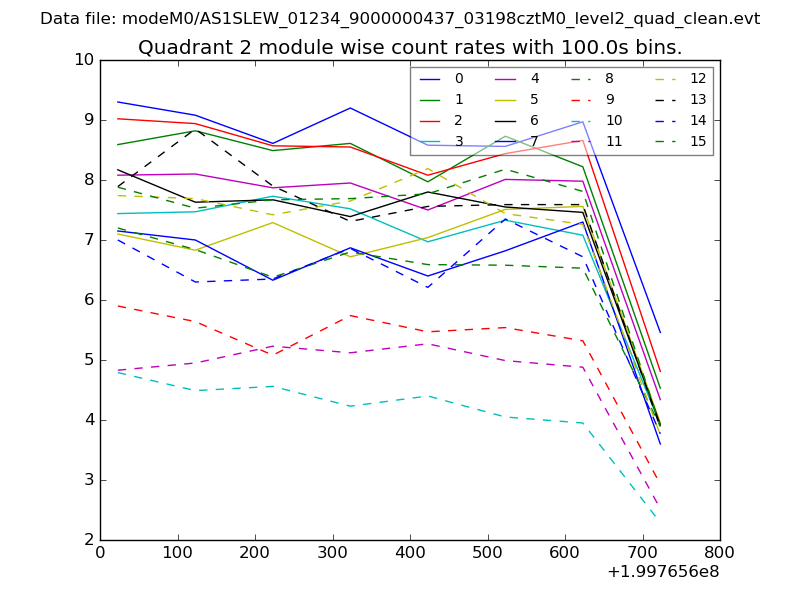
| Module-wise count rates for Quadrant B Data is divided into 100 sec bins |
 |
 |
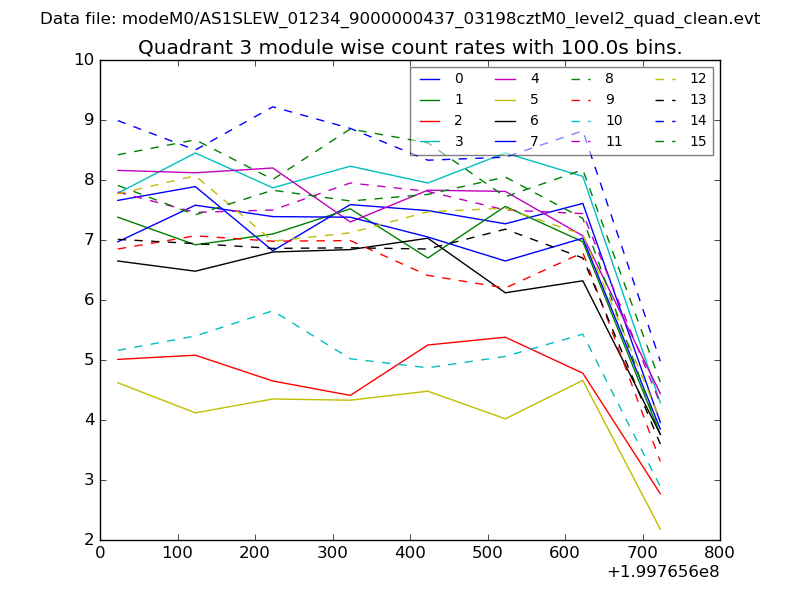
| Module-wise count rates for Quadrant C Data is divided into 100 sec bins |
 |
 |
| Module-wise count rates for Quadrant D Data is divided into 100 sec bins |
 |
 |
| Parameter | Plot |
|---|---|
| CZT HV Monitor | 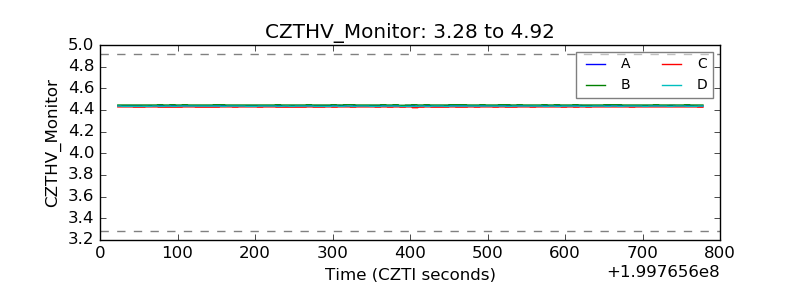 |
| D_VDD | 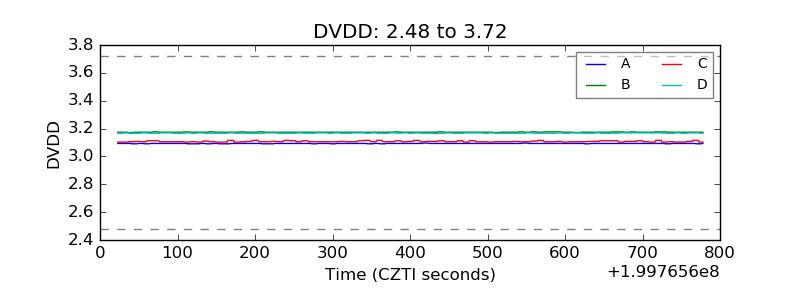 |
| Temperature 1 | 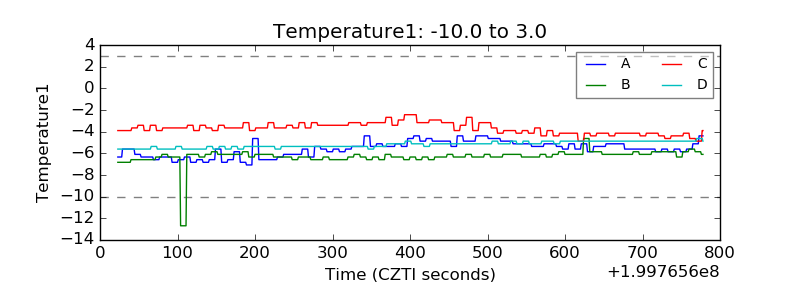 |
| Veto HV Monitor | 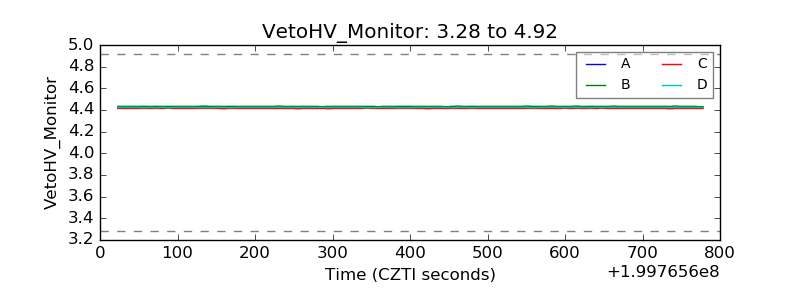 |
| Veto LLD | 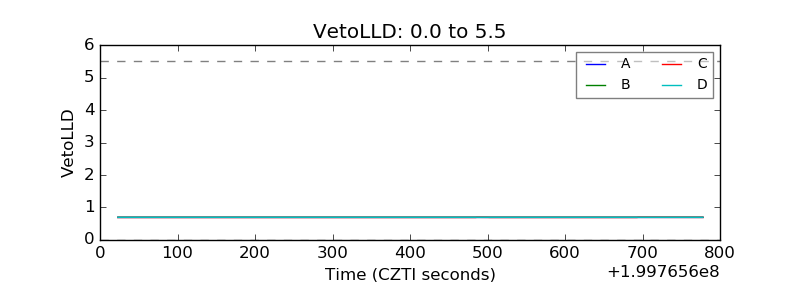 |
| Alpha Counter | 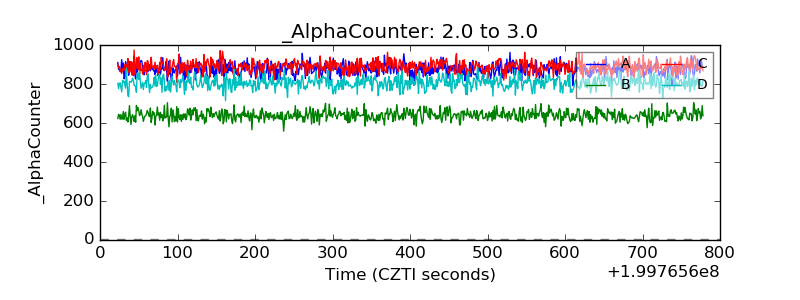 |
| _CPM_Rate | 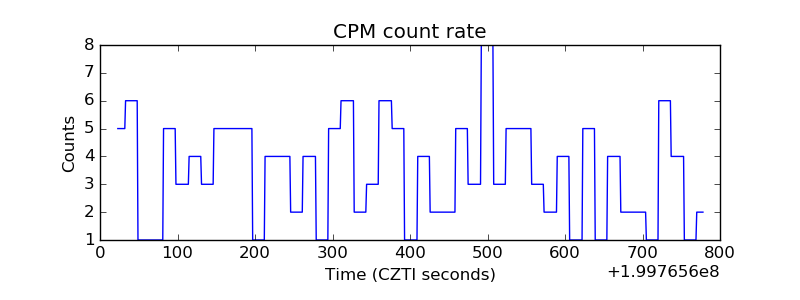 |
| CZT Counter | 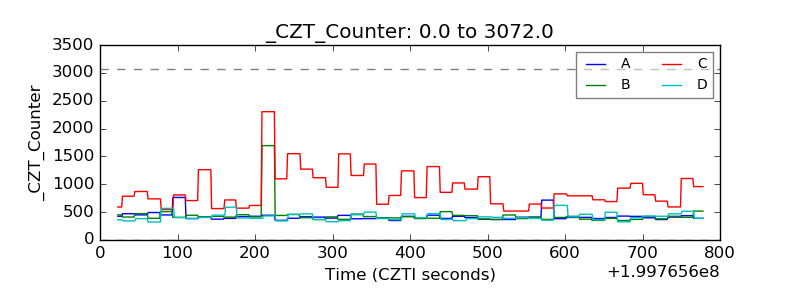 |
| +2.5 Volts monitor |  |
| +5 Volts monitor |  |
| Veto Counter | 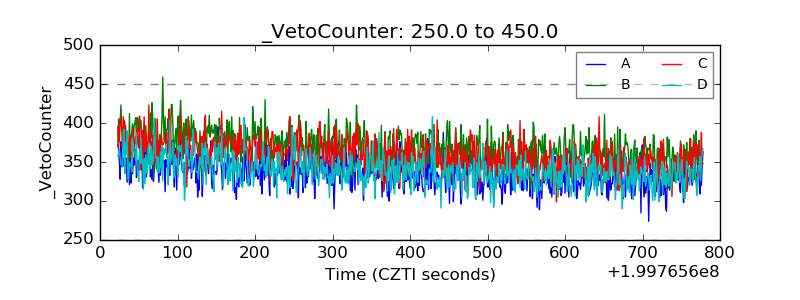 |