| Param | Original file | Final file |
|---|---|---|
| Filename | modeM0/AS1G05_221T01_9000000438_03231cztM0_level2.evt | modeM0/AS1G05_221T01_9000000438_03231cztM0_level2_quad_clean.evt |
| Size (bytes) | 566,032,320 | 77,932,800 |
| Size | 539.8 MB | 74.3 MB |
| Events in quadrant A | 4,017,410 | 463,551 |
| Events in quadrant B | 4,103,506 | 476,074 |
| Events in quadrant C | 4,985,362 | 478,732 |
| Events in quadrant D | 3,569,804 | 462,778 |
| Mode SS | |||
|---|---|---|---|
| Quadrant | BADHDUFLAG | Total packets | Discarded packets |
| A | 0 | 152 | 0 |
| B | 0 | 152 | 0 |
| C | 0 | 152 | 0 |
| D | 0 | 152 | 0 |
| Mode M0 | |||
|---|---|---|---|
| Quadrant | BADHDUFLAG | Total packets | Discarded packets |
| A | 0 | 17234 | 3 |
| B | 0 | 16481 | 2 |
| C | 0 | 20103 | 2 |
| D | 0 | 16189 | 2 |
| Mode M9 | |||
|---|---|---|---|
| Quadrant | BADHDUFLAG | Total packets | Discarded packets |
| A | 0 | 12 | 0 |
| B | 0 | 12 | 0 |
| C | 0 | 12 | 0 |
| D | 0 | 12 | 0 |
| Quadrant | Total seconds | Saturated seconds | Saturation percentage |
|---|---|---|---|
| A | 7357 | 444 | 6.035069% |
| B | 7357 | 274 | 3.724344% |
| C | 7357 | 842 | 11.444882% |
| D | 7357 | 210 | 2.854424% |
Noise dominated data is calculated using 1-second bins in cleaned event files. If a bin has >2000 counts, and if more than 50% of those come from <1% of pixels, then it is considered to be noise-dominated and hence unusable.
| Quadrant | # 1 sec bins | Bins with >0 counts | Bins with >2000 counts | High rate bins dominated by noise | Noise dominated (total time) | Noise dominated (detector-on time) | Marked lightcurve |
|---|---|---|---|---|---|---|---|
| A | 8572 | 7357 | 191 | 191 | 2.23% | 2.60% | 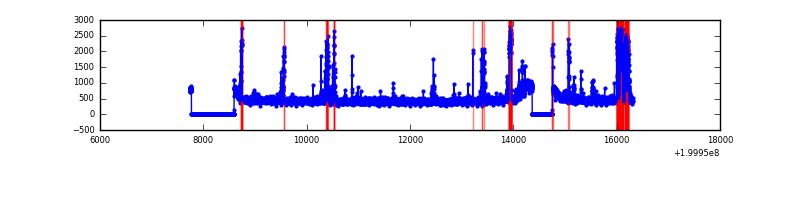 |
| B | 8572 | 7357 | 29 | 29 | 0.34% | 0.39% | 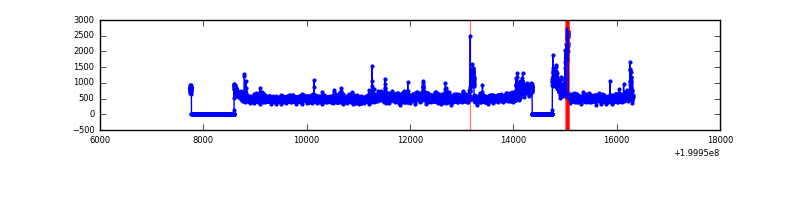 |
| C | 8572 | 7357 | 602 | 602 | 7.02% | 8.18% | 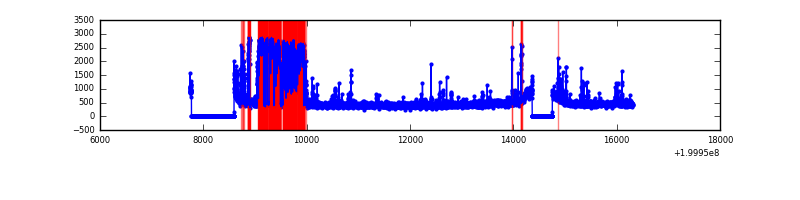 |
| D | 8572 | 7357 | 22 | 22 | 0.26% | 0.30% | 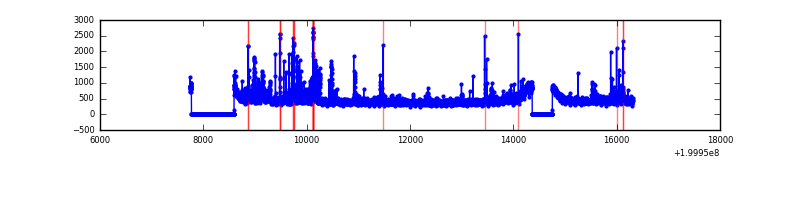 |
Top three noisy pixels from each quadrant. If the there are fewer than three noisy pixels in the level2.evt file, extra rows are filled as -1
| Pixel properties | Quadrant properties | ||||||
|---|---|---|---|---|---|---|---|
| Quadrant | DetID | PixID | Counts | Sigma | Mean | Median | Sigma |
| A | 0 | 50 | 583778 | 3366.9 | 840 | 819 | 173.1 |
| A | 0 | 118 | 168176 | 966.58 | 840 | 819 | 173.1 |
| A | 0 | 226 | 23486 | 130.91 | 840 | 819 | 173.1 |
| B | 15 | 204 | 426757 | 2557.01 | 866 | 844 | 166.6 |
| B | 3 | 0 | 234813 | 1404.66 | 866 | 844 | 166.6 |
| B | 5 | 63 | 46574 | 274.54 | 866 | 844 | 166.6 |
| C | 14 | 223 | 1775372 | 9450.89 | 804 | 805 | 187.8 |
| C | 1 | 192 | 29133 | 150.87 | 804 | 805 | 187.8 |
| C | 6 | 80 | 23808 | 122.51 | 804 | 805 | 187.8 |
| D | 13 | 120 | 228995 | 1059.14 | 825 | 802 | 215.5 |
| D | 9 | 85 | 74316 | 341.21 | 825 | 802 | 215.5 |
| D | 13 | 223 | 53630 | 245.2 | 825 | 802 | 215.5 |
Histogram calculated using DETX and DETY for each event in the final _common_clean file
| Quadrant A | 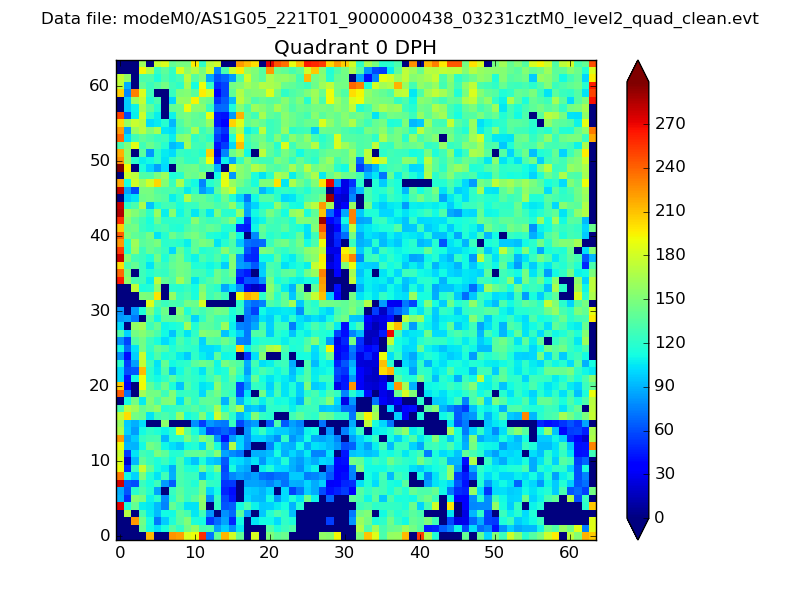 |
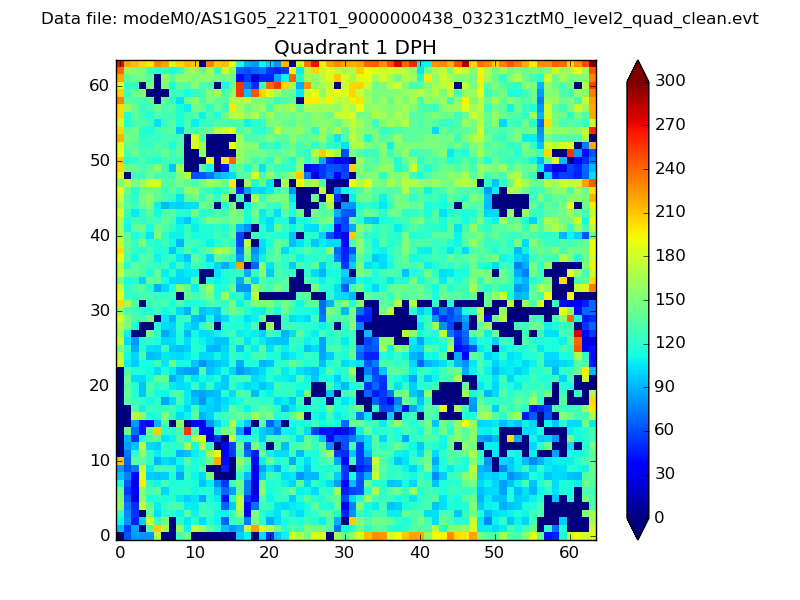 |
Quadrant B |
|---|---|---|---|
| Quadrant D | 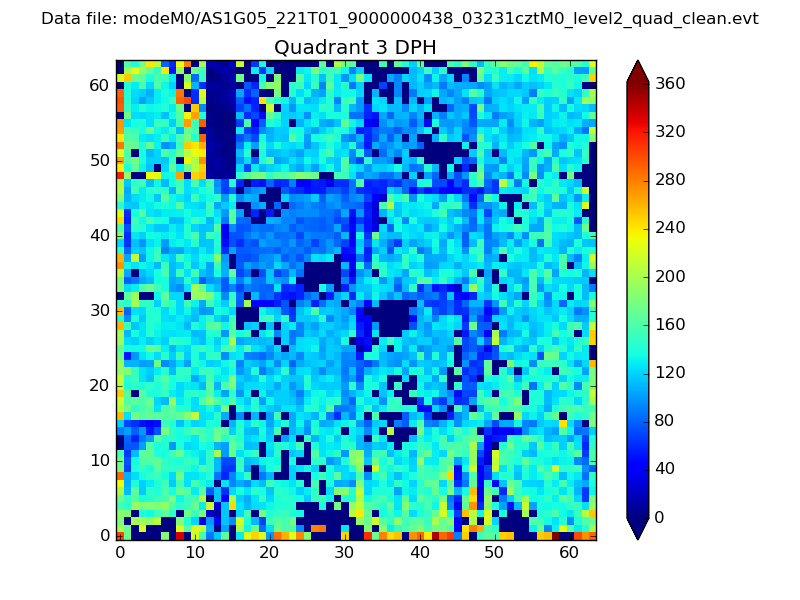 |
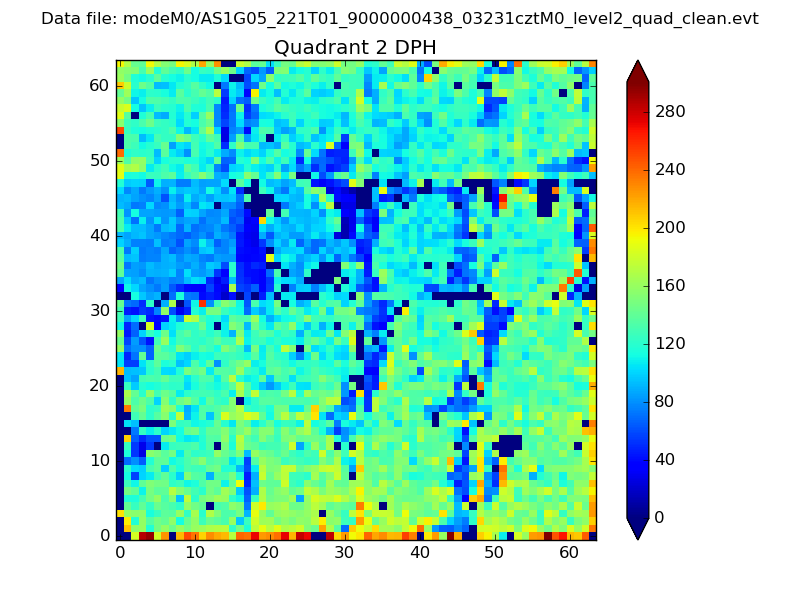 |
Quadrant C |
| Plot type | Count rate plots | Images |
|---|---|---|
| Comparison with Poisson distribution Blue bars denote a histogram of data divided into 1 sec bins. Red curve is a Poisson curve with rate = median count rate of data. |
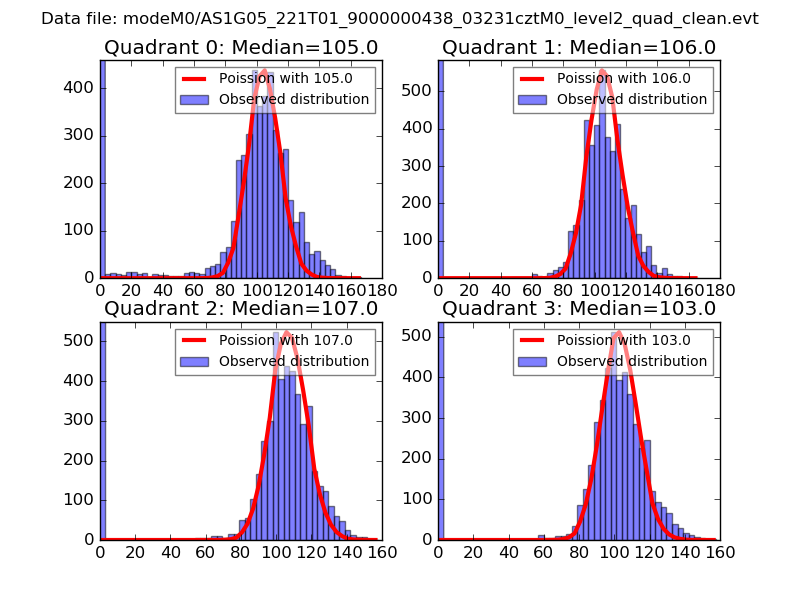 |
 |
| Quadrant-wise count rates Data is divided into 100 sec bins |
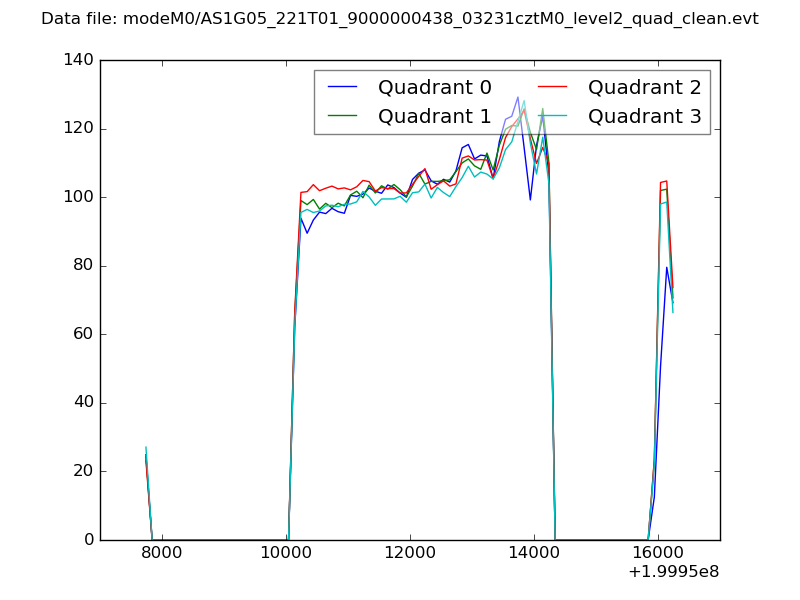 |
|
| Module-wise count rates for Quadrant A Data is divided into 100 sec bins |
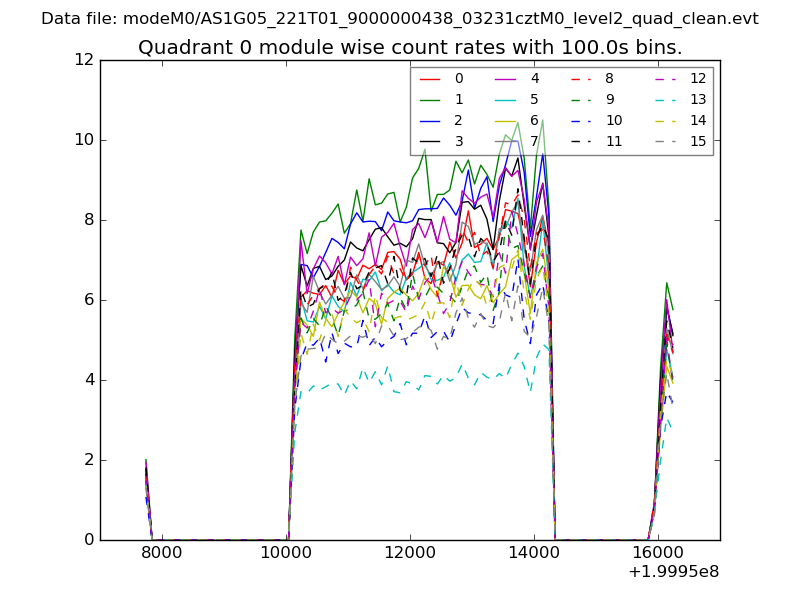 |
 |
| Module-wise count rates for Quadrant B Data is divided into 100 sec bins |
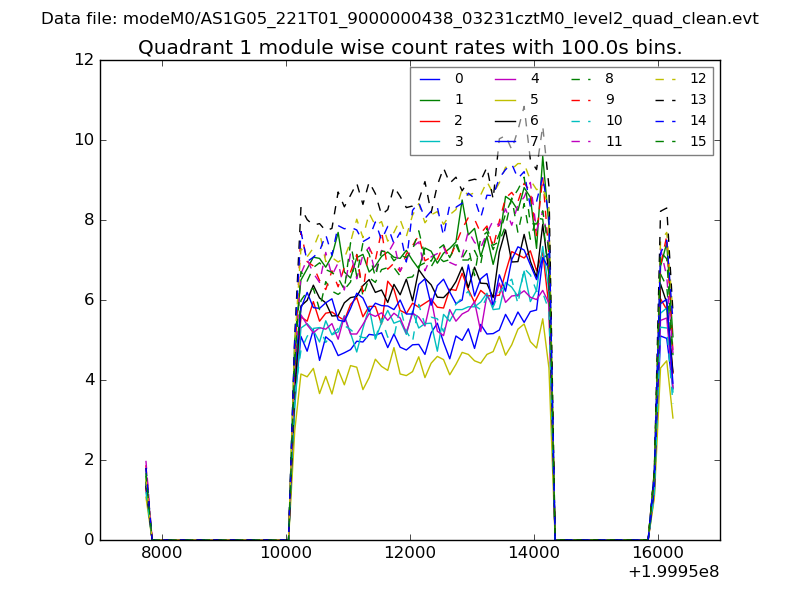 |
 |
| Module-wise count rates for Quadrant C Data is divided into 100 sec bins |
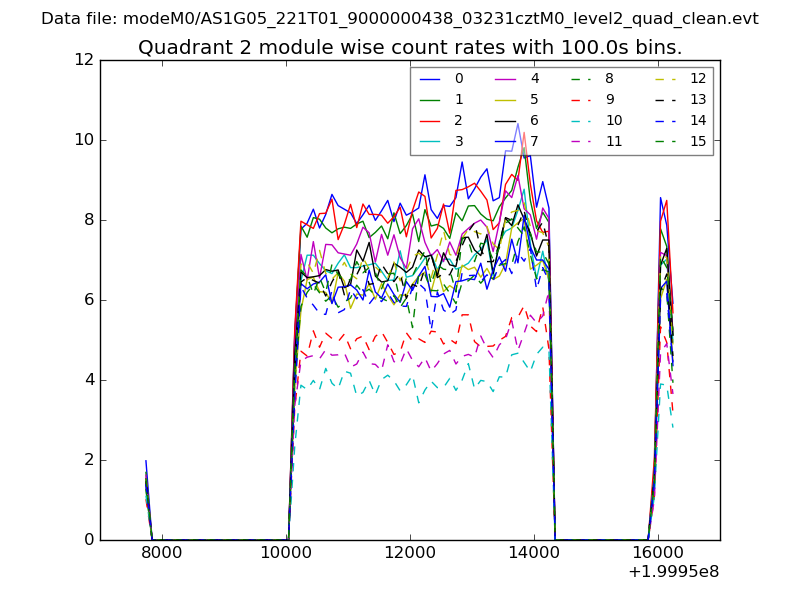 |
 |
| Module-wise count rates for Quadrant D Data is divided into 100 sec bins |
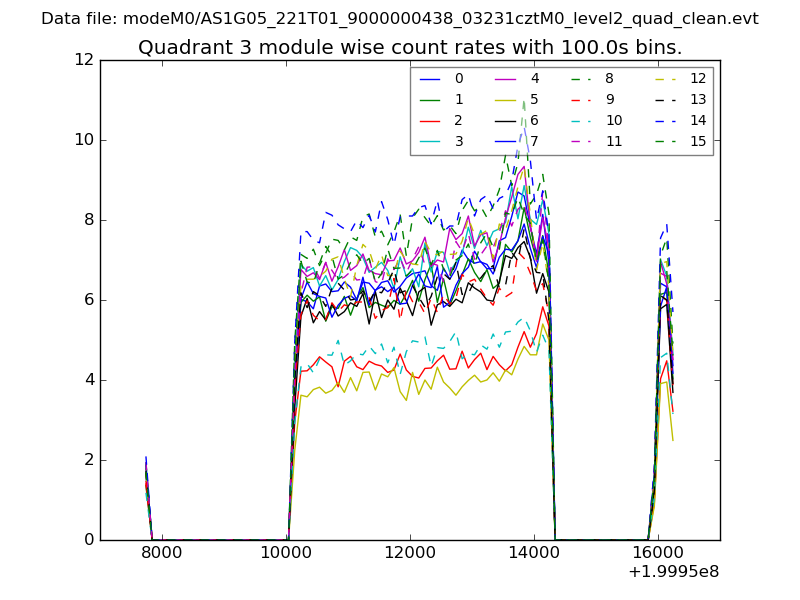 |
 |
| Parameter | Plot |
|---|---|
| CZT HV Monitor | 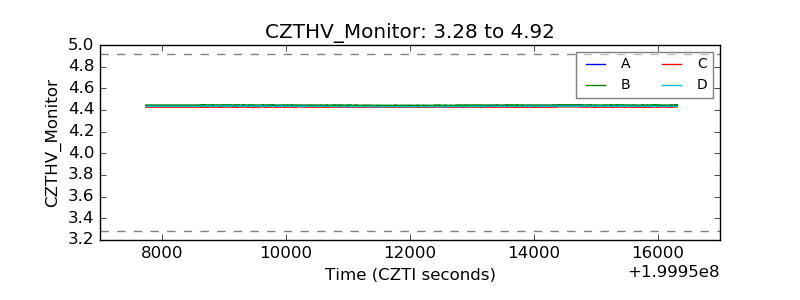 |
| D_VDD | 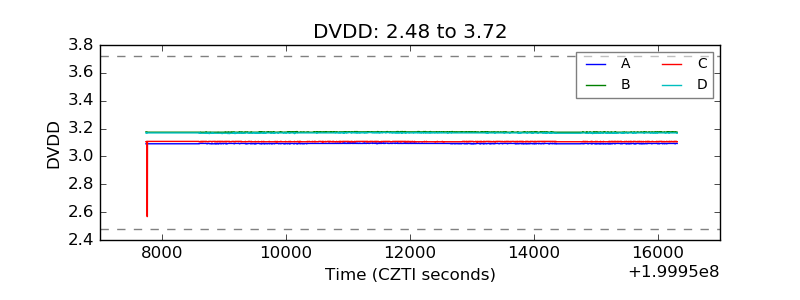 |
| Temperature 1 | 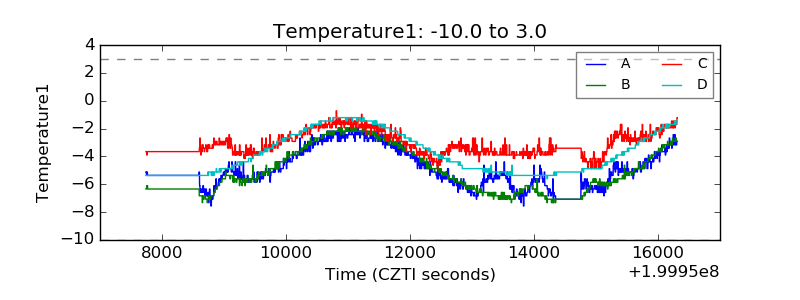 |
| Veto HV Monitor | 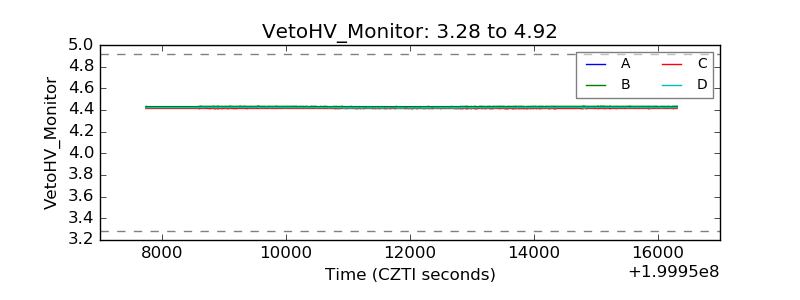 |
| Veto LLD | 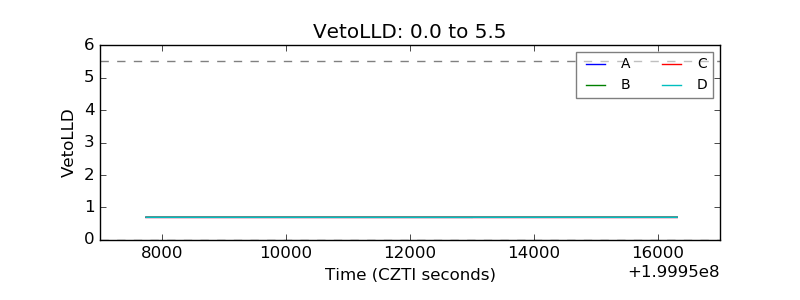 |
| Alpha Counter | 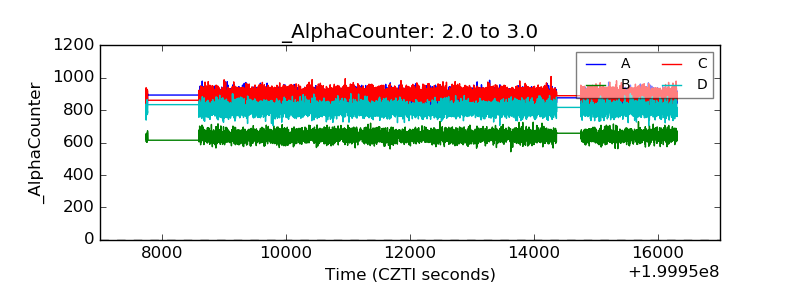 |
| _CPM_Rate | 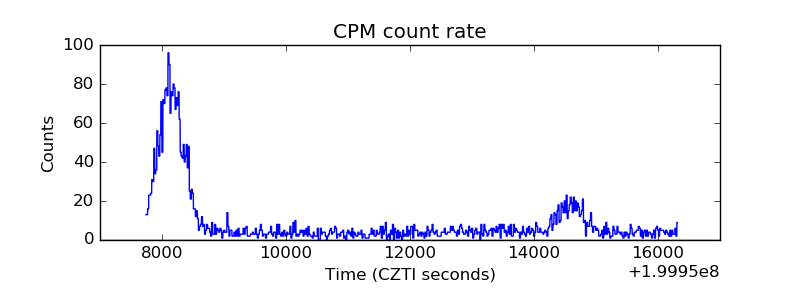 |
| CZT Counter | 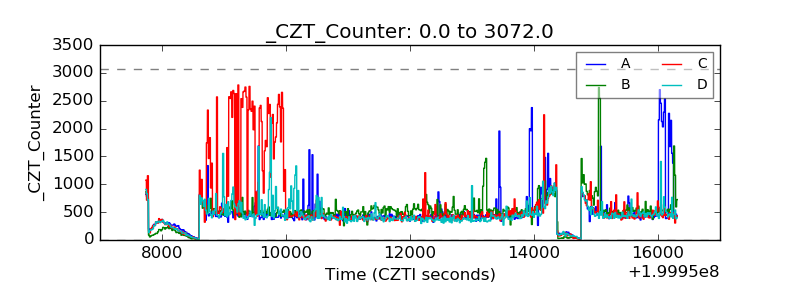 |
| +2.5 Volts monitor |  |
| +5 Volts monitor |  |
| Veto Counter | 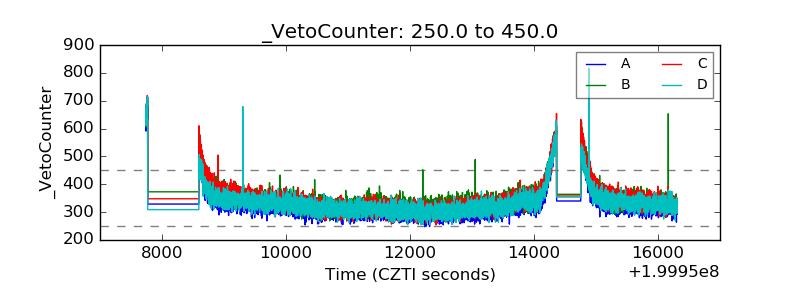 |