| Param | Original file | Final file |
|---|---|---|
| Filename | modeM0/AS1G05_221T01_9000000438_03232cztM0_level2.evt | modeM0/AS1G05_221T01_9000000438_03232cztM0_level2_quad_clean.evt |
| Size (bytes) | 527,659,200 | 83,689,920 |
| Size | 503.2 MB | 79.8 MB |
| Events in quadrant A | 4,046,582 | 499,685 |
| Events in quadrant B | 4,295,914 | 505,281 |
| Events in quadrant C | 3,654,170 | 508,920 |
| Events in quadrant D | 3,465,987 | 490,613 |
| Mode SS | |||
|---|---|---|---|
| Quadrant | BADHDUFLAG | Total packets | Discarded packets |
| A | 0 | 154 | 0 |
| B | 0 | 154 | 0 |
| C | 0 | 154 | 0 |
| D | 0 | 154 | 0 |
| Mode M0 | |||
|---|---|---|---|
| Quadrant | BADHDUFLAG | Total packets | Discarded packets |
| A | 0 | 17522 | 2 |
| B | 0 | 17416 | 1 |
| C | 0 | 16313 | 1 |
| D | 0 | 16062 | 1 |
| Quadrant | Total seconds | Saturated seconds | Saturation percentage |
|---|---|---|---|
| A | 7607 | 473 | 6.217957% |
| B | 7607 | 293 | 3.851716% |
| C | 7607 | 154 | 2.024451% |
| D | 7607 | 159 | 2.090180% |
Noise dominated data is calculated using 1-second bins in cleaned event files. If a bin has >2000 counts, and if more than 50% of those come from <1% of pixels, then it is considered to be noise-dominated and hence unusable.
| Quadrant | # 1 sec bins | Bins with >0 counts | Bins with >2000 counts | High rate bins dominated by noise | Noise dominated (total time) | Noise dominated (detector-on time) | Marked lightcurve |
|---|---|---|---|---|---|---|---|
| A | 7627 | 7607 | 154 | 154 | 2.02% | 2.02% | 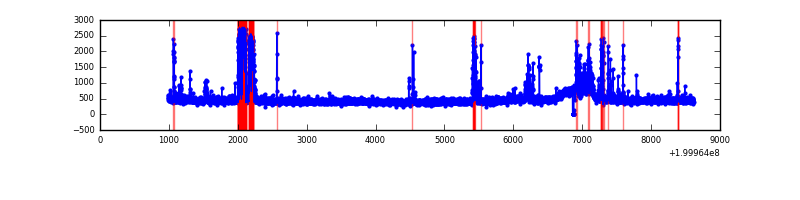 |
| B | 7627 | 7607 | 43 | 43 | 0.56% | 0.57% | 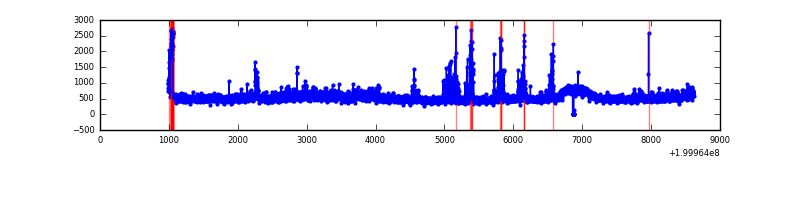 |
| C | 7627 | 7608 | 17 | 17 | 0.22% | 0.22% | 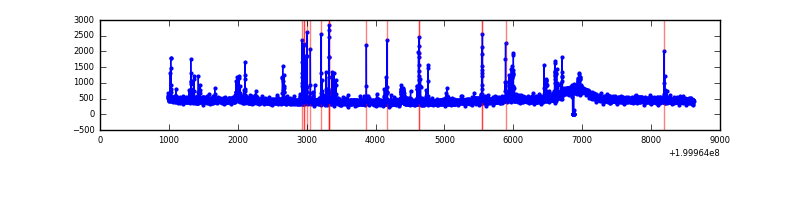 |
| D | 7627 | 7608 | 15 | 15 | 0.20% | 0.20% | 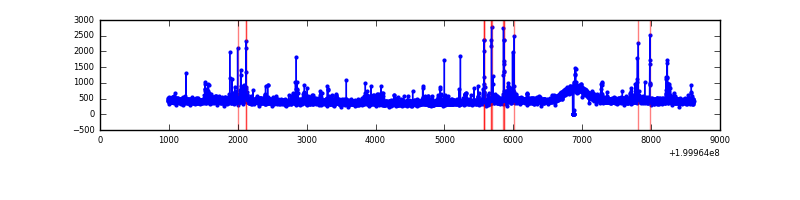 |
Top three noisy pixels from each quadrant. If the there are fewer than three noisy pixels in the level2.evt file, extra rows are filled as -1
| Pixel properties | Quadrant properties | ||||||
|---|---|---|---|---|---|---|---|
| Quadrant | DetID | PixID | Counts | Sigma | Mean | Median | Sigma |
| A | 0 | 50 | 487142 | 2730.78 | 863 | 843 | 178.1 |
| A | 0 | 118 | 206525 | 1154.99 | 863 | 843 | 178.1 |
| A | 0 | 226 | 28050 | 152.78 | 863 | 843 | 178.1 |
| B | 15 | 204 | 532731 | 3097.01 | 888 | 865 | 171.7 |
| B | 2 | 249 | 185115 | 1072.87 | 888 | 865 | 171.7 |
| B | 3 | 0 | 101275 | 584.68 | 888 | 865 | 171.7 |
| C | 14 | 223 | 153729 | 761.38 | 858 | 860 | 200.8 |
| C | 1 | 192 | 63970 | 314.33 | 858 | 860 | 200.8 |
| C | 6 | 80 | 53445 | 261.91 | 858 | 860 | 200.8 |
| D | 13 | 120 | 72968 | 346.72 | 854 | 825 | 208.1 |
| D | 13 | 239 | 47907 | 226.28 | 854 | 825 | 208.1 |
| D | 13 | 223 | 39420 | 185.49 | 854 | 825 | 208.1 |
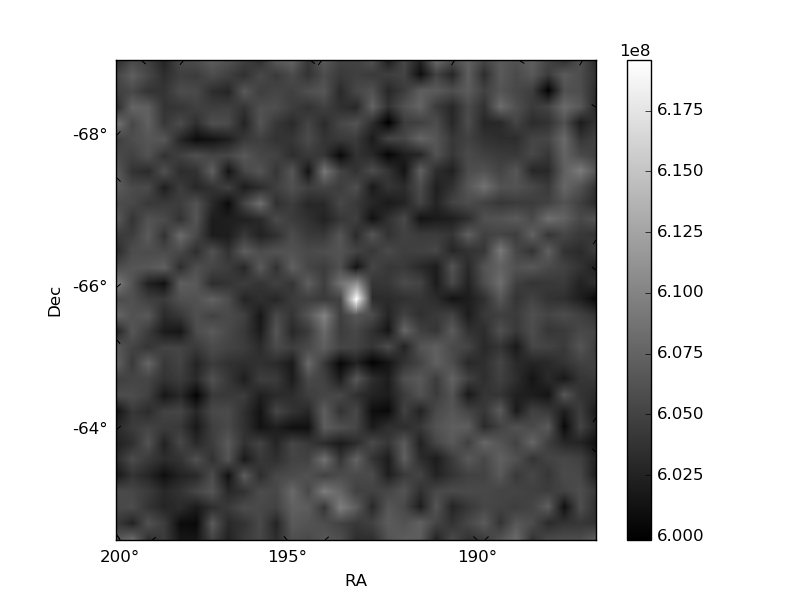
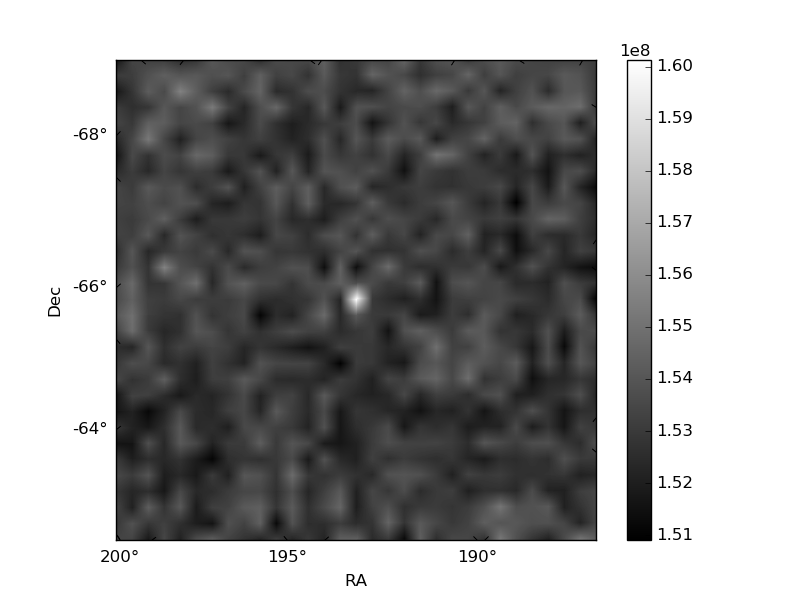
Histogram calculated using DETX and DETY for each event in the final _common_clean file
| Quadrant A | 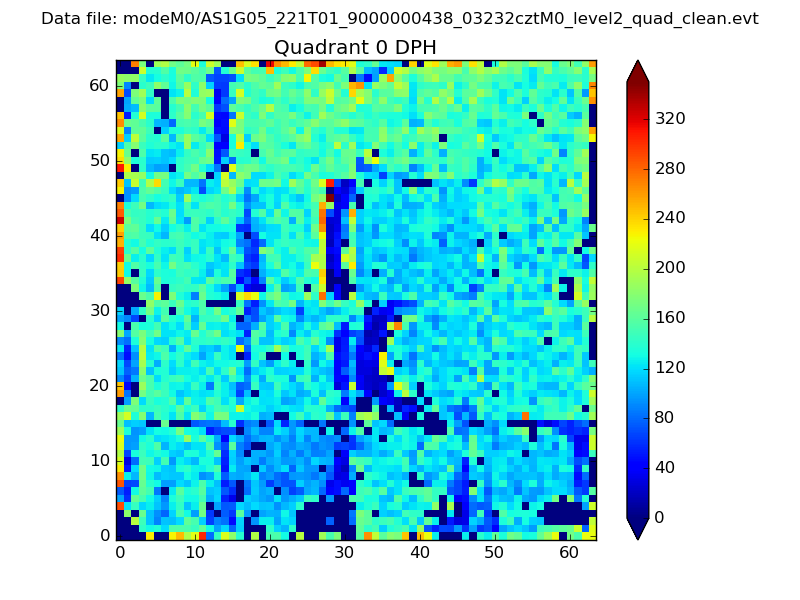 |
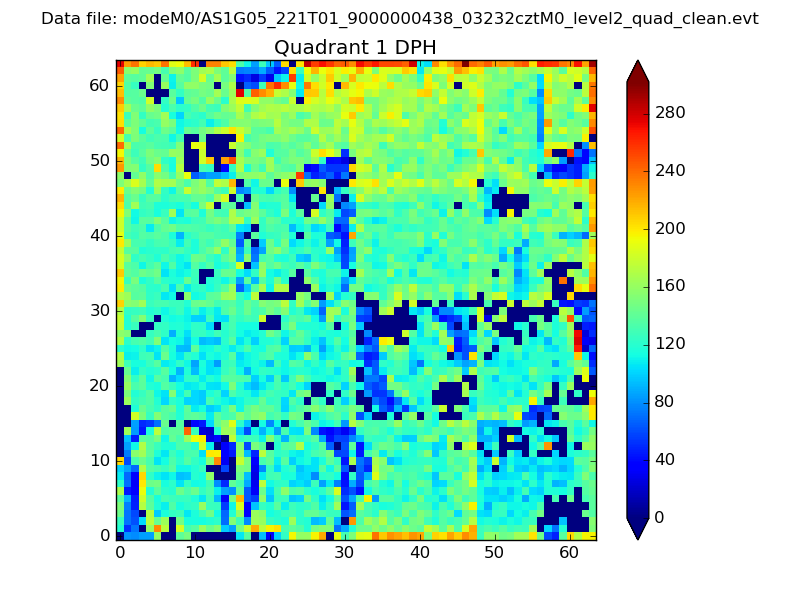 |
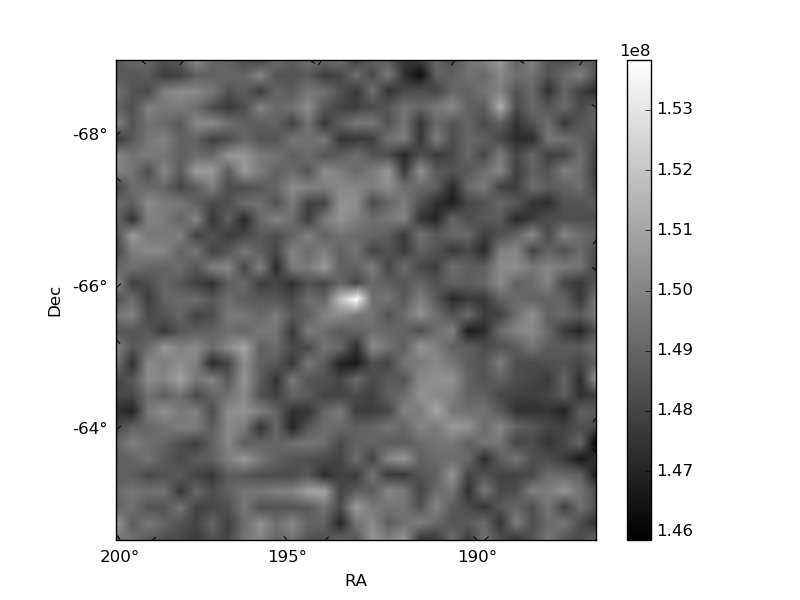
Quadrant B |
|---|---|---|---|
| Quadrant D | 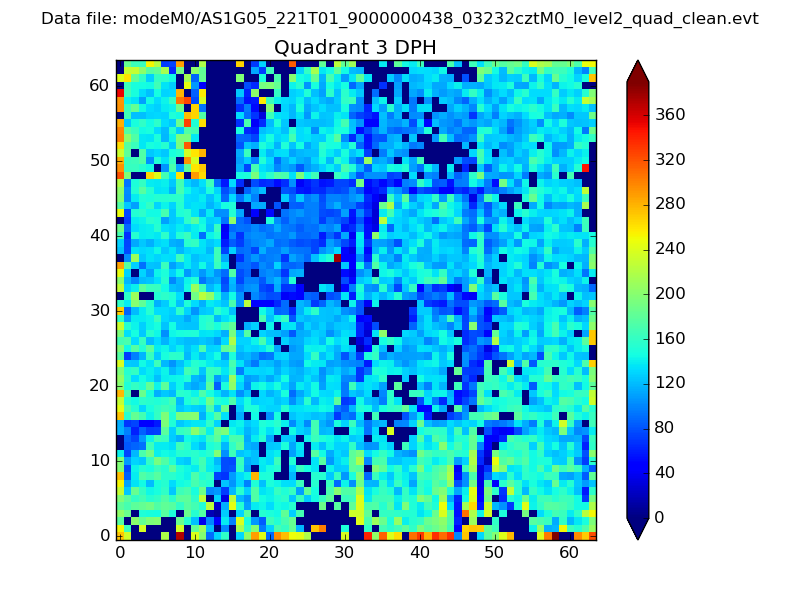 |
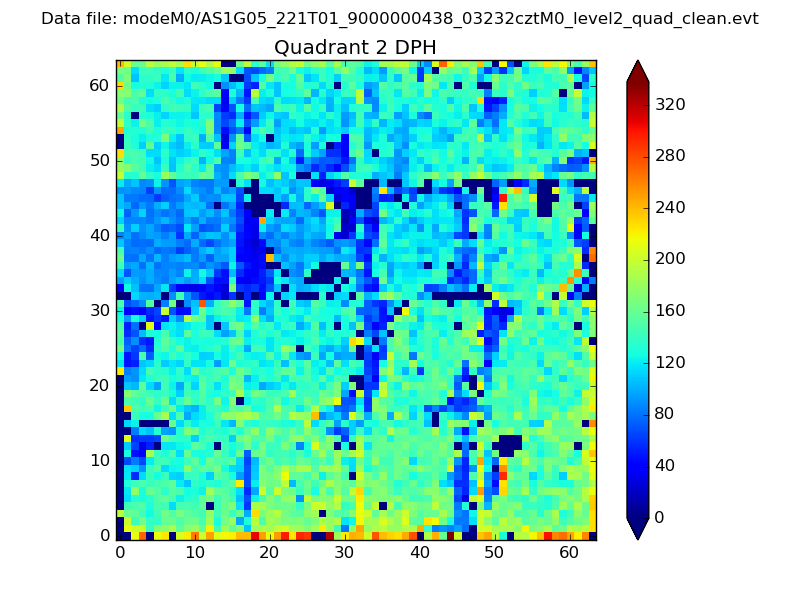 |
Quadrant C |
| Plot type | Count rate plots | Images |
|---|---|---|
| Comparison with Poisson distribution Blue bars denote a histogram of data divided into 1 sec bins. Red curve is a Poisson curve with rate = median count rate of data. |
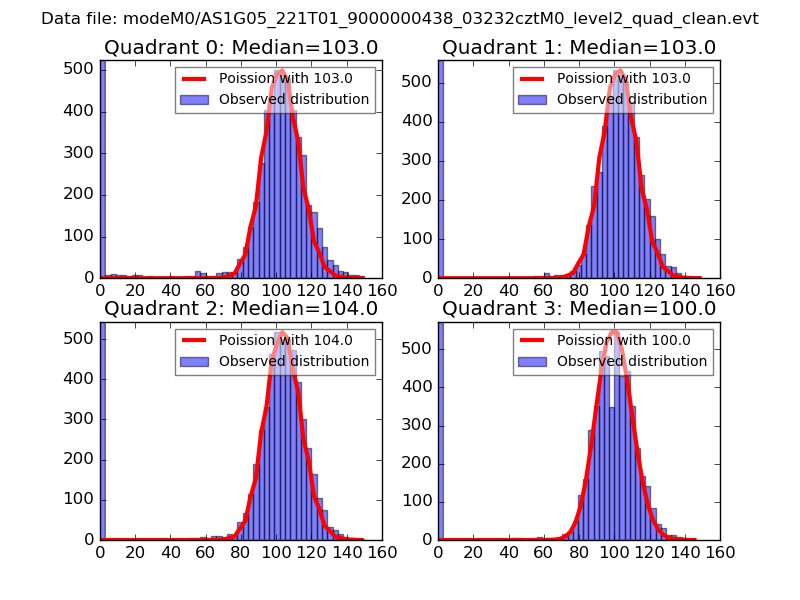 |
 |
| Quadrant-wise count rates Data is divided into 100 sec bins |
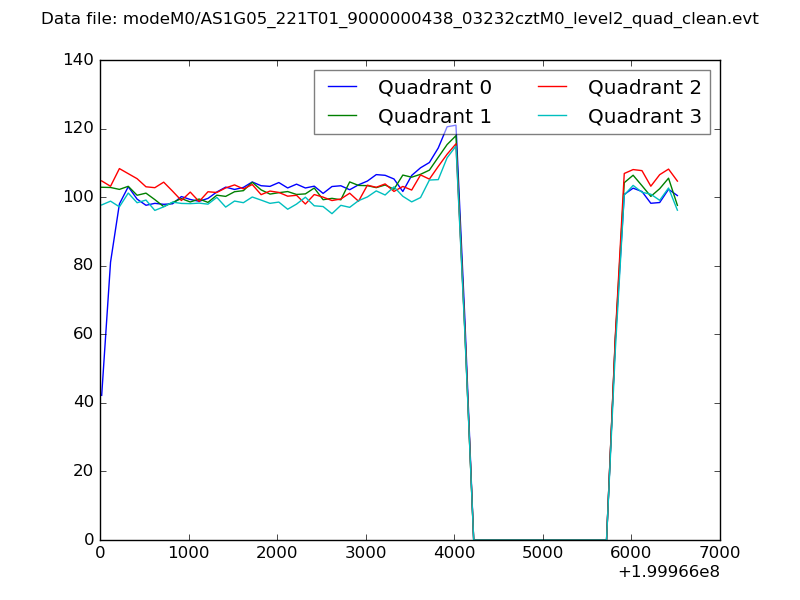 |
|
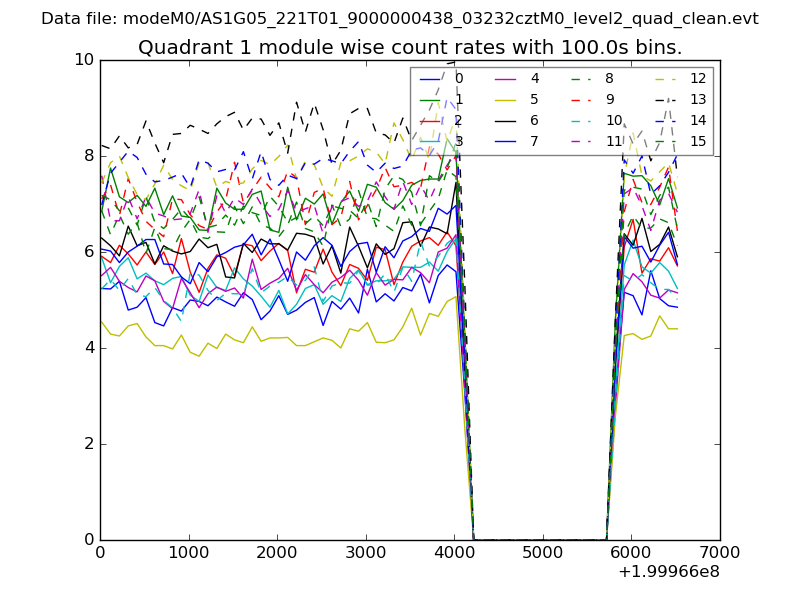
| Module-wise count rates for Quadrant A Data is divided into 100 sec bins |
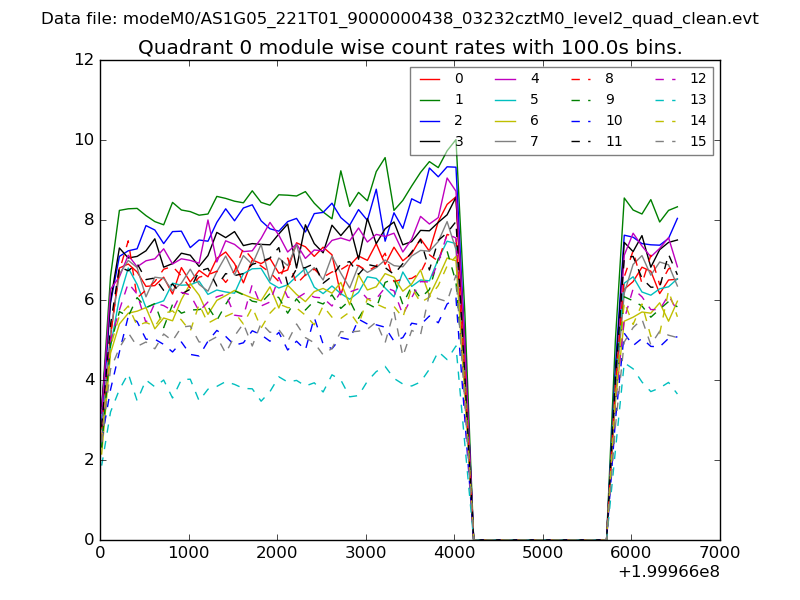 |
 |
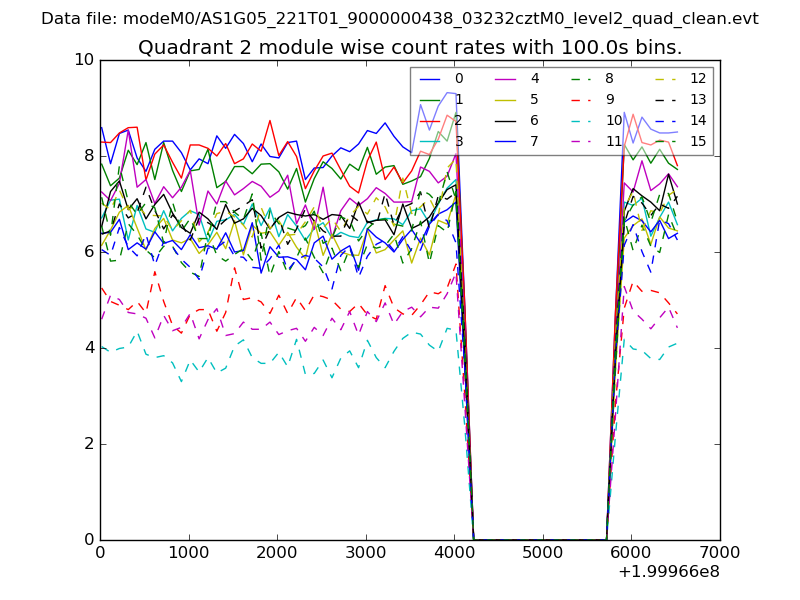
| Module-wise count rates for Quadrant B Data is divided into 100 sec bins |
 |
 |
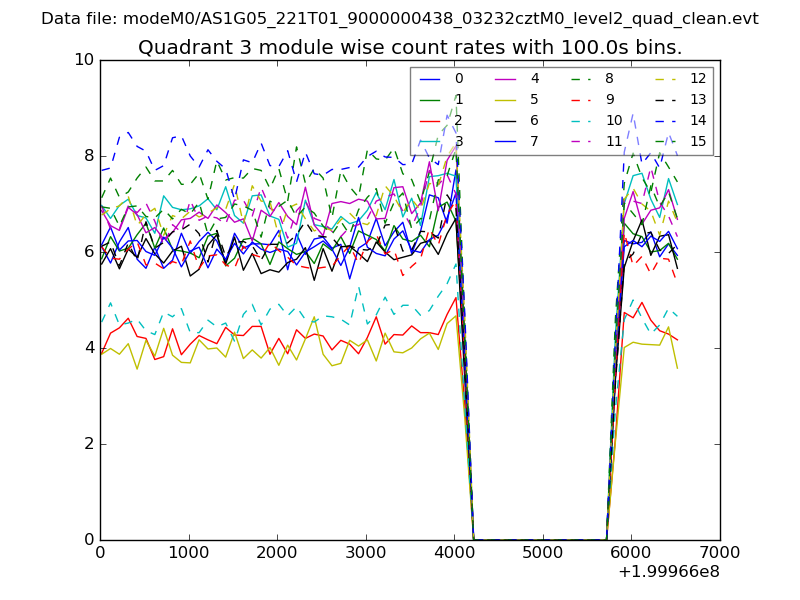
| Module-wise count rates for Quadrant C Data is divided into 100 sec bins |
 |
 |
| Module-wise count rates for Quadrant D Data is divided into 100 sec bins |
 |
 |
| Parameter | Plot |
|---|---|
| CZT HV Monitor | 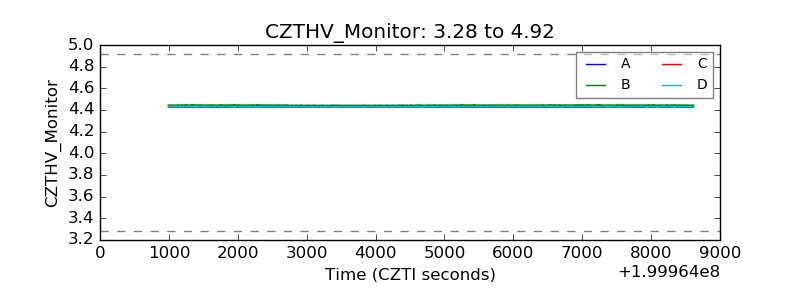 |
| D_VDD | 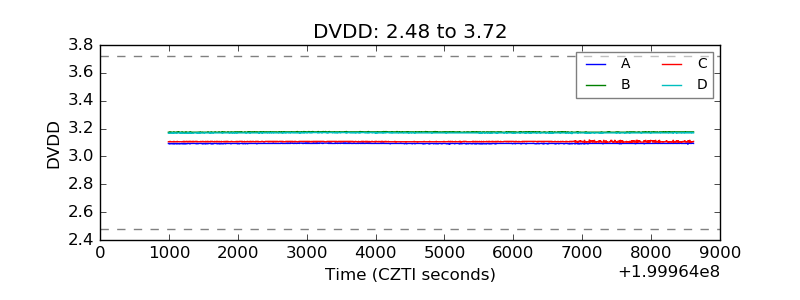 |
| Temperature 1 | 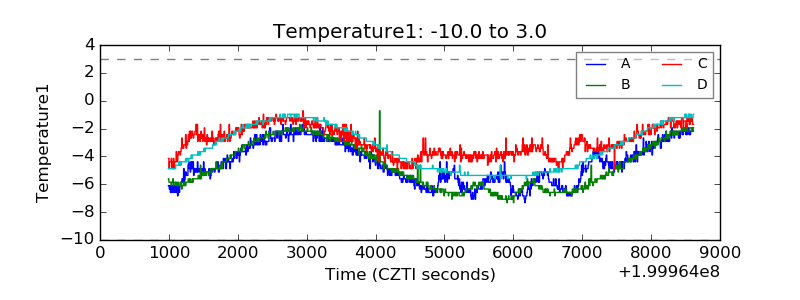 |
| Veto HV Monitor | 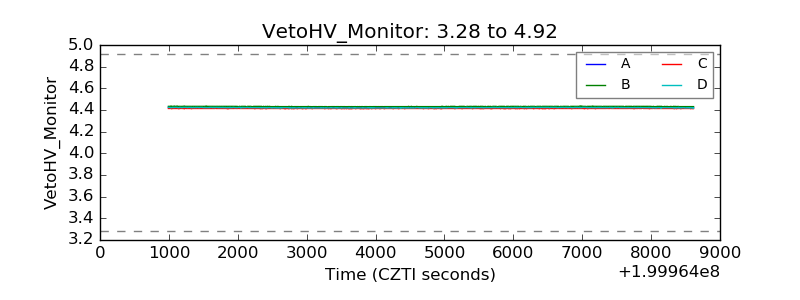 |
| Veto LLD | 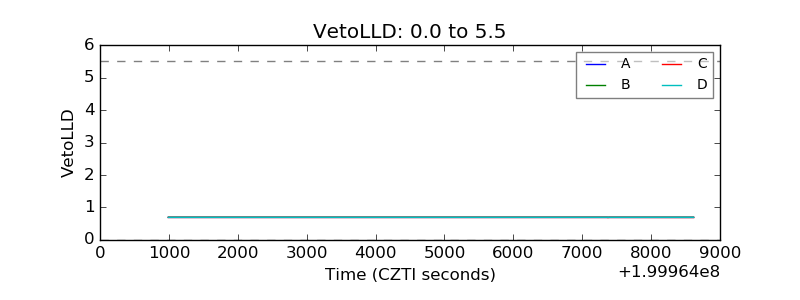 |
| Alpha Counter | 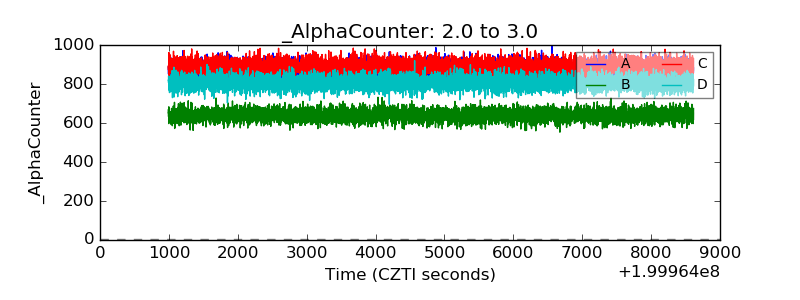 |
| _CPM_Rate | 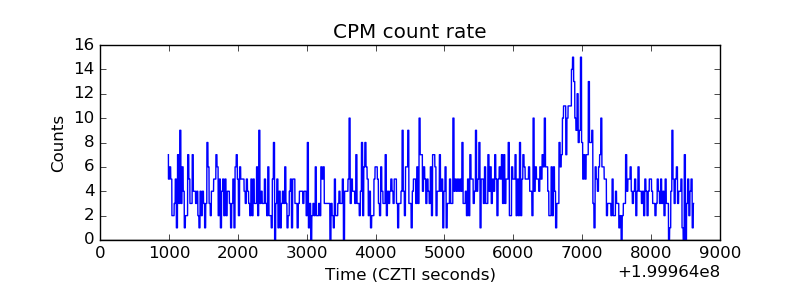 |
| CZT Counter | 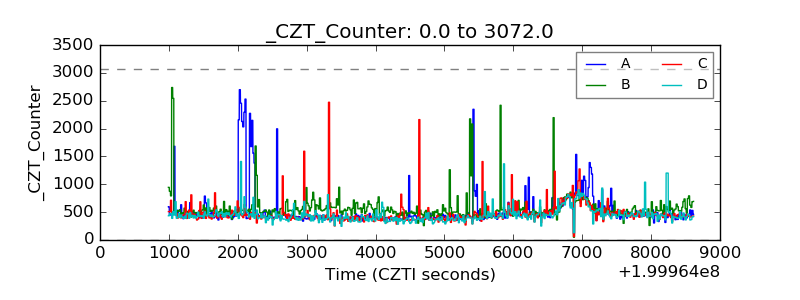 |
| +2.5 Volts monitor | 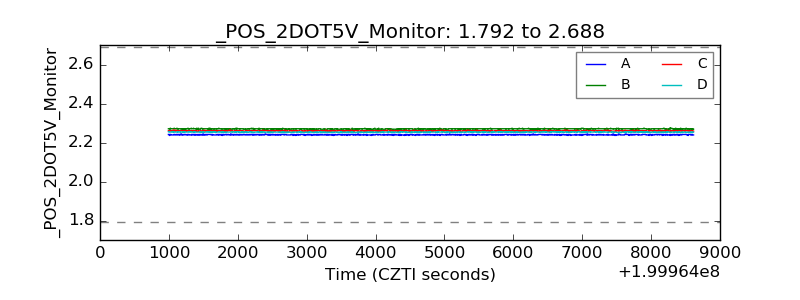 |
| +5 Volts monitor | 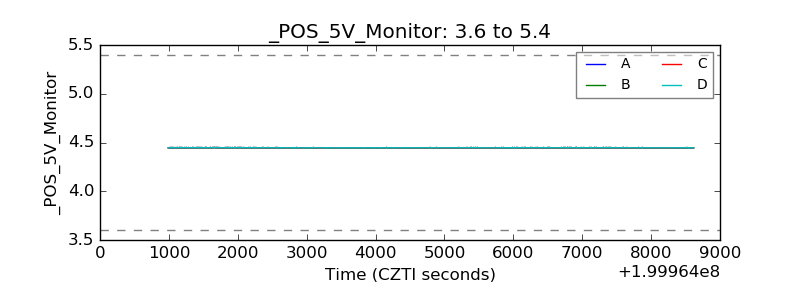 |
| Veto Counter | 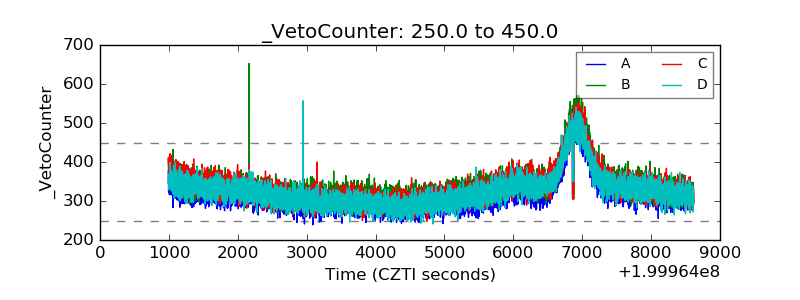 |