| Param | Original file | Final file |
|---|---|---|
| Filename | modeM0/AS1G05_221T01_9000000438_03236cztM0_level2.evt | modeM0/AS1G05_221T01_9000000438_03236cztM0_level2_quad_clean.evt |
| Size (bytes) | 904,769,280 | 170,812,800 |
| Size | 862.9 MB | 162.9 MB |
| Events in quadrant A | 6,365,062 | 1,074,592 |
| Events in quadrant B | 7,334,075 | 1,072,333 |
| Events in quadrant C | 6,745,931 | 1,068,574 |
| Events in quadrant D | 6,048,277 | 1,032,284 |
| Mode SS | |||
|---|---|---|---|
| Quadrant | BADHDUFLAG | Total packets | Discarded packets |
| A | 0 | 270 | 0 |
| B | 0 | 270 | 0 |
| C | 0 | 270 | 0 |
| D | 0 | 270 | 0 |
| Mode M0 | |||
|---|---|---|---|
| Quadrant | BADHDUFLAG | Total packets | Discarded packets |
| A | 0 | 28645 | 2 |
| B | 0 | 30521 | 2 |
| C | 0 | 29880 | 2 |
| D | 0 | 28113 | 2 |
| Mode M9 | |||
|---|---|---|---|
| Quadrant | BADHDUFLAG | Total packets | Discarded packets |
| A | 0 | 5 | 0 |
| B | 0 | 5 | 0 |
| C | 0 | 5 | 0 |
| D | 0 | 5 | 0 |
| Quadrant | Total seconds | Saturated seconds | Saturation percentage |
|---|---|---|---|
| A | 13405 | 418 | 3.118239% |
| B | 13405 | 316 | 2.357329% |
| C | 13405 | 366 | 2.730325% |
| D | 13405 | 177 | 1.320403% |
Noise dominated data is calculated using 1-second bins in cleaned event files. If a bin has >2000 counts, and if more than 50% of those come from <1% of pixels, then it is considered to be noise-dominated and hence unusable.
| Quadrant | # 1 sec bins | Bins with >0 counts | Bins with >2000 counts | High rate bins dominated by noise | Noise dominated (total time) | Noise dominated (detector-on time) | Marked lightcurve |
|---|---|---|---|---|---|---|---|
| A | 13855 | 13405 | 67 | 67 | 0.48% | 0.50% | 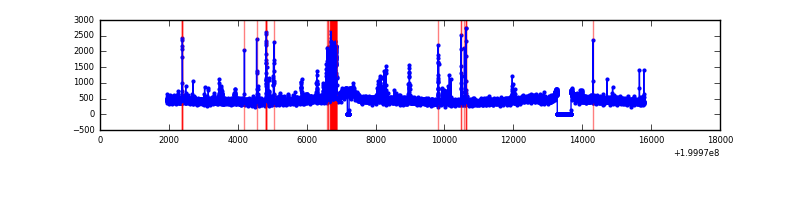 |
| B | 13855 | 13405 | 9 | 9 | 0.06% | 0.07% | 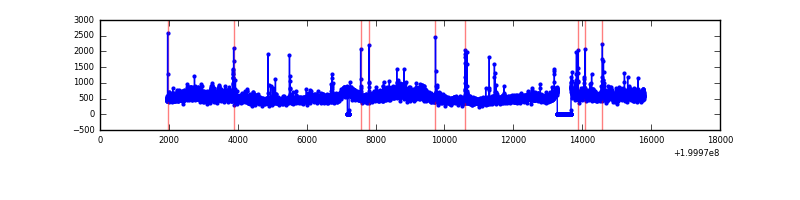 |
| C | 13854 | 13405 | 173 | 173 | 1.25% | 1.29% | 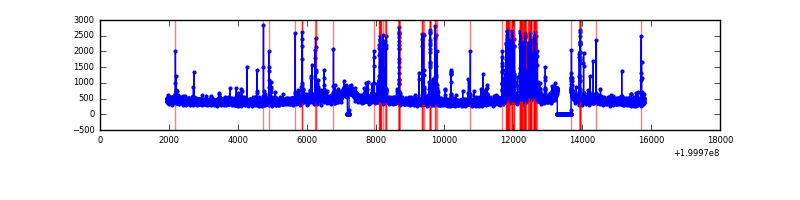 |
| D | 13854 | 13404 | 11 | 11 | 0.08% | 0.08% | 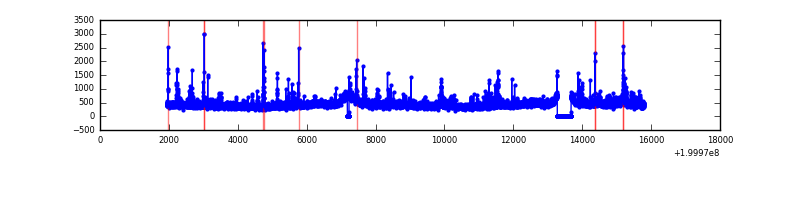 |
Top three noisy pixels from each quadrant. If the there are fewer than three noisy pixels in the level2.evt file, extra rows are filled as -1
| Pixel properties | Quadrant properties | ||||||
|---|---|---|---|---|---|---|---|
| Quadrant | DetID | PixID | Counts | Sigma | Mean | Median | Sigma |
| A | 0 | 118 | 446915 | 1424.42 | 1518 | 1486 | 312.7 |
| A | 0 | 226 | 55524 | 172.81 | 1518 | 1486 | 312.7 |
| A | 12 | 194 | 16239 | 47.18 | 1518 | 1486 | 312.7 |
| B | 15 | 204 | 1141390 | 3839.27 | 1545 | 1507 | 296.9 |
| B | 2 | 249 | 63279 | 208.05 | 1545 | 1507 | 296.9 |
| B | 15 | 54 | 31771 | 101.93 | 1545 | 1507 | 296.9 |
| C | 14 | 223 | 771119 | 2241.35 | 1470 | 1480 | 343.4 |
| C | 6 | 80 | 139718 | 402.58 | 1470 | 1480 | 343.4 |
| C | 8 | 128 | 33649 | 93.68 | 1470 | 1480 | 343.4 |
| D | 13 | 114 | 129235 | 357.54 | 1470 | 1424 | 357.5 |
| D | 13 | 223 | 81844 | 224.97 | 1470 | 1424 | 357.5 |
| D | 13 | 120 | 55340 | 150.83 | 1470 | 1424 | 357.5 |
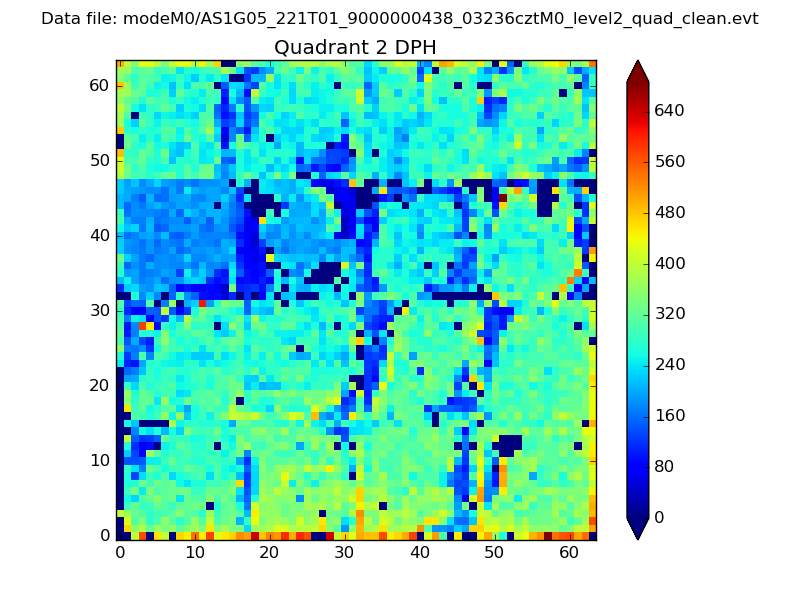
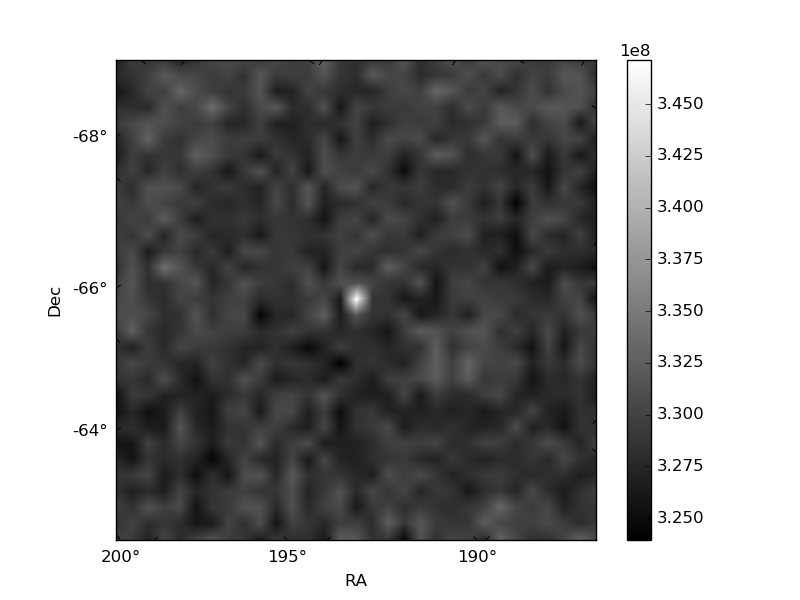
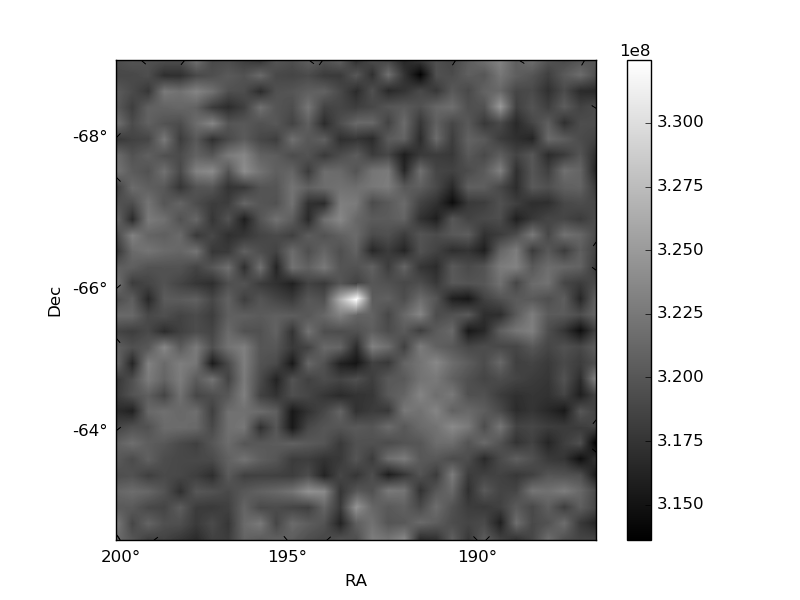
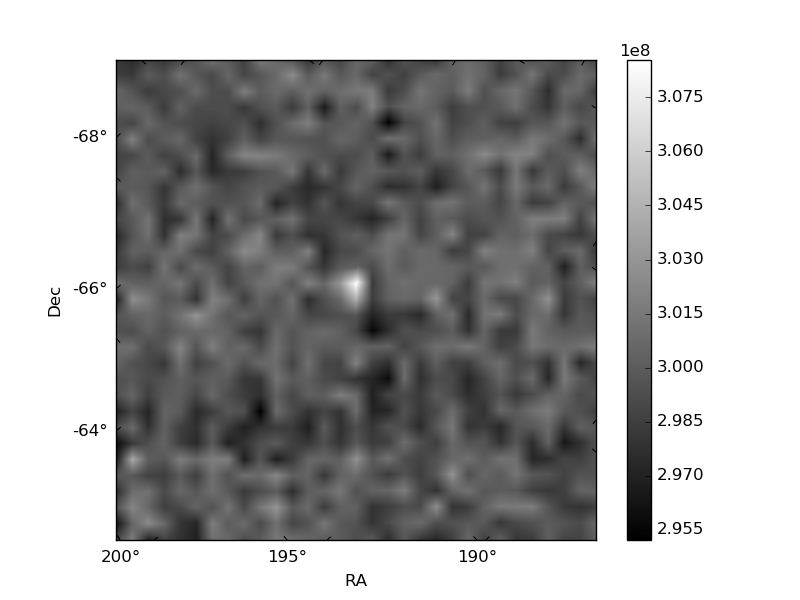
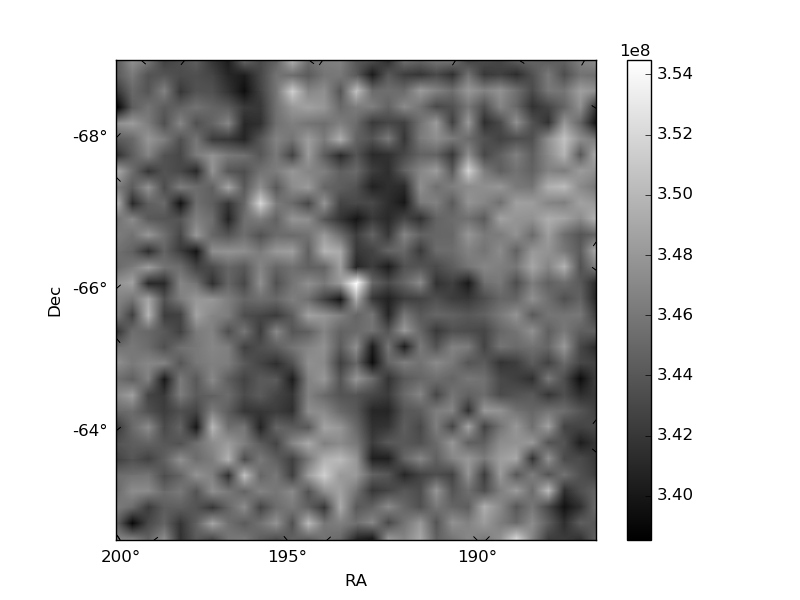
Histogram calculated using DETX and DETY for each event in the final _common_clean file
| Quadrant A | 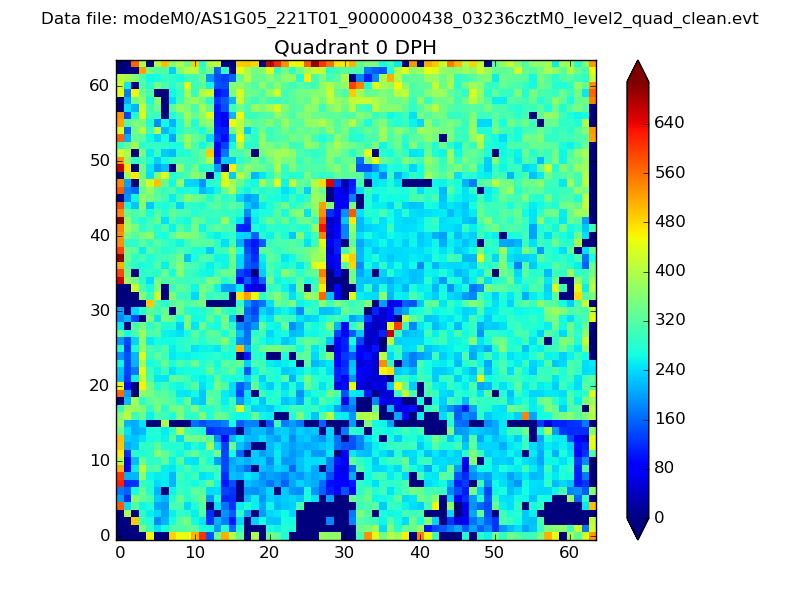 |
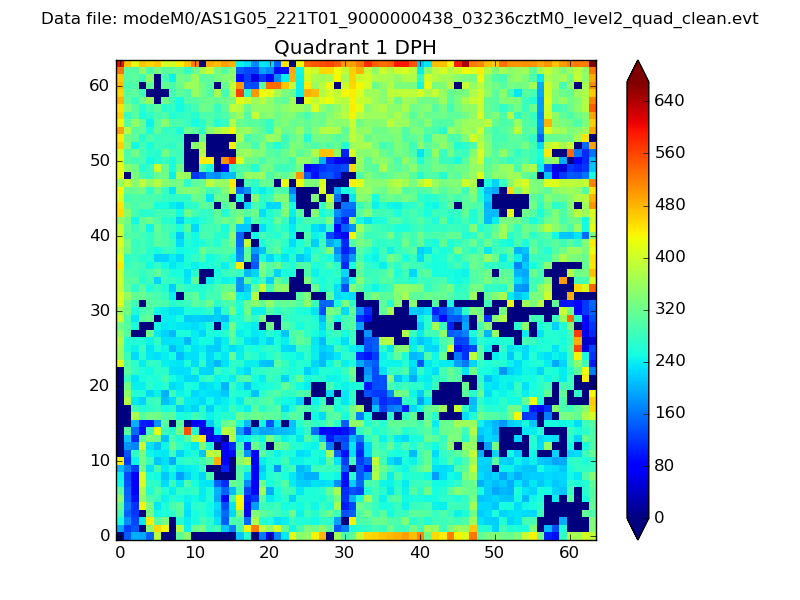 |
Quadrant B |
|---|---|---|---|
| Quadrant D | 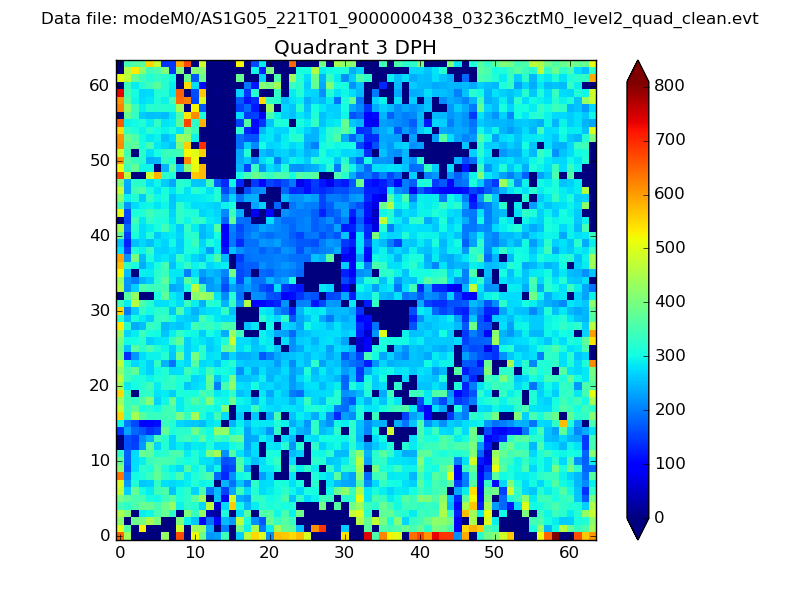 |
 |
Quadrant C |
| Plot type | Count rate plots | Images |
|---|---|---|
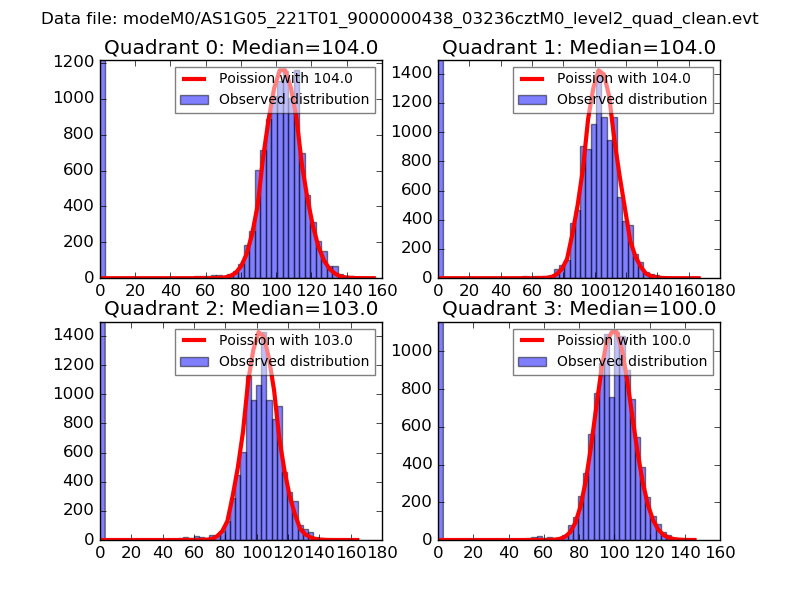
| Comparison with Poisson distribution Blue bars denote a histogram of data divided into 1 sec bins. Red curve is a Poisson curve with rate = median count rate of data. |
 |
 |
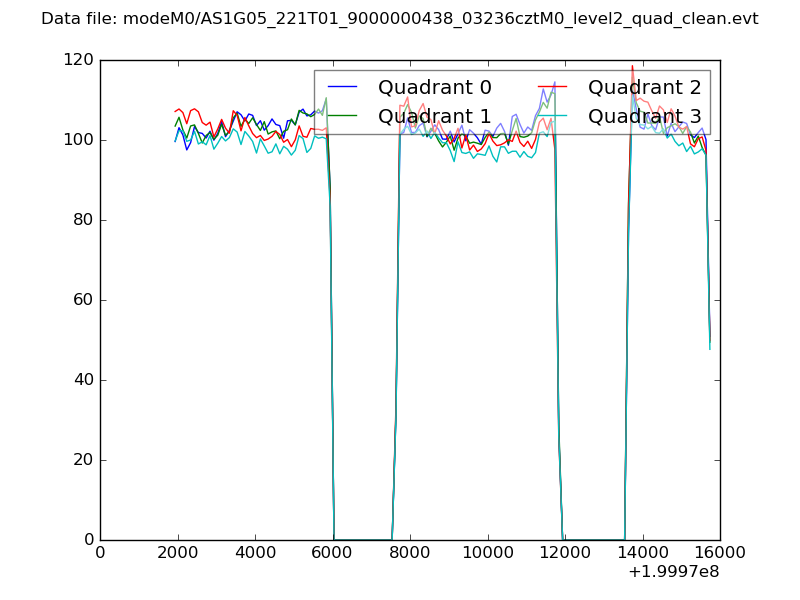
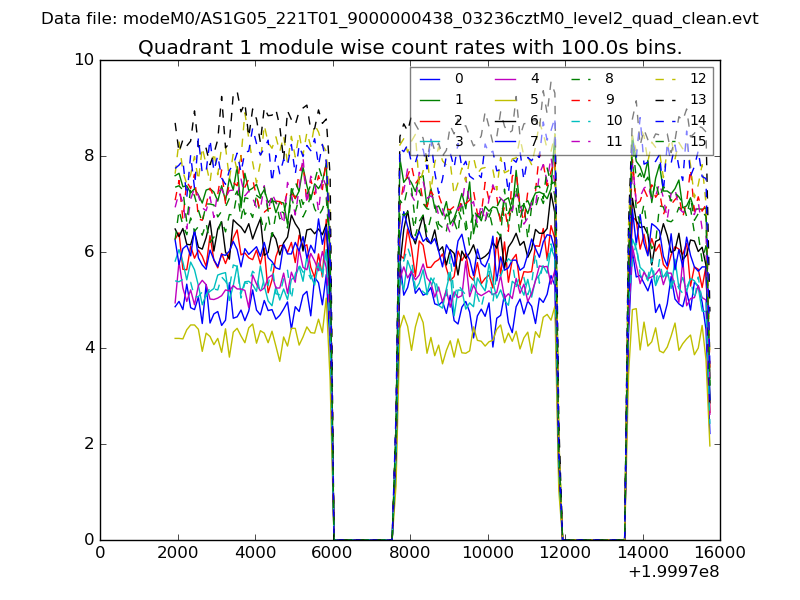
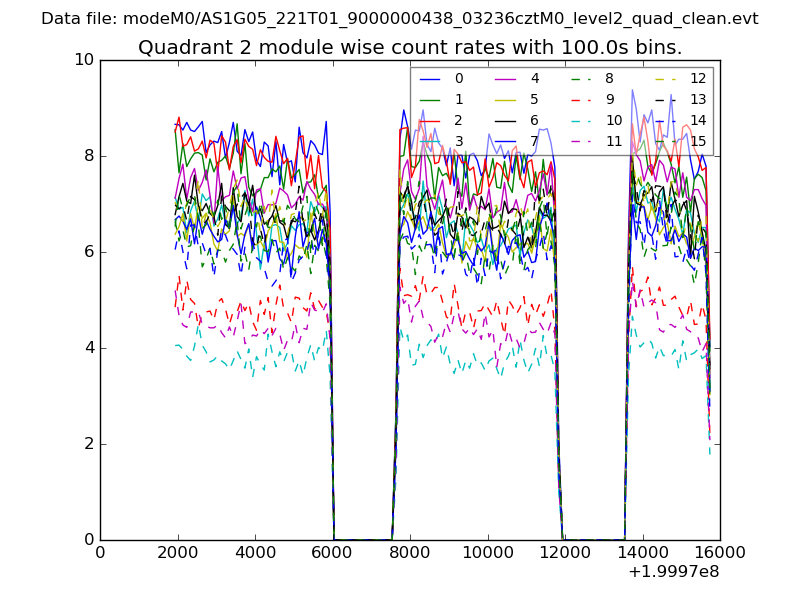
| Quadrant-wise count rates Data is divided into 100 sec bins |
 |
|
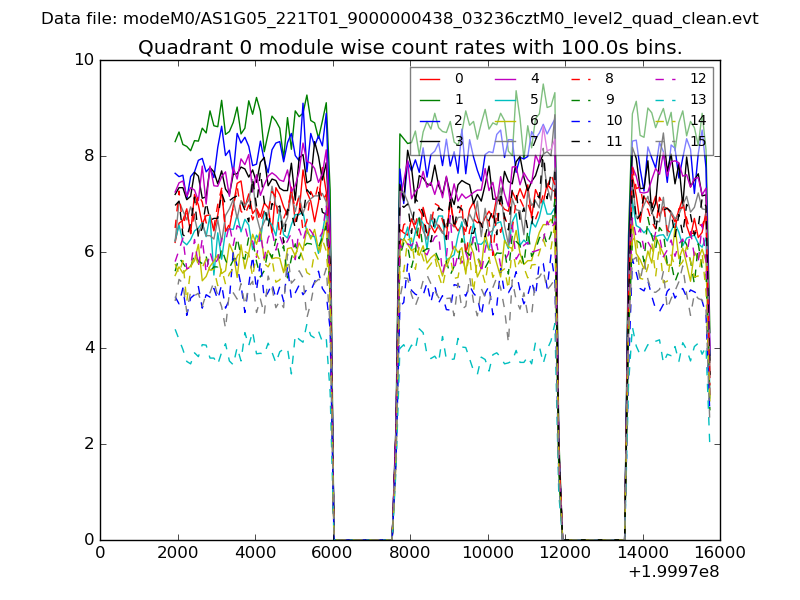
| Module-wise count rates for Quadrant A Data is divided into 100 sec bins |
 |
 |
| Module-wise count rates for Quadrant B Data is divided into 100 sec bins |
 |
 |
| Module-wise count rates for Quadrant C Data is divided into 100 sec bins |
 |
 |
| Module-wise count rates for Quadrant D Data is divided into 100 sec bins |
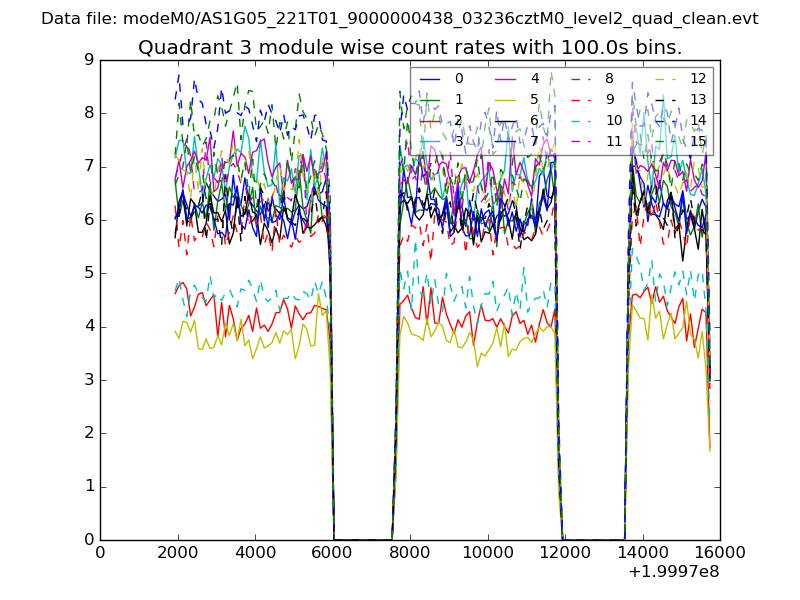 |
 |
| Parameter | Plot |
|---|---|
| CZT HV Monitor | 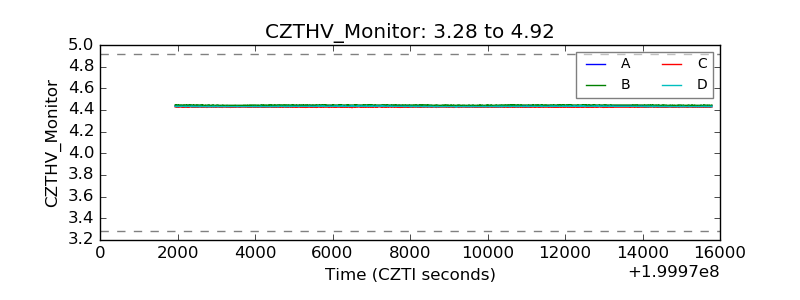 |
| D_VDD | 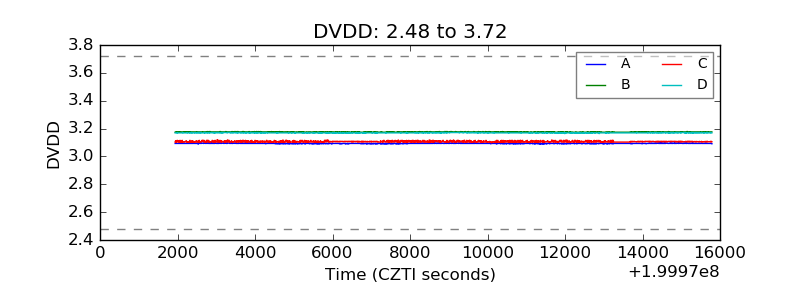 |
| Temperature 1 | 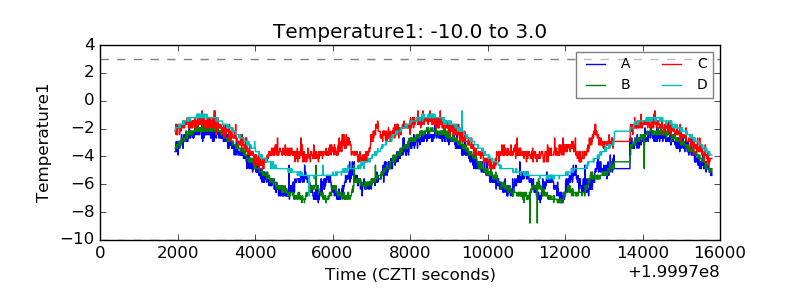 |
| Veto HV Monitor | 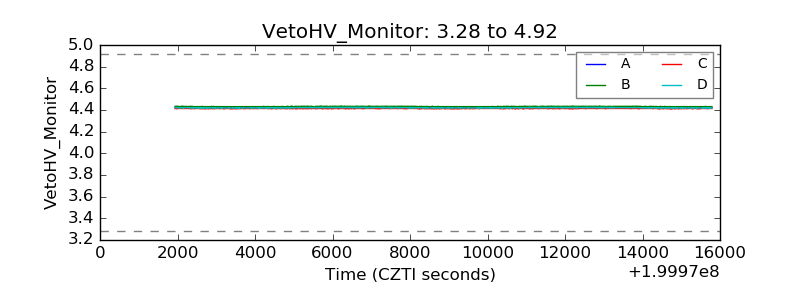 |
| Veto LLD | 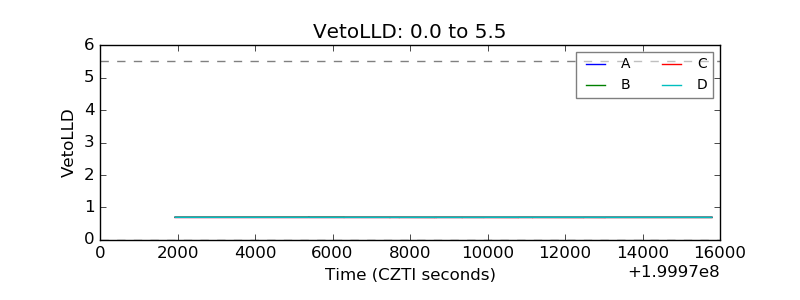 |
| Alpha Counter | 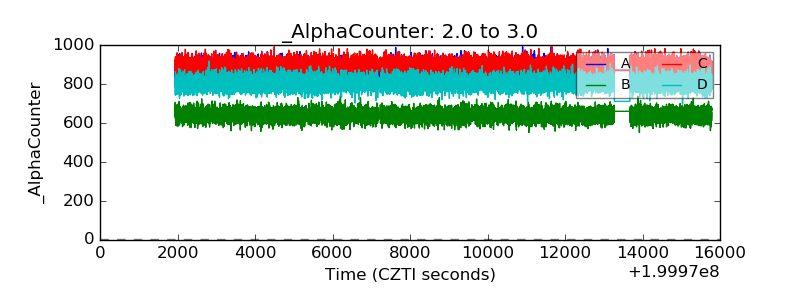 |
| _CPM_Rate | 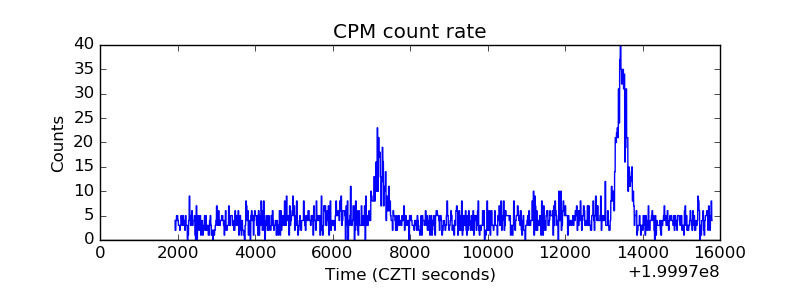 |
| CZT Counter | 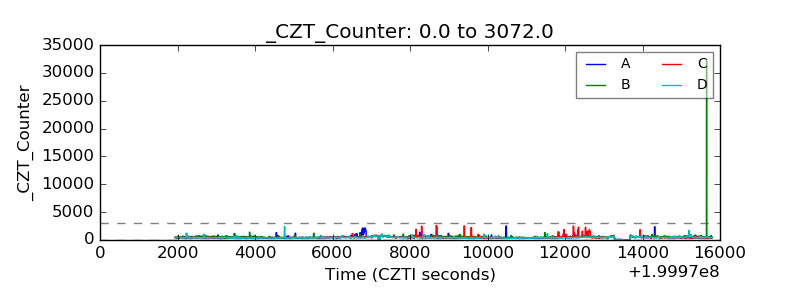 |
| +2.5 Volts monitor | 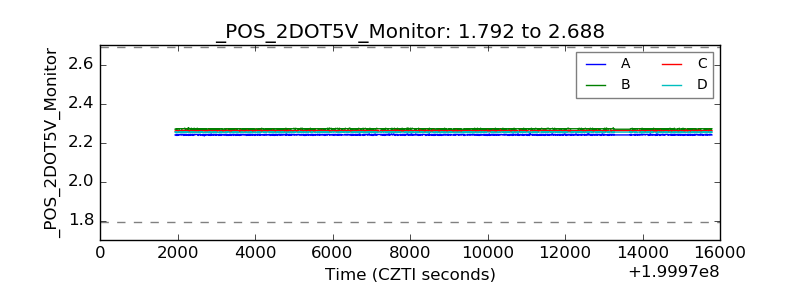 |
| +5 Volts monitor | 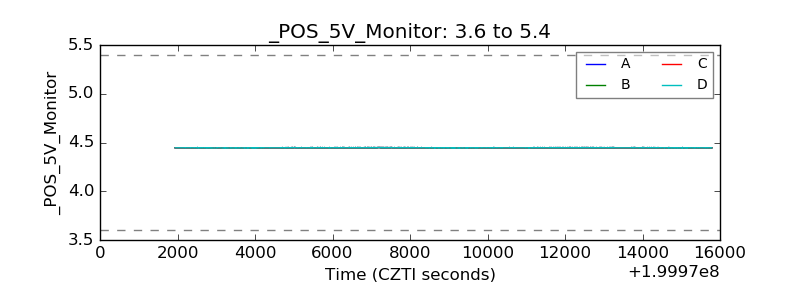 |
| Veto Counter | 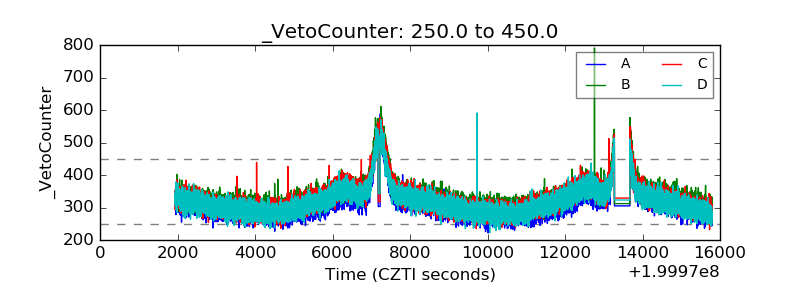 |