| Param | Original file | Final file |
|---|---|---|
| Filename | modeM0/AS1G05_104T01_9000000440cztM0_level2.fits | modeM0/AS1G05_104T01_9000000440cztM0_level2_quad_clean.evt |
| Size (bytes) | 868,809,600 | 1,000,126,080 |
| Size | 828.6 MB | 953.8 MB |
| Events in quadrant A | 5,151,630 | 6,198,050 |
| Events in quadrant B | 4,992,216 | 6,143,784 |
| Events in quadrant C | 5,071,954 | 5,861,328 |
| Events in quadrant D | 4,371,800 | 5,365,901 |
| Mode M0 | |||
|---|---|---|---|
| Quadrant | BADHDUFLAG | Total packets | Discarded packets |
| A | 0 | 203750 | 0 |
| B | 0 | 230557 | 0 |
| C | 0 | 216507 | 0 |
| D | 0 | 228004 | 0 |
| Mode SS | |||
|---|---|---|---|
| Quadrant | BADHDUFLAG | Total packets | Discarded packets |
| A | 0 | 2000 | 0 |
| B | 0 | 2000 | 0 |
| C | 0 | 2000 | 0 |
| D | 0 | 2000 | 0 |
| Mode M9 | |||
|---|---|---|---|
| Quadrant | BADHDUFLAG | Total packets | Discarded packets |
| A | 0 | 147 | 0 |
| B | 0 | 147 | 0 |
| C | 0 | 147 | 0 |
| D | 0 | 147 | 0 |
| Quadrant | Total seconds | Saturated seconds | Saturation percentage |
|---|---|---|---|
| A | 98077 | 1366 | 1.392783% |
| B | 98077 | 1496 | 1.525332% |
| C | 98077 | 1648 | 1.680312% |
| D | 98077 | 2203 | 2.246194% |
Noise dominated data is calculated using 1-second bins in cleaned event files. If a bin has >2000 counts, and if more than 50% of those come from <1% of pixels, then it is considered to be noise-dominated and hence unusable.
| Quadrant | # 1 sec bins | Bins with >0 counts | Bins with >2000 counts | High rate bins dominated by noise | Noise dominated (total time) | Noise dominated (detector-on time) | Marked lightcurve |
|---|---|---|---|---|---|---|---|
| A | 112806 | 98067 | 0 | 0 | 0.00% | 0.00% |  |
| B | 112806 | 98065 | 0 | 0 | 0.00% | 0.00% |  |
| C | 112806 | 98065 | 0 | 0 | 0.00% | 0.00% | 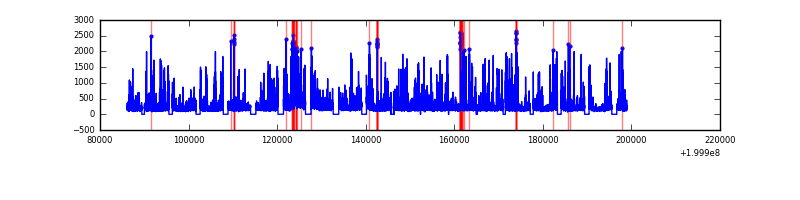 |
| D | 112806 | 98057 | 0 | 0 | 0.00% | 0.00% |  |
Top three noisy pixels from each quadrant. If the there are fewer than three noisy pixels in the level2.evt file, extra rows are filled as -1
| Pixel properties | Quadrant properties | ||||||
|---|---|---|---|---|---|---|---|
| Quadrant | DetID | PixID | Counts | Sigma | Mean | Median | Sigma |
| A | 14 | 188 | 5016 | 10.74 | 1336 | 1245 | 351.1 |
| A | 0 | 29 | 4931 | 10.5 | 1336 | 1245 | 351.1 |
| A | 14 | 204 | 4478 | 9.21 | 1336 | 1245 | 351.1 |
| B | 2 | 9 | 4385 | 11.86 | 1318 | 1254 | 264.0 |
| B | 12 | 226 | 3797 | 9.63 | 1318 | 1254 | 264.0 |
| B | 14 | 254 | 3625 | 8.98 | 1318 | 1254 | 264.0 |
| C | 7 | 111 | 3669 | 6.87 | 1339 | 1238 | 353.6 |
| C | 1 | 80 | 3652 | 6.83 | 1339 | 1238 | 353.6 |
| C | 12 | 241 | 3650 | 6.82 | 1339 | 1238 | 353.6 |
| D | 7 | 5 | 3232 | 6.3 | 1247 | 1131 | 333.3 |
| D | 1 | 19 | 3216 | 6.26 | 1247 | 1131 | 333.3 |
| D | 6 | 231 | 3186 | 6.17 | 1247 | 1131 | 333.3 |
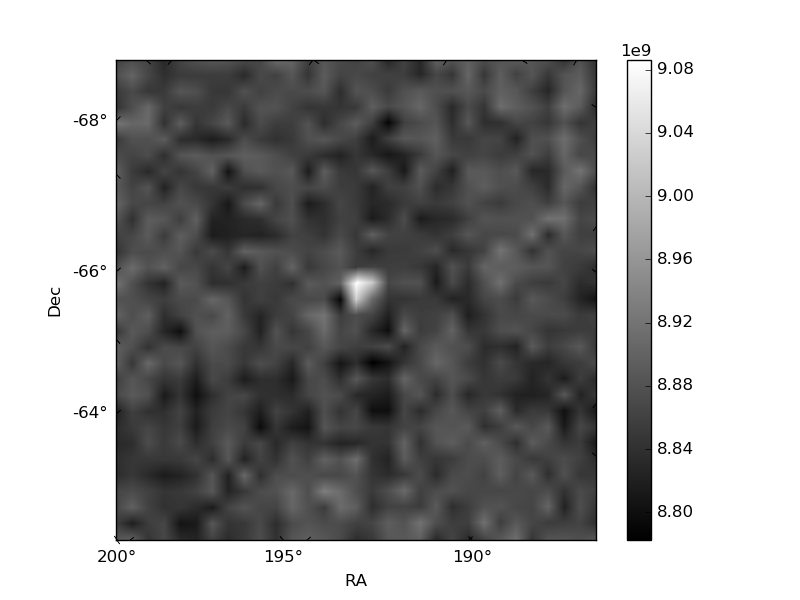
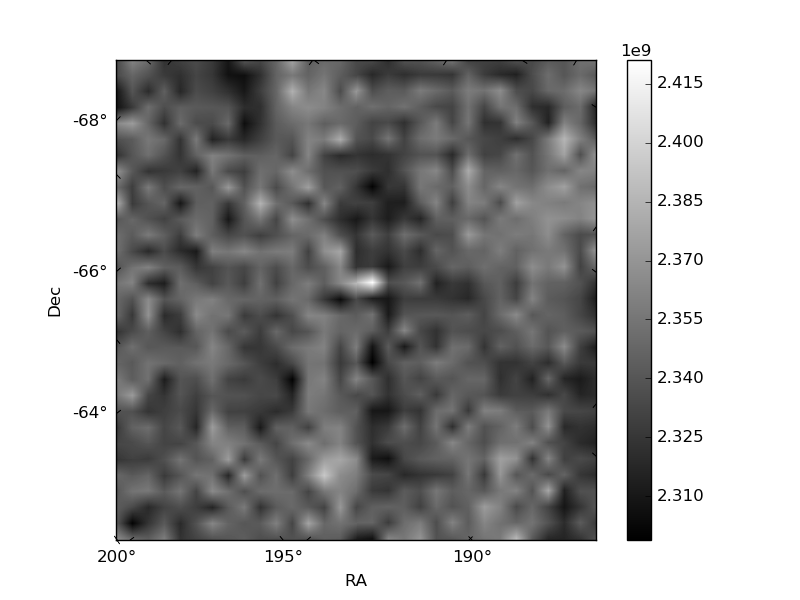
Histogram calculated using DETX and DETY for each event in the final _common_clean file
| Quadrant A | 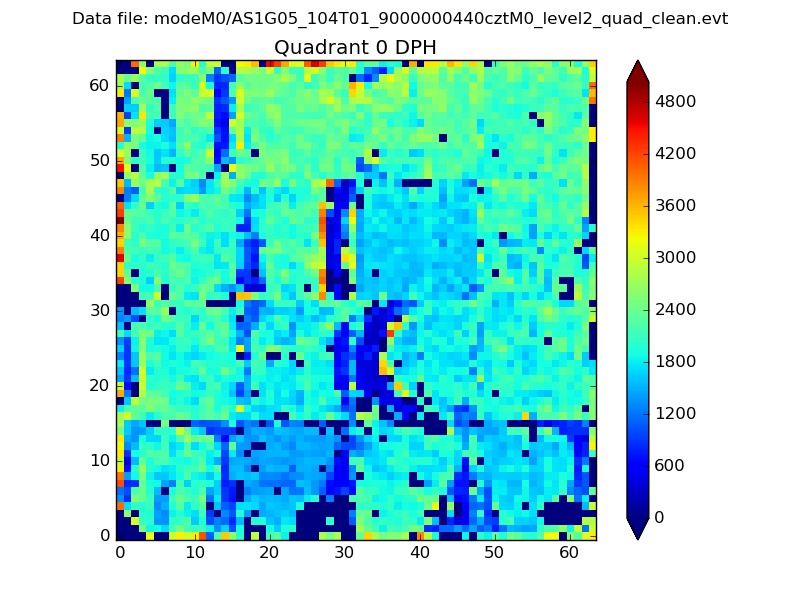 |
 |
Quadrant B |
|---|---|---|---|
| Quadrant D | 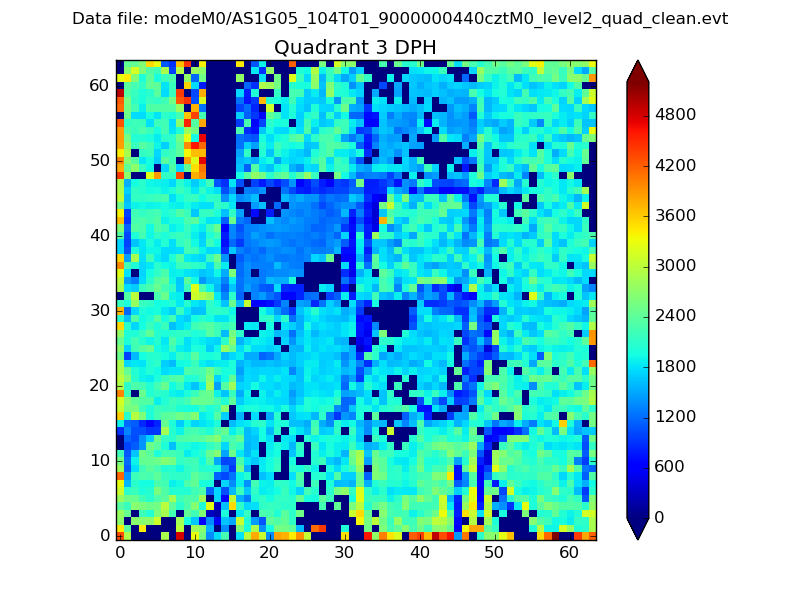 |
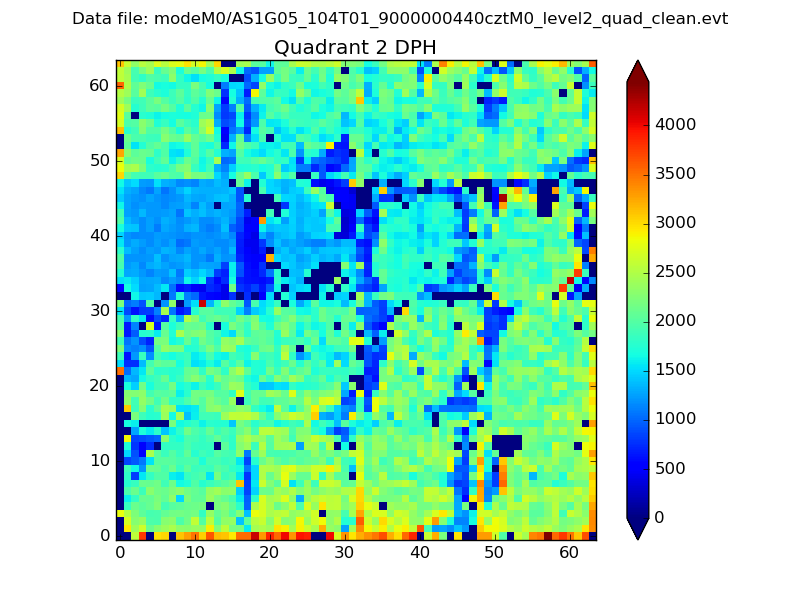 |
Quadrant C |
| Plot type | Count rate plots | Images |
|---|---|---|
| Comparison with Poisson distribution Blue bars denote a histogram of data divided into 1 sec bins. Red curve is a Poisson curve with rate = median count rate of data. |
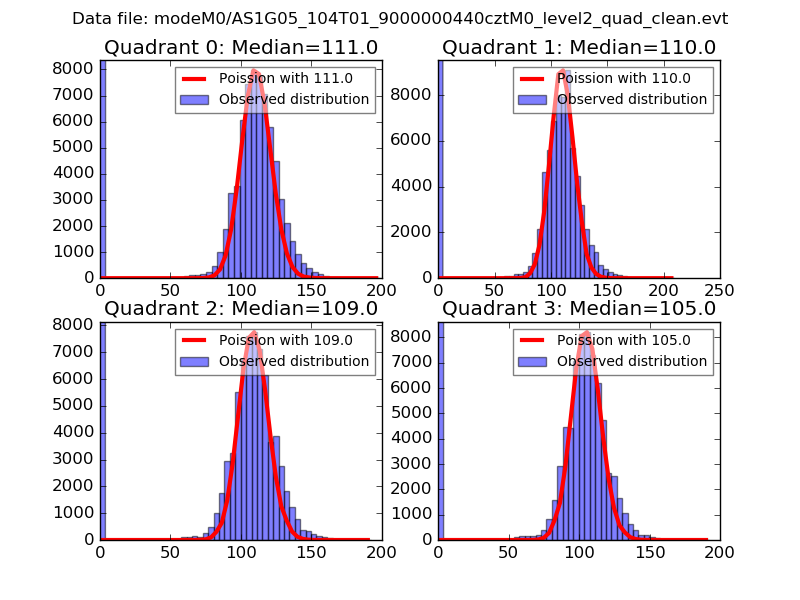 |
 |
| Quadrant-wise count rates Data is divided into 100 sec bins |
 |
|
| Module-wise count rates for Quadrant A Data is divided into 100 sec bins |
 |
 |
| Module-wise count rates for Quadrant B Data is divided into 100 sec bins |
 |
 |
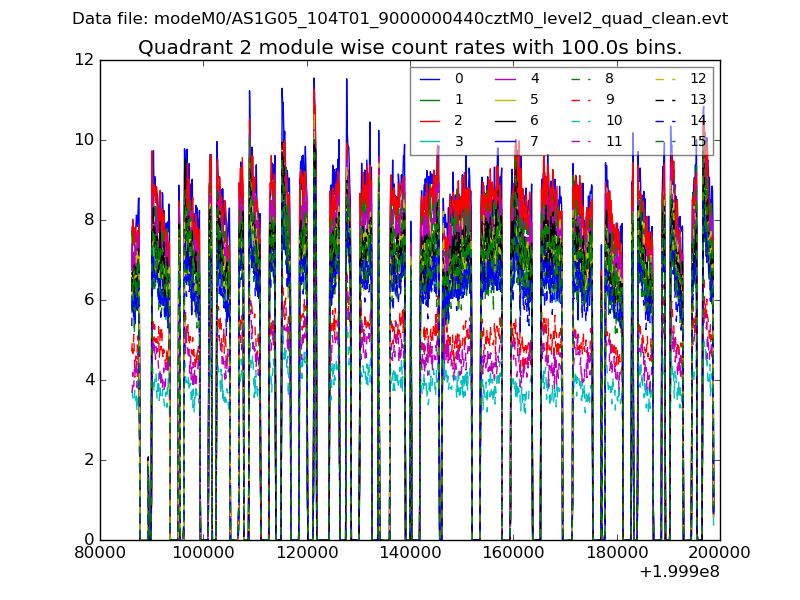
| Module-wise count rates for Quadrant C Data is divided into 100 sec bins |
 |
 |
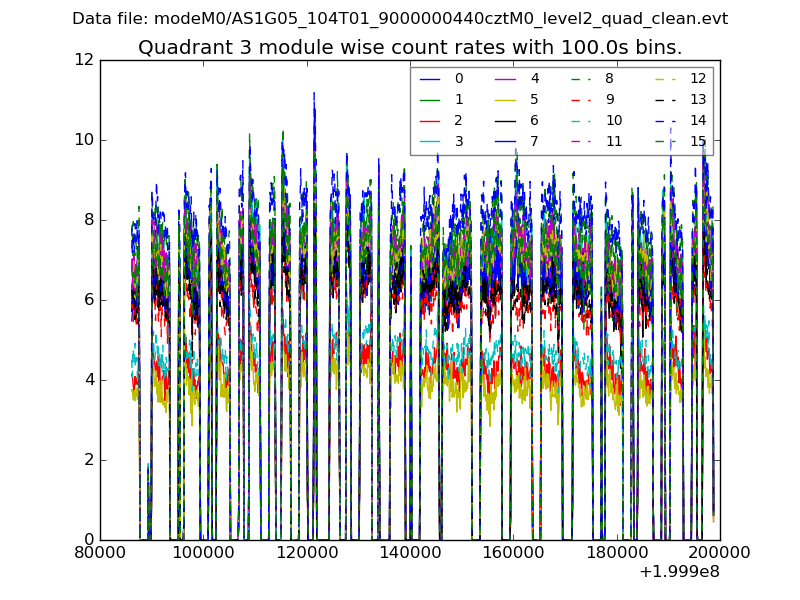
| Module-wise count rates for Quadrant D Data is divided into 100 sec bins |
 |
 |
| Parameter | Plot |
|---|---|
| CZT HV Monitor |  |
| D_VDD |  |
| Temperature 1 |  |
| Veto HV Monitor |  |
| Veto LLD | 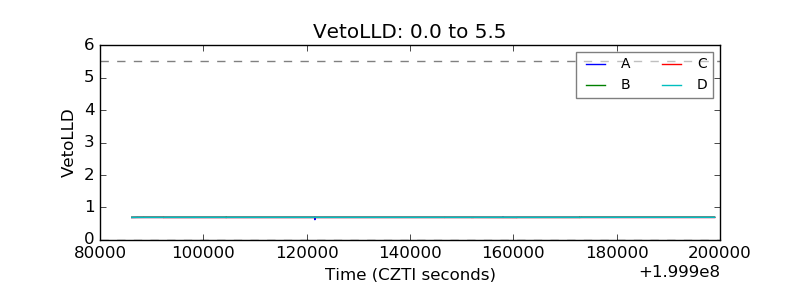 |
| Alpha Counter |  |
| _CPM_Rate |  |
| CZT Counter |  |
| +2.5 Volts monitor |  |
| +5 Volts monitor |  |
| _ROLL_ROT |  |
| _Roll_DEC | 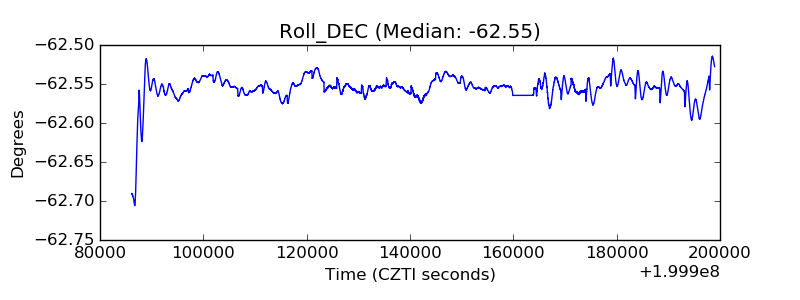 |
| _Roll_RA |  |
| Veto Counter |  |