| Param | Original file | Final file |
|---|---|---|
| Filename | modeM0/AS1G05_104T01_9000000440_03239cztM0_level2.evt | modeM0/AS1G05_104T01_9000000440_03239cztM0_level2_quad_clean.evt |
| Size (bytes) | 447,108,480 | 84,968,640 |
| Size | 426.4 MB | 81.0 MB |
| Events in quadrant A | 3,008,014 | 542,314 |
| Events in quadrant B | 3,452,844 | 540,069 |
| Events in quadrant C | 3,020,170 | 531,586 |
| Events in quadrant D | 3,620,861 | 508,730 |
| Mode M0 | |||
|---|---|---|---|
| Quadrant | BADHDUFLAG | Total packets | Discarded packets |
| A | 0 | 13520 | 2 |
| B | 0 | 14383 | 1 |
| C | 0 | 13678 | 1 |
| D | 0 | 15564 | 1 |
| Mode SS | |||
|---|---|---|---|
| Quadrant | BADHDUFLAG | Total packets | Discarded packets |
| A | 0 | 130 | 0 |
| B | 0 | 130 | 0 |
| C | 0 | 130 | 0 |
| D | 0 | 130 | 0 |
| Mode M9 | |||
|---|---|---|---|
| Quadrant | BADHDUFLAG | Total packets | Discarded packets |
| A | 0 | 11 | 0 |
| B | 0 | 11 | 0 |
| C | 0 | 11 | 0 |
| D | 0 | 11 | 0 |
| Quadrant | Total seconds | Saturated seconds | Saturation percentage |
|---|---|---|---|
| A | 6457 | 43 | 0.665944% |
| B | 6457 | 21 | 0.325228% |
| C | 6457 | 30 | 0.464612% |
| D | 6457 | 225 | 3.484590% |
Noise dominated data is calculated using 1-second bins in cleaned event files. If a bin has >2000 counts, and if more than 50% of those come from <1% of pixels, then it is considered to be noise-dominated and hence unusable.
| Quadrant | # 1 sec bins | Bins with >0 counts | Bins with >2000 counts | High rate bins dominated by noise | Noise dominated (total time) | Noise dominated (detector-on time) | Marked lightcurve |
|---|---|---|---|---|---|---|---|
| A | 7542 | 6457 | 26 | 26 | 0.34% | 0.40% |  |
| B | 7542 | 6457 | 8 | 8 | 0.11% | 0.12% | 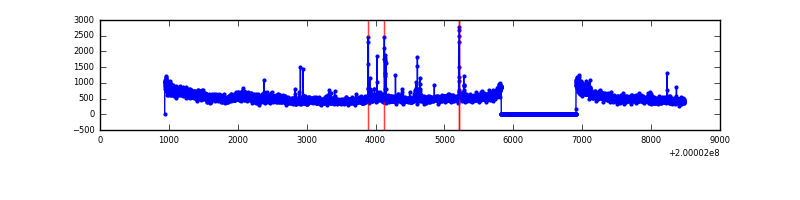 |
| C | 7542 | 6457 | 18 | 18 | 0.24% | 0.28% |  |
| D | 7542 | 6458 | 220 | 220 | 2.92% | 3.41% | 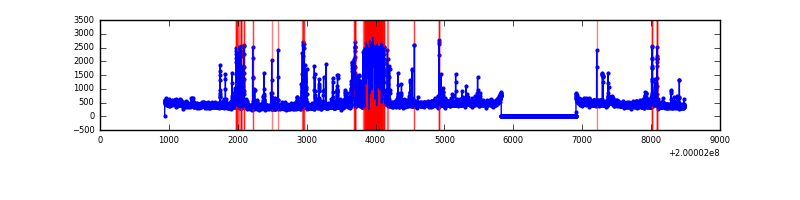 |
Top three noisy pixels from each quadrant. If the there are fewer than three noisy pixels in the level2.evt file, extra rows are filled as -1
| Pixel properties | Quadrant properties | ||||||
|---|---|---|---|---|---|---|---|
| Quadrant | DetID | PixID | Counts | Sigma | Mean | Median | Sigma |
| A | 0 | 118 | 172639 | 1155.43 | 723 | 711 | 148.8 |
| A | 0 | 226 | 23417 | 152.59 | 723 | 711 | 148.8 |
| A | 3 | 1 | 17237 | 111.06 | 723 | 711 | 148.8 |
| B | 15 | 204 | 449426 | 3134.84 | 740 | 724 | 143.1 |
| B | 2 | 249 | 61855 | 427.09 | 740 | 724 | 143.1 |
| B | 3 | 0 | 61595 | 425.27 | 740 | 724 | 143.1 |
| C | 14 | 223 | 127350 | 767.26 | 701 | 706 | 165.1 |
| C | 14 | 48 | 101319 | 609.56 | 701 | 706 | 165.1 |
| C | 6 | 80 | 42682 | 254.31 | 701 | 706 | 165.1 |
| D | 13 | 223 | 870154 | 5173.57 | 686 | 667 | 168.1 |
| D | 13 | 114 | 72411 | 426.89 | 686 | 667 | 168.1 |
| D | 13 | 239 | 47593 | 279.22 | 686 | 667 | 168.1 |
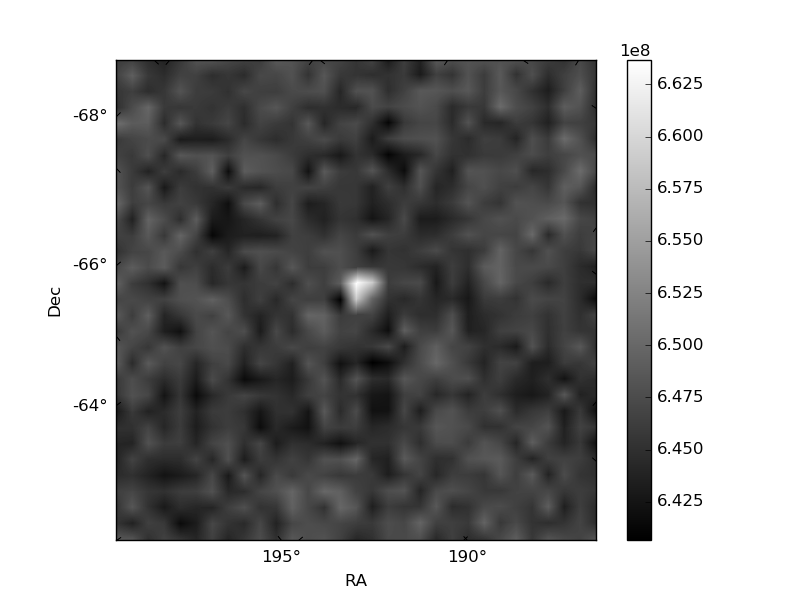
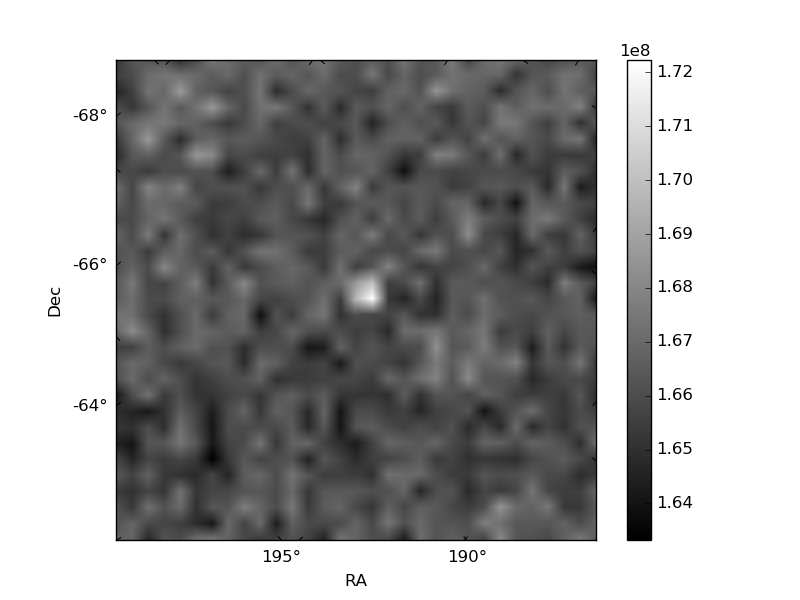
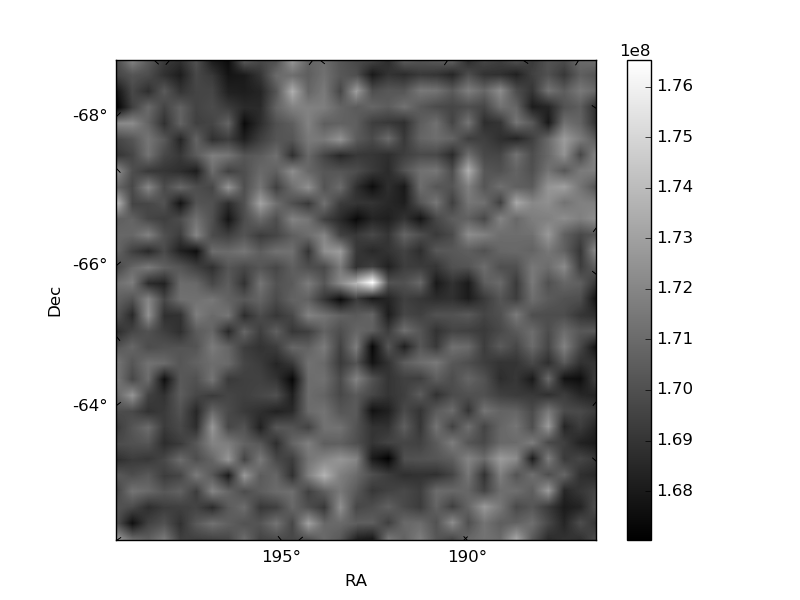
Histogram calculated using DETX and DETY for each event in the final _common_clean file
| Quadrant A | 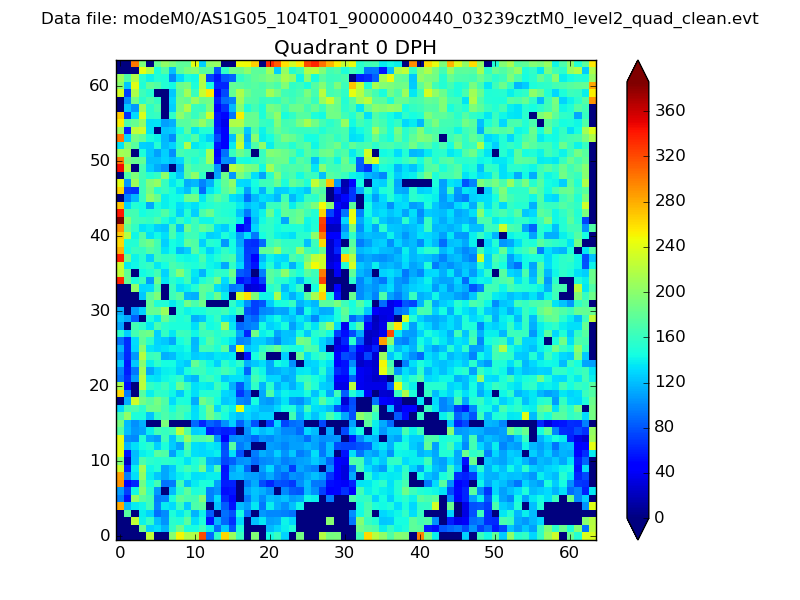 |
 |
Quadrant B |
|---|---|---|---|
| Quadrant D |  |
 |
Quadrant C |
| Plot type | Count rate plots | Images |
|---|---|---|
| Comparison with Poisson distribution Blue bars denote a histogram of data divided into 1 sec bins. Red curve is a Poisson curve with rate = median count rate of data. |
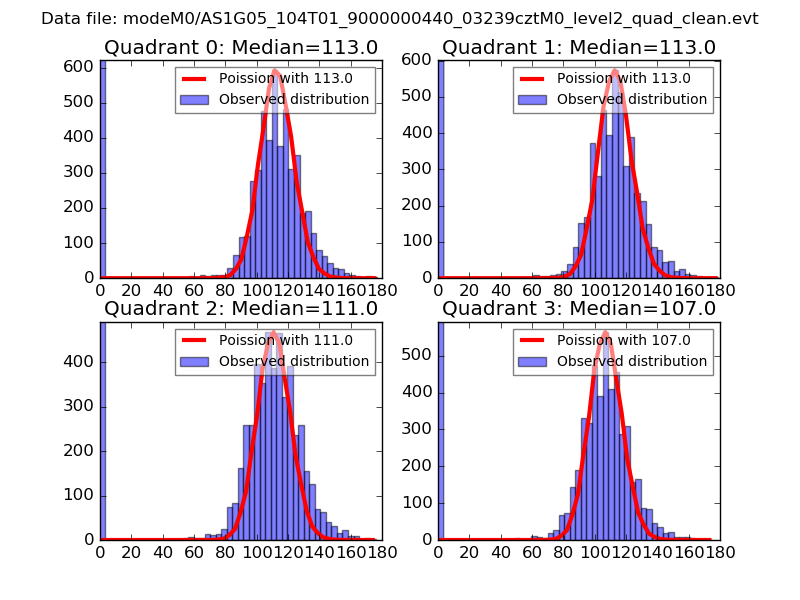 |
 |
| Quadrant-wise count rates Data is divided into 100 sec bins |
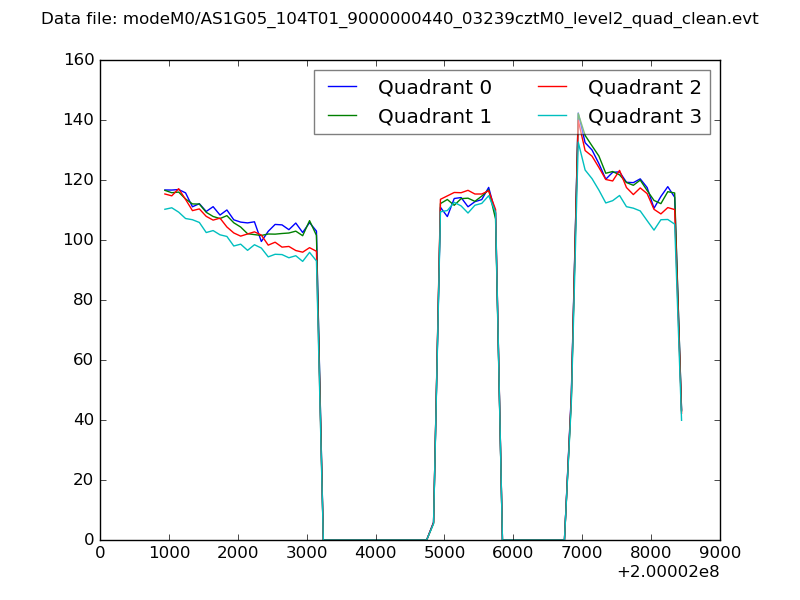 |
|
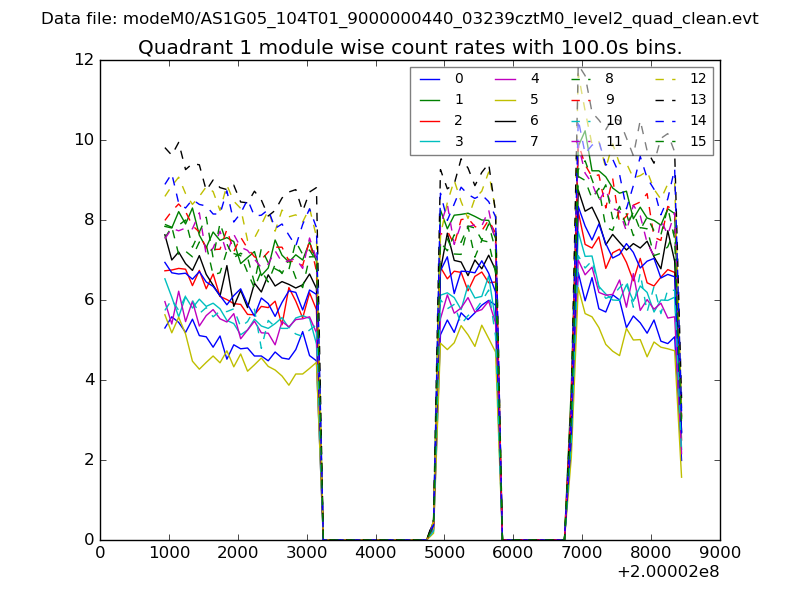
| Module-wise count rates for Quadrant A Data is divided into 100 sec bins |
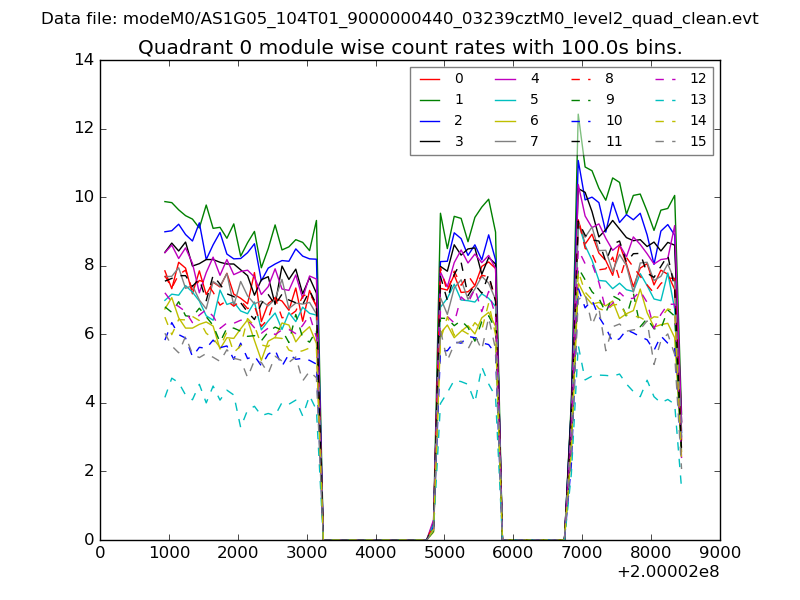 |
 |
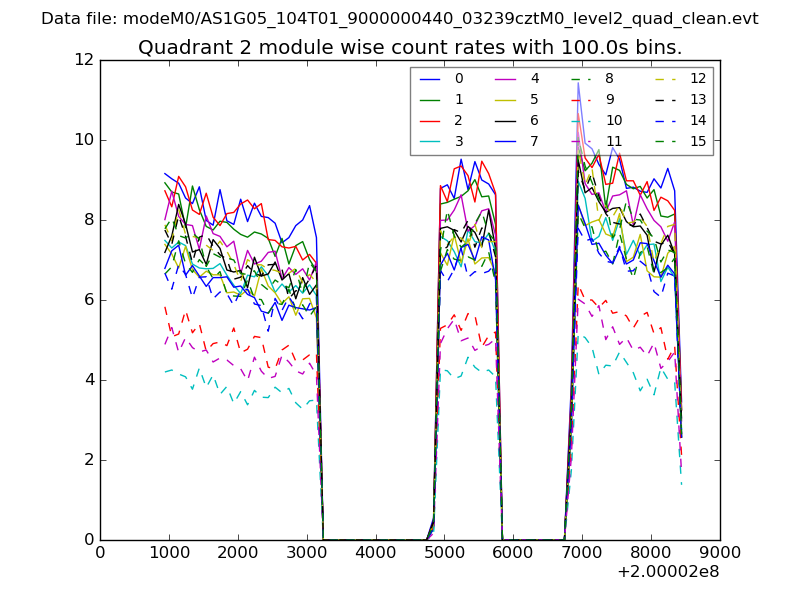
| Module-wise count rates for Quadrant B Data is divided into 100 sec bins |
 |
 |
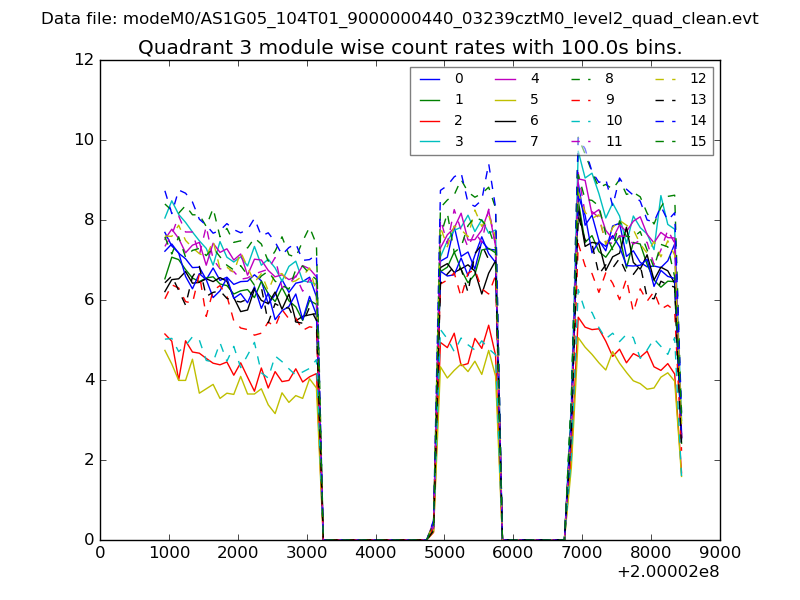
| Module-wise count rates for Quadrant C Data is divided into 100 sec bins |
 |
 |
| Module-wise count rates for Quadrant D Data is divided into 100 sec bins |
 |
 |
| Parameter | Plot |
|---|---|
| CZT HV Monitor | 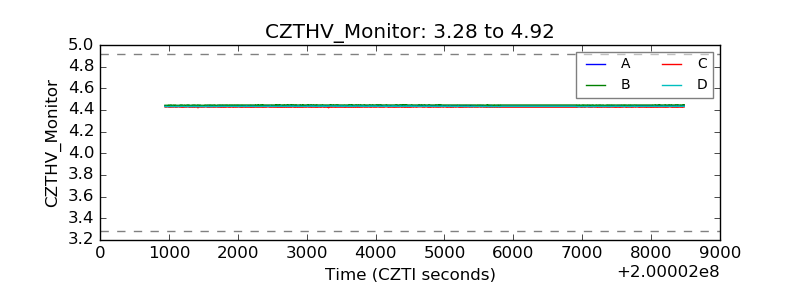 |
| D_VDD | 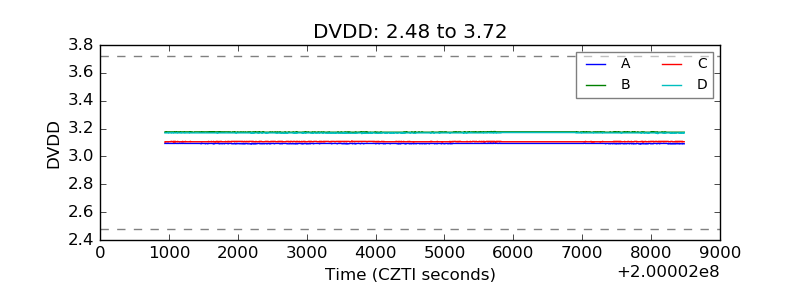 |
| Temperature 1 | 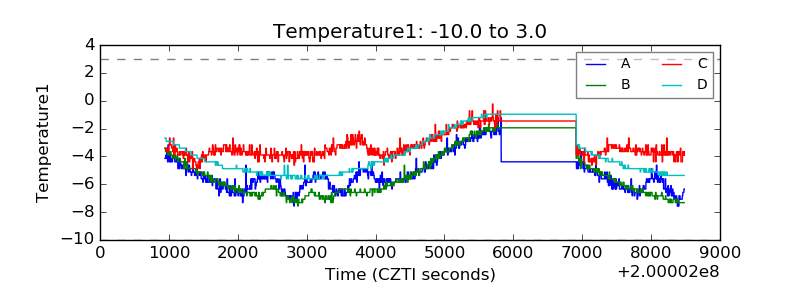 |
| Veto HV Monitor | 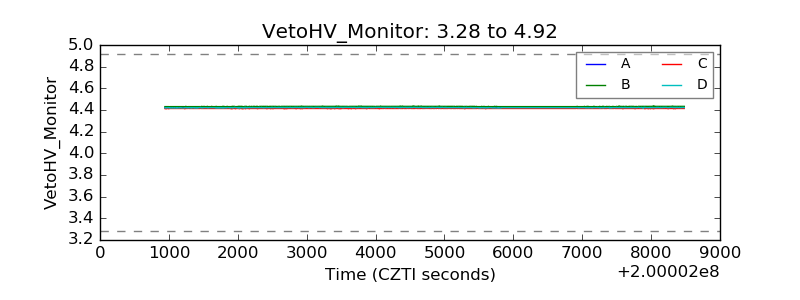 |
| Veto LLD | 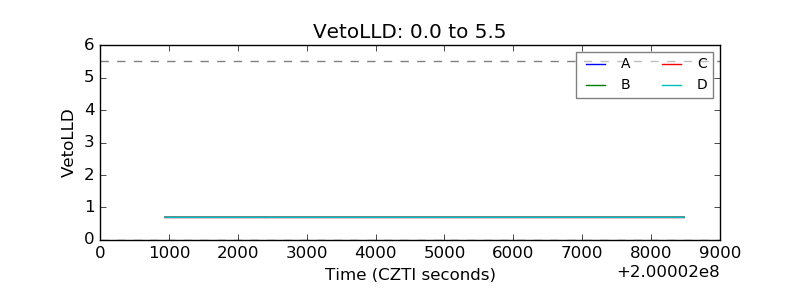 |
| Alpha Counter | 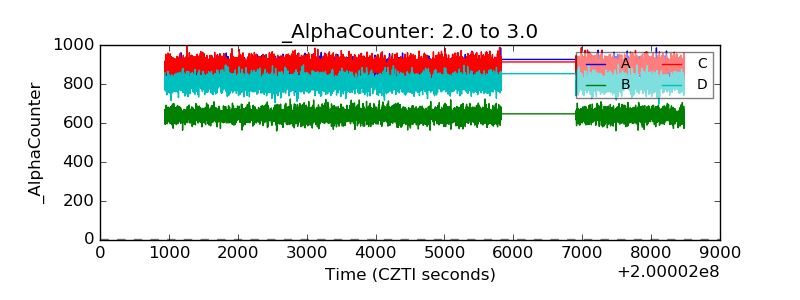 |
| _CPM_Rate | 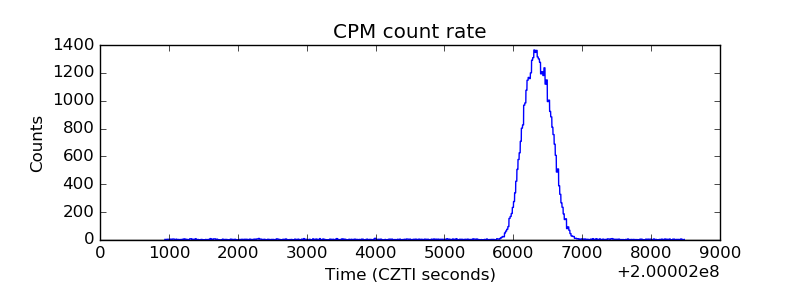 |
| CZT Counter | 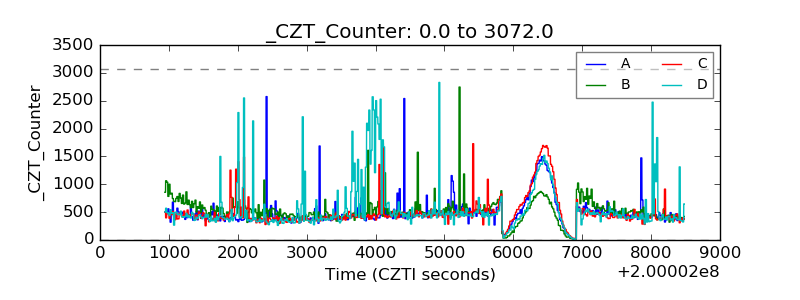 |
| +2.5 Volts monitor |  |
| +5 Volts monitor |  |
| _ROLL_ROT | 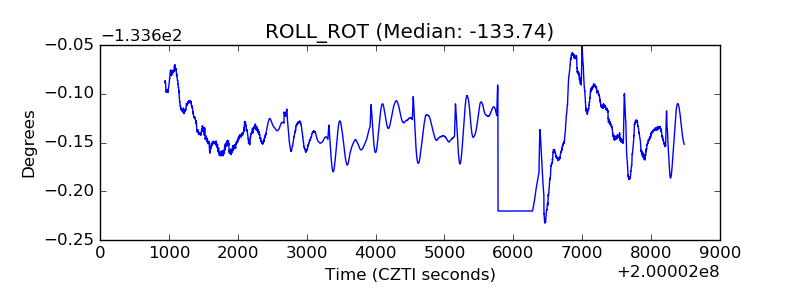 |
| _Roll_DEC | 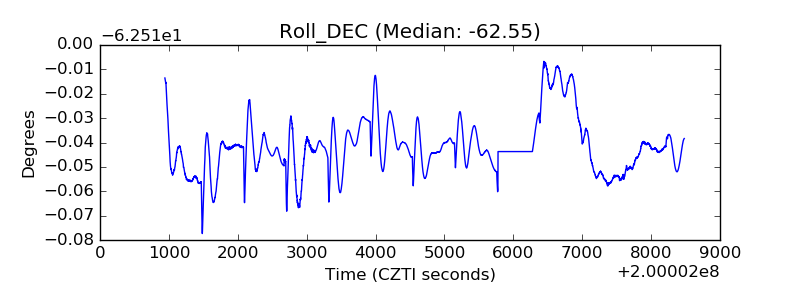 |
| _Roll_RA | 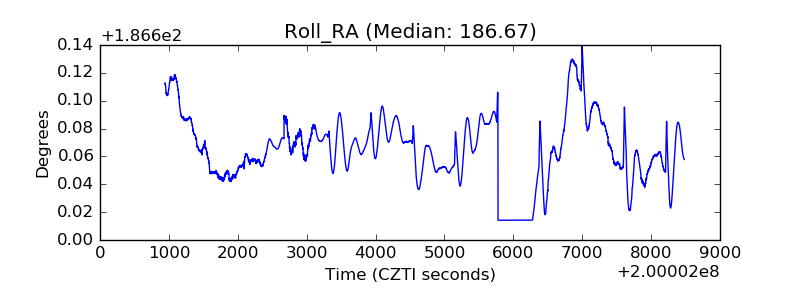 |
| Veto Counter | 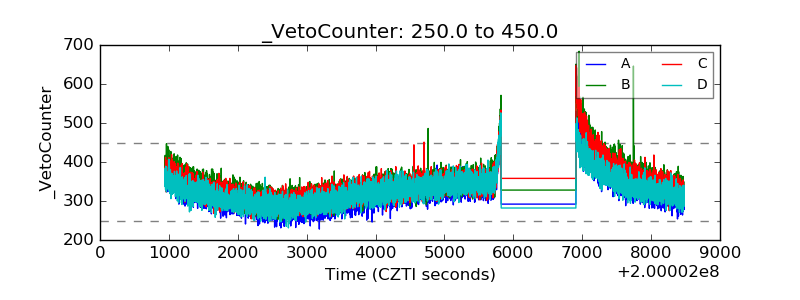 |