| Param | Original file | Final file |
|---|---|---|
| Filename | modeM0/AS1G05_104T01_9000000440_03240cztM0_level2.evt | modeM0/AS1G05_104T01_9000000440_03240cztM0_level2_quad_clean.evt |
| Size (bytes) | 437,172,480 | 90,936,000 |
| Size | 416.9 MB | 86.7 MB |
| Events in quadrant A | 3,018,572 | 585,225 |
| Events in quadrant B | 3,510,949 | 587,420 |
| Events in quadrant C | 3,009,249 | 577,521 |
| Events in quadrant D | 3,253,867 | 544,939 |
| Mode M0 | |||
|---|---|---|---|
| Quadrant | BADHDUFLAG | Total packets | Discarded packets |
| A | 0 | 13533 | 3 |
| B | 0 | 14875 | 2 |
| C | 0 | 13523 | 2 |
| D | 0 | 14575 | 2 |
| Mode SS | |||
|---|---|---|---|
| Quadrant | BADHDUFLAG | Total packets | Discarded packets |
| A | 0 | 132 | 0 |
| B | 0 | 132 | 0 |
| C | 0 | 132 | 0 |
| D | 0 | 132 | 0 |
| Mode M9 | |||
|---|---|---|---|
| Quadrant | BADHDUFLAG | Total packets | Discarded packets |
| A | 0 | 18 | 0 |
| B | 0 | 18 | 0 |
| C | 0 | 18 | 0 |
| D | 0 | 19 | 0 |
| Quadrant | Total seconds | Saturated seconds | Saturation percentage |
|---|---|---|---|
| A | 6584 | 26 | 0.394897% |
| B | 6584 | 40 | 0.607533% |
| C | 6584 | 16 | 0.243013% |
| D | 6584 | 63 | 0.956865% |
Noise dominated data is calculated using 1-second bins in cleaned event files. If a bin has >2000 counts, and if more than 50% of those come from <1% of pixels, then it is considered to be noise-dominated and hence unusable.
| Quadrant | # 1 sec bins | Bins with >0 counts | Bins with >2000 counts | High rate bins dominated by noise | Noise dominated (total time) | Noise dominated (detector-on time) | Marked lightcurve |
|---|---|---|---|---|---|---|---|
| A | 7788 | 6584 | 7 | 7 | 0.09% | 0.11% |  |
| B | 7788 | 6584 | 1 | 1 | 0.01% | 0.02% |  |
| C | 7788 | 6584 | 6 | 6 | 0.08% | 0.09% |  |
| D | 7789 | 6585 | 38 | 38 | 0.49% | 0.58% | 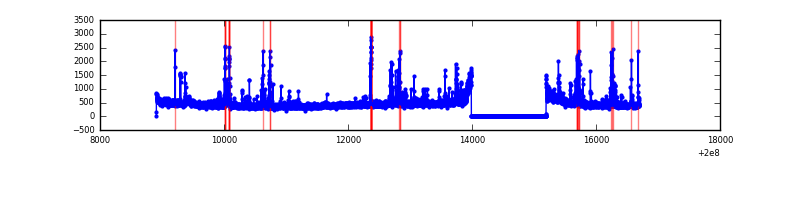 |
Top three noisy pixels from each quadrant. If the there are fewer than three noisy pixels in the level2.evt file, extra rows are filled as -1
| Pixel properties | Quadrant properties | ||||||
|---|---|---|---|---|---|---|---|
| Quadrant | DetID | PixID | Counts | Sigma | Mean | Median | Sigma |
| A | 0 | 118 | 55076 | 350.57 | 756 | 744 | 155.0 |
| A | 0 | 50 | 22301 | 139.09 | 756 | 744 | 155.0 |
| A | 3 | 1 | 19269 | 119.53 | 756 | 744 | 155.0 |
| B | 15 | 204 | 435000 | 2906.78 | 777 | 760 | 149.4 |
| B | 2 | 249 | 32272 | 210.94 | 777 | 760 | 149.4 |
| B | 4 | 170 | 12396 | 77.89 | 777 | 760 | 149.4 |
| C | 14 | 48 | 40664 | 230.6 | 739 | 746 | 173.1 |
| C | 14 | 223 | 33185 | 187.39 | 739 | 746 | 173.1 |
| C | 6 | 80 | 26654 | 149.67 | 739 | 746 | 173.1 |
| D | 13 | 223 | 230805 | 1312.47 | 721 | 702 | 175.3 |
| D | 13 | 114 | 186930 | 1062.22 | 721 | 702 | 175.3 |
| D | 13 | 239 | 52994 | 298.27 | 721 | 702 | 175.3 |
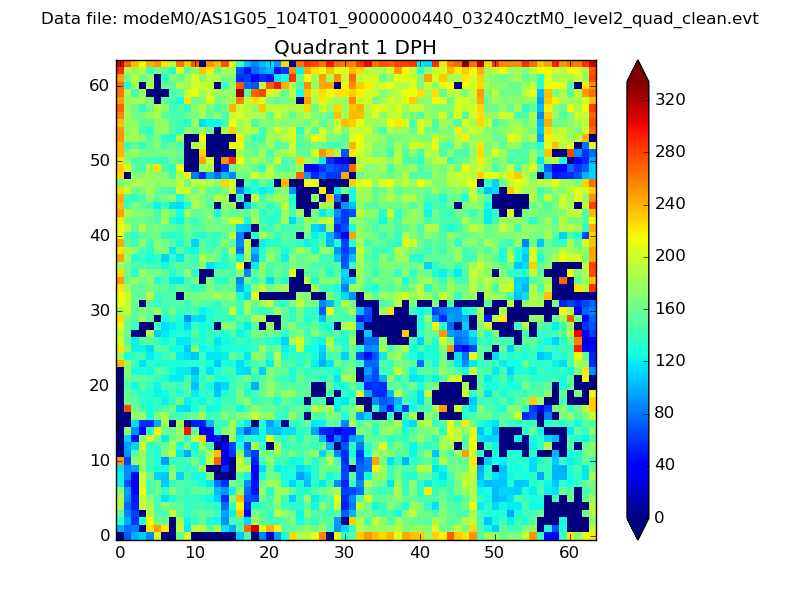
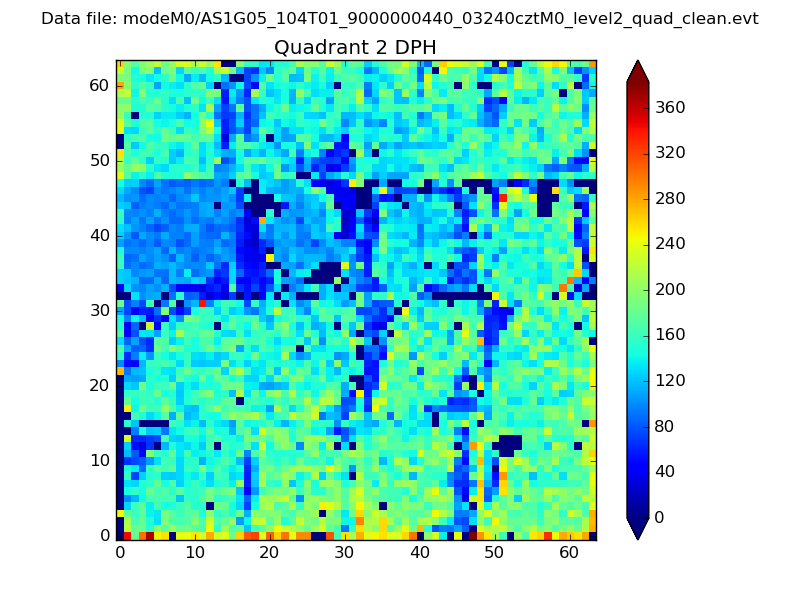
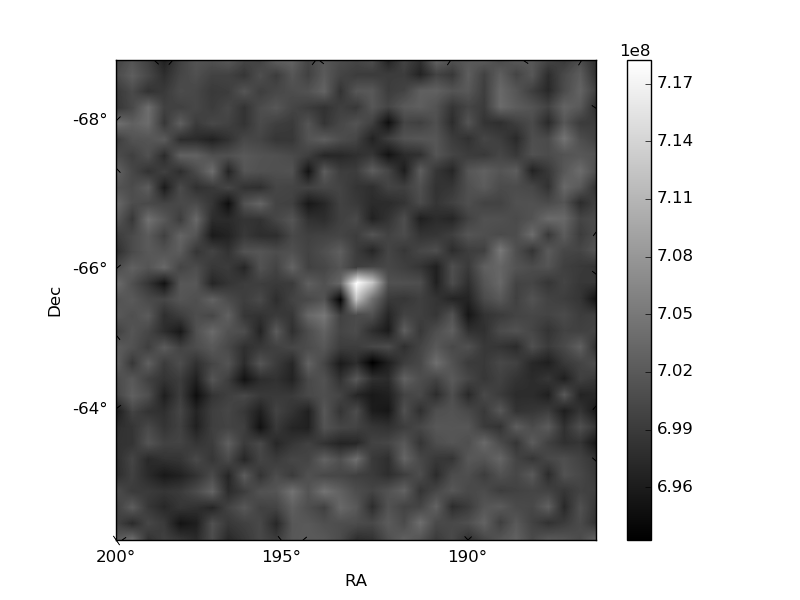
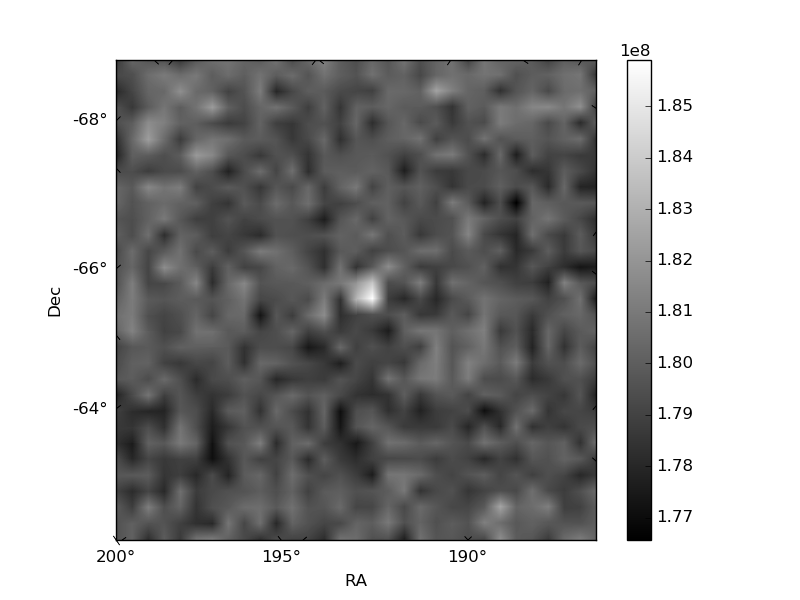
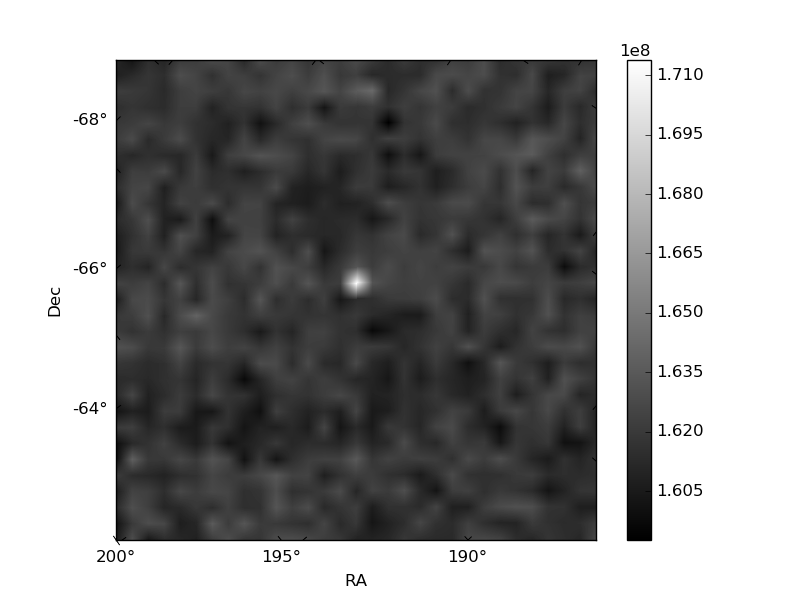
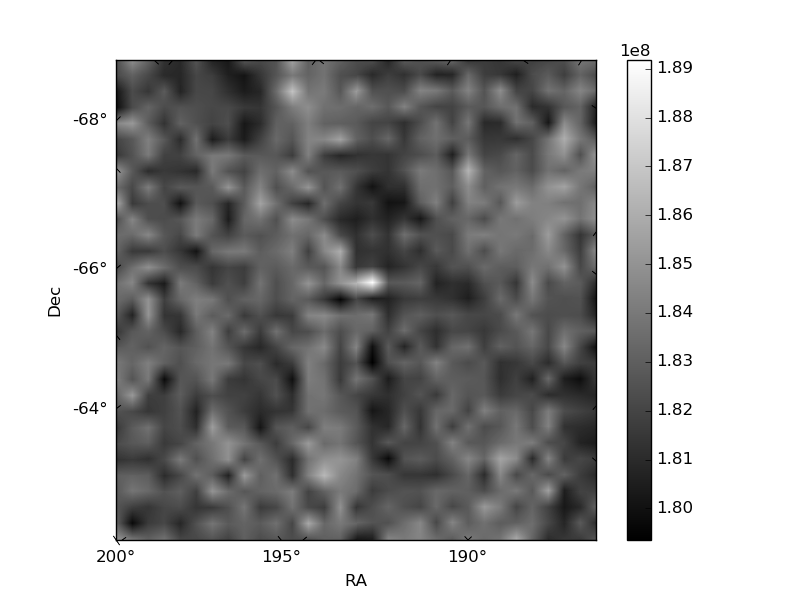
Histogram calculated using DETX and DETY for each event in the final _common_clean file
| Quadrant A |  |
 |
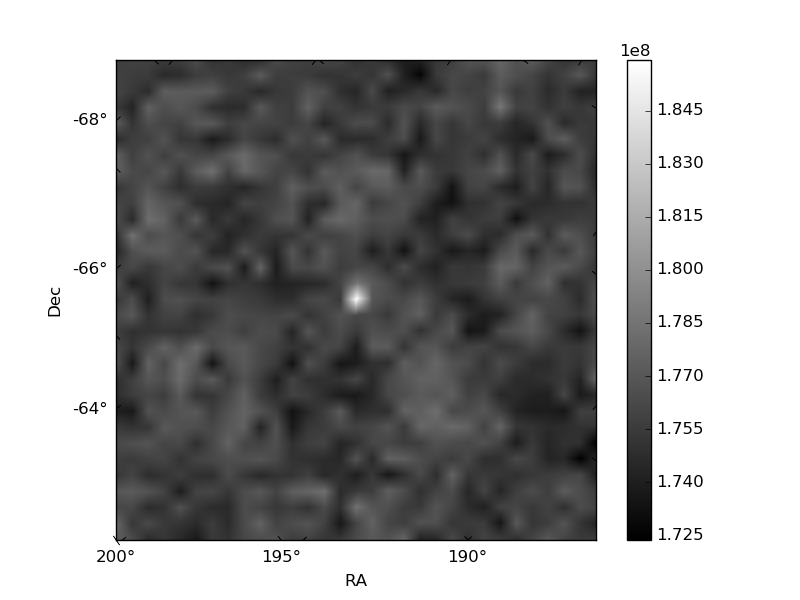
Quadrant B |
|---|---|---|---|
| Quadrant D | 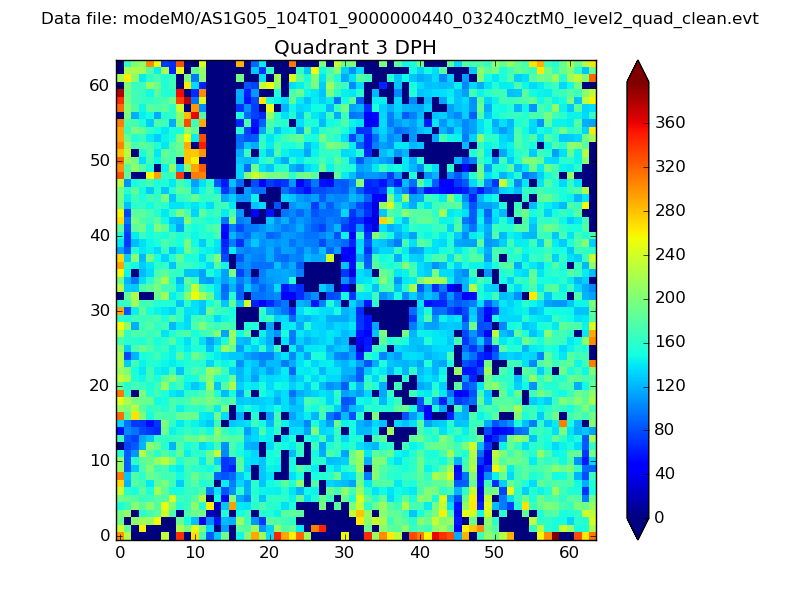 |
 |
Quadrant C |
| Plot type | Count rate plots | Images |
|---|---|---|
| Comparison with Poisson distribution Blue bars denote a histogram of data divided into 1 sec bins. Red curve is a Poisson curve with rate = median count rate of data. |
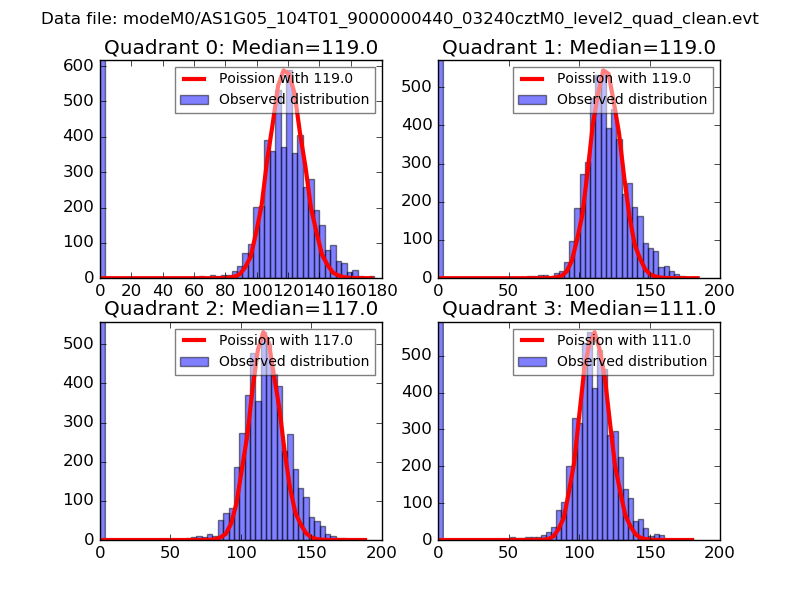 |
 |
| Quadrant-wise count rates Data is divided into 100 sec bins |
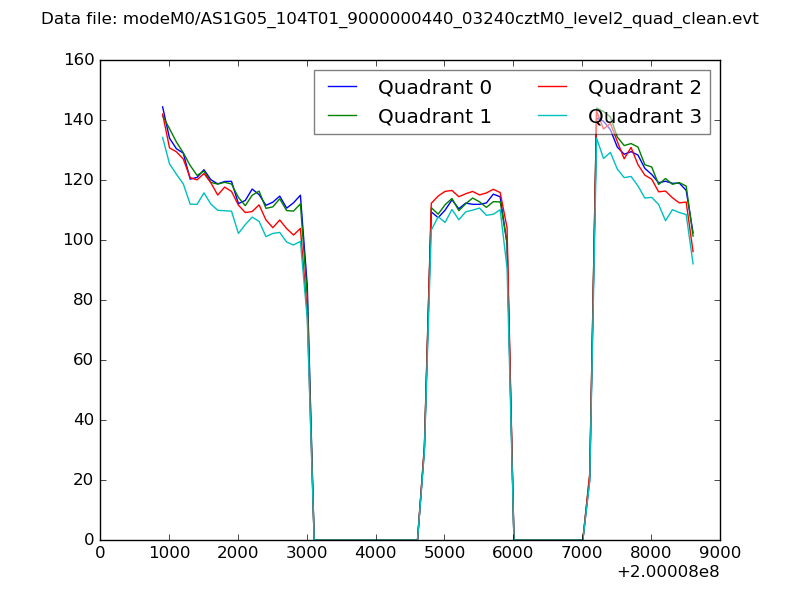 |
|
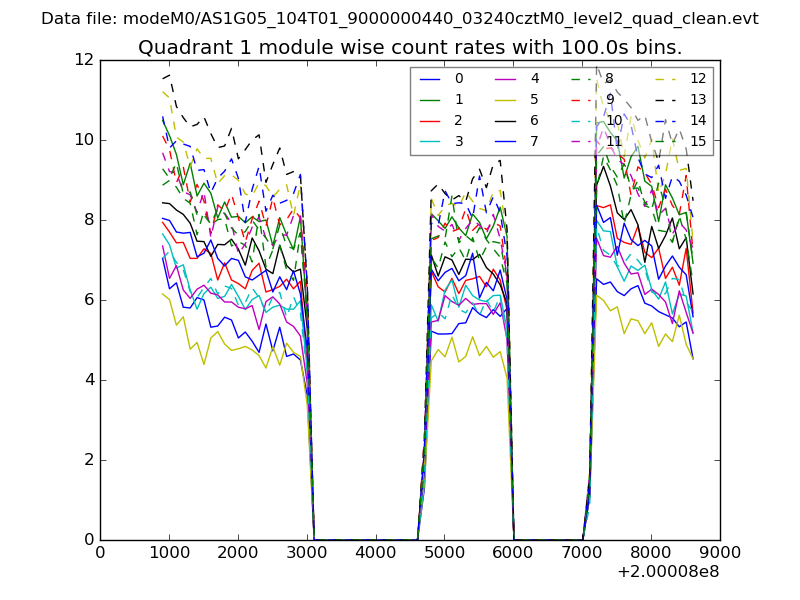
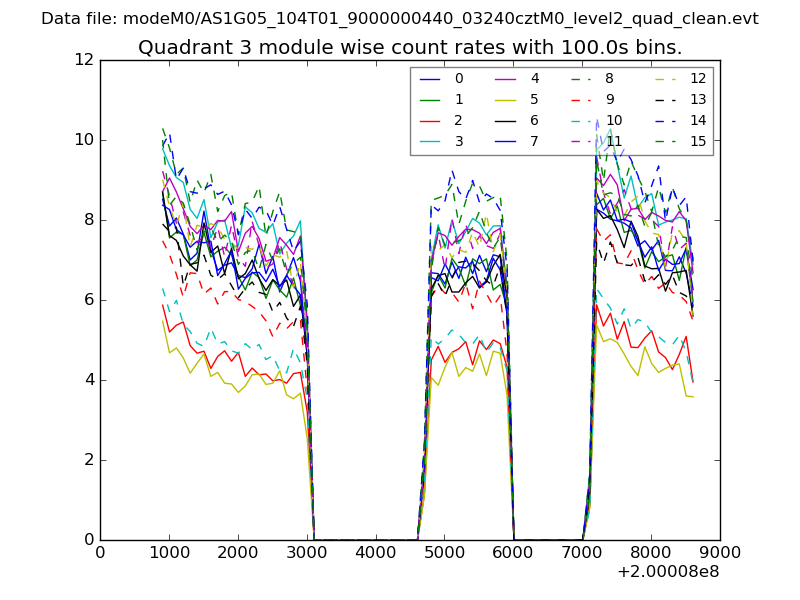
| Module-wise count rates for Quadrant A Data is divided into 100 sec bins |
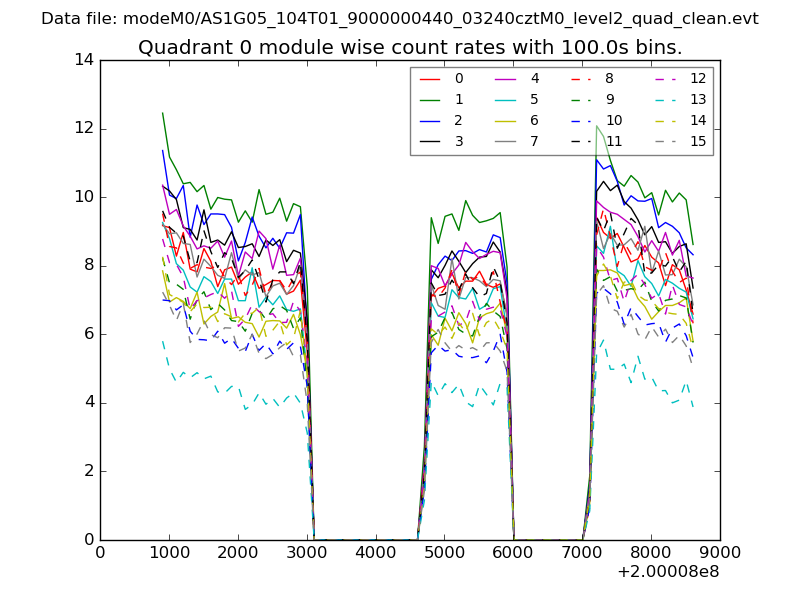 |
 |
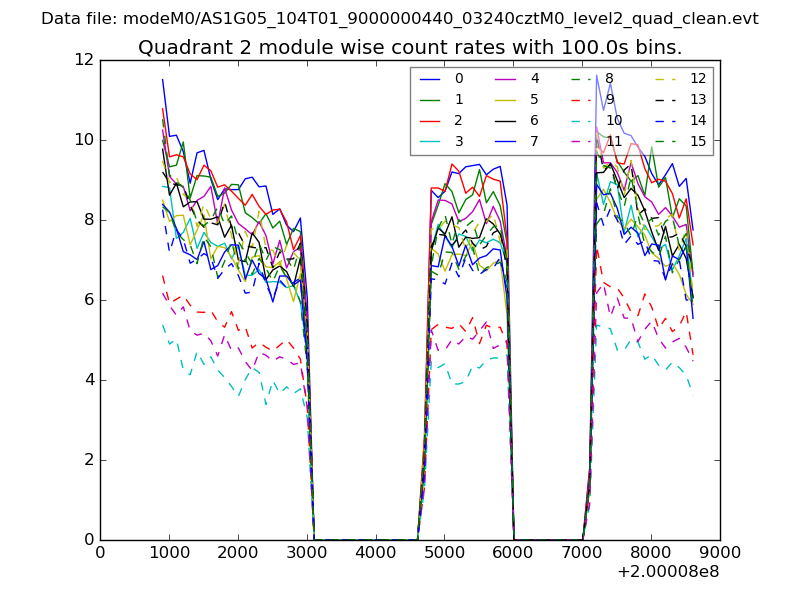
| Module-wise count rates for Quadrant B Data is divided into 100 sec bins |
 |
 |
| Module-wise count rates for Quadrant C Data is divided into 100 sec bins |
 |
 |
| Module-wise count rates for Quadrant D Data is divided into 100 sec bins |
 |
 |
| Parameter | Plot |
|---|---|
| CZT HV Monitor | 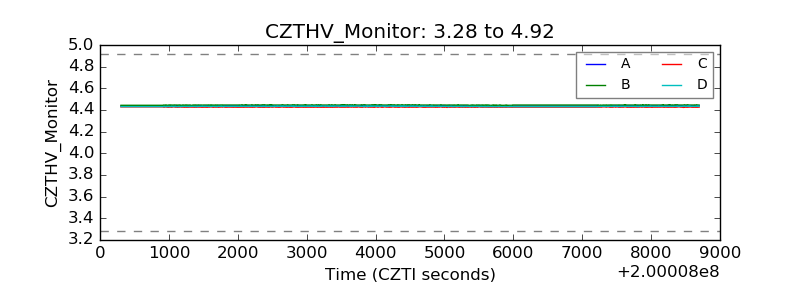 |
| D_VDD | 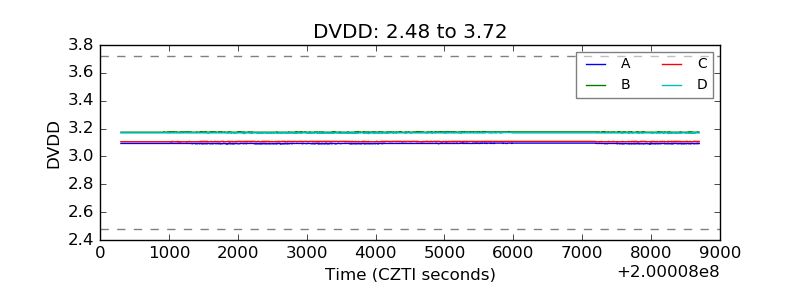 |
| Temperature 1 | 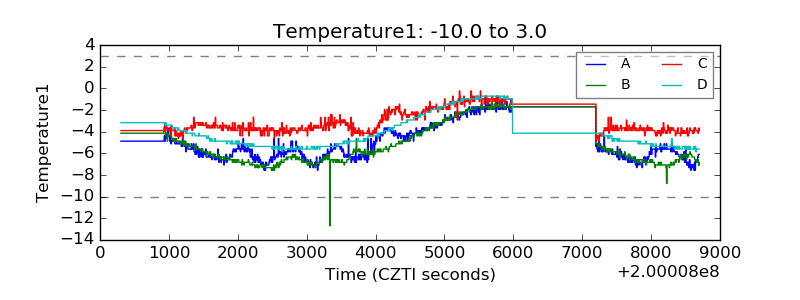 |
| Veto HV Monitor | 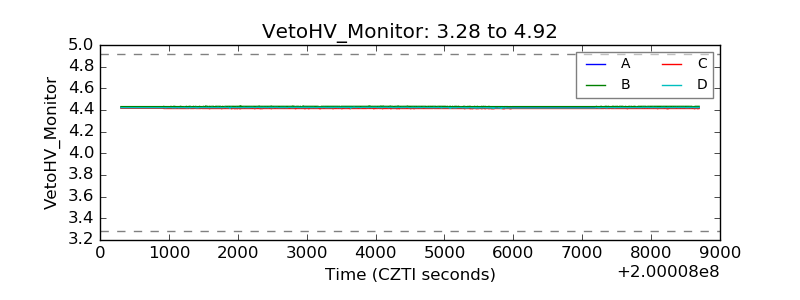 |
| Veto LLD |  |
| Alpha Counter | 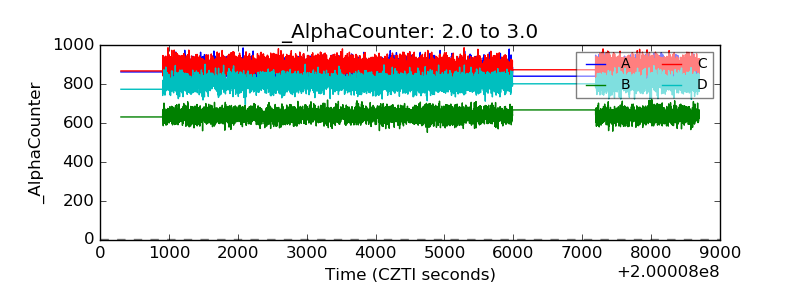 |
| _CPM_Rate | 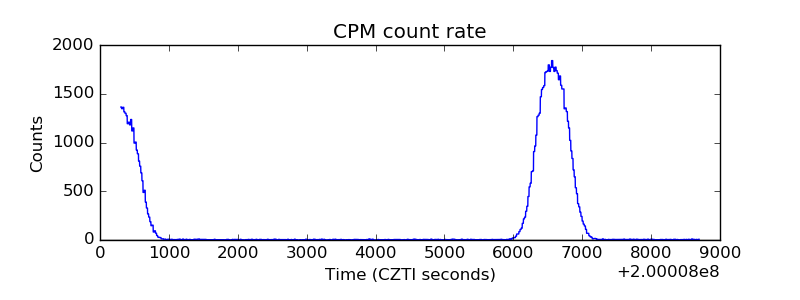 |
| CZT Counter | 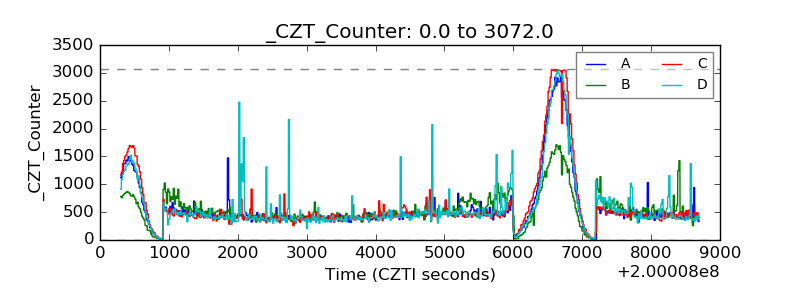 |
| +2.5 Volts monitor |  |
| +5 Volts monitor |  |
| _ROLL_ROT | 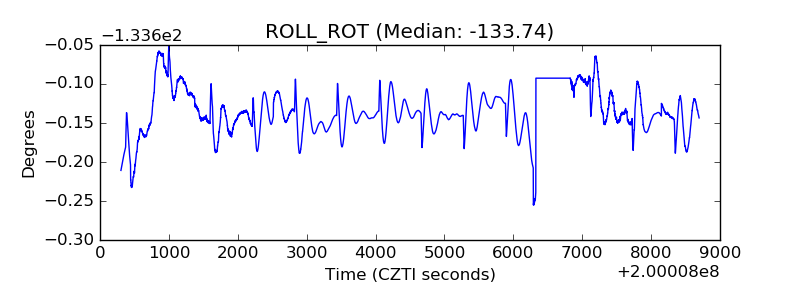 |
| _Roll_DEC | 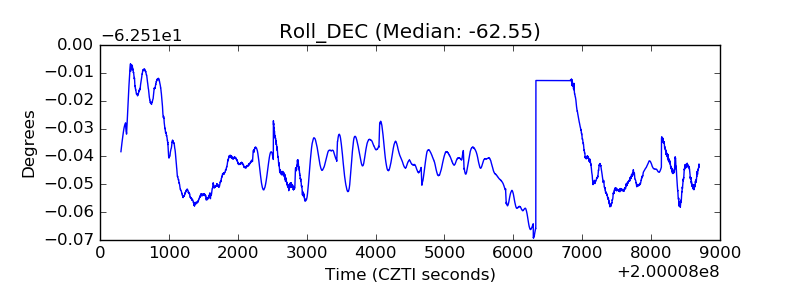 |
| _Roll_RA | 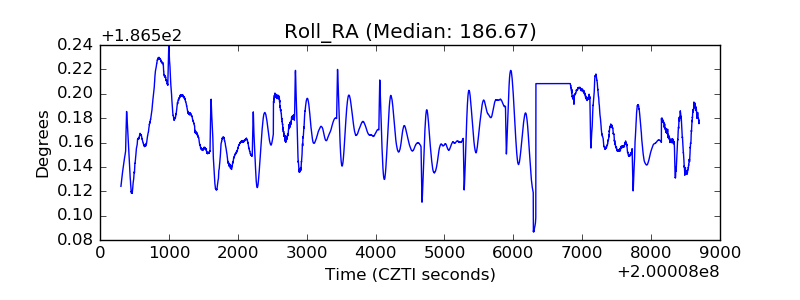 |
| Veto Counter | 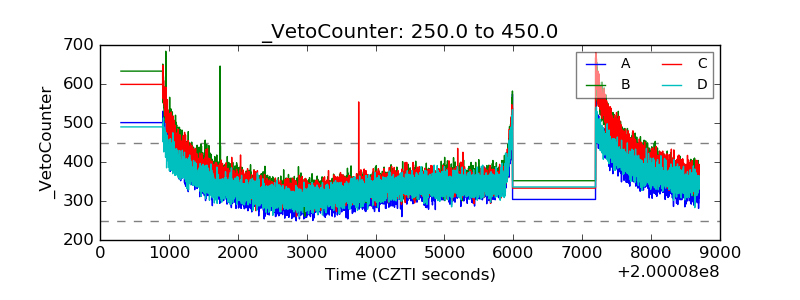 |