| Param | Original file | Final file |
|---|---|---|
| Filename | modeM0/AS1G05_104T01_9000000440_03241cztM0_level2.evt | modeM0/AS1G05_104T01_9000000440_03241cztM0_level2_quad_clean.evt |
| Size (bytes) | 466,536,960 | 88,539,840 |
| Size | 444.9 MB | 84.4 MB |
| Events in quadrant A | 3,072,985 | 562,668 |
| Events in quadrant B | 3,753,507 | 571,572 |
| Events in quadrant C | 3,299,469 | 560,527 |
| Events in quadrant D | 3,558,295 | 529,715 |
| Mode M0 | |||
|---|---|---|---|
| Quadrant | BADHDUFLAG | Total packets | Discarded packets |
| A | 0 | 13614 | 3 |
| B | 0 | 15482 | 2 |
| C | 0 | 14151 | 2 |
| D | 0 | 15264 | 2 |
| Mode SS | |||
|---|---|---|---|
| Quadrant | BADHDUFLAG | Total packets | Discarded packets |
| A | 0 | 132 | 0 |
| B | 0 | 132 | 0 |
| C | 0 | 132 | 0 |
| D | 0 | 132 | 0 |
| Mode M9 | |||
|---|---|---|---|
| Quadrant | BADHDUFLAG | Total packets | Discarded packets |
| A | 0 | 15 | 0 |
| B | 0 | 15 | 0 |
| C | 0 | 15 | 0 |
| D | 0 | 16 | 0 |
| Quadrant | Total seconds | Saturated seconds | Saturation percentage |
|---|---|---|---|
| A | 6553 | 27 | 0.412025% |
| B | 6553 | 54 | 0.824050% |
| C | 6553 | 82 | 1.251335% |
| D | 6553 | 84 | 1.281856% |
Noise dominated data is calculated using 1-second bins in cleaned event files. If a bin has >2000 counts, and if more than 50% of those come from <1% of pixels, then it is considered to be noise-dominated and hence unusable.
| Quadrant | # 1 sec bins | Bins with >0 counts | Bins with >2000 counts | High rate bins dominated by noise | Noise dominated (total time) | Noise dominated (detector-on time) | Marked lightcurve |
|---|---|---|---|---|---|---|---|
| A | 7808 | 6554 | 12 | 12 | 0.15% | 0.18% | 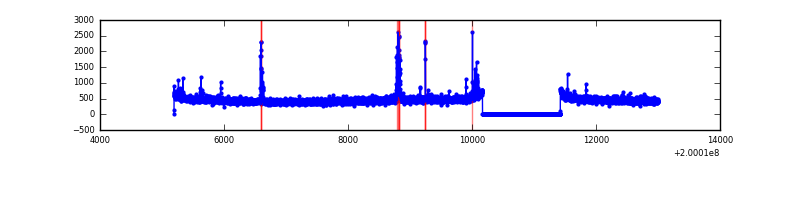 |
| B | 7808 | 6554 | 13 | 13 | 0.17% | 0.20% | 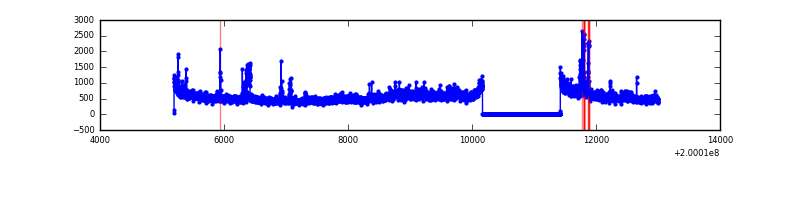 |
| C | 7808 | 6554 | 26 | 26 | 0.33% | 0.40% | 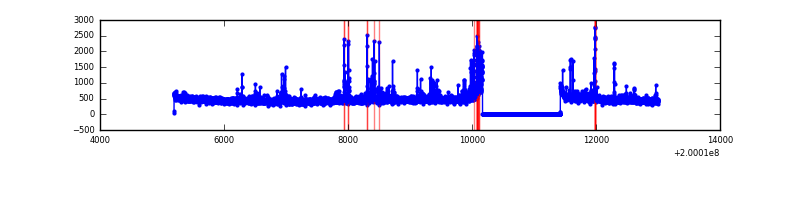 |
| D | 7808 | 6554 | 69 | 69 | 0.88% | 1.05% | 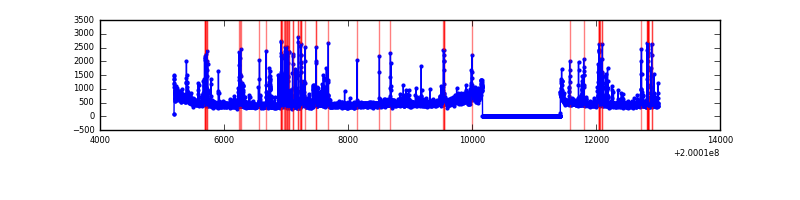 |
Top three noisy pixels from each quadrant. If the there are fewer than three noisy pixels in the level2.evt file, extra rows are filled as -1
| Pixel properties | Quadrant properties | ||||||
|---|---|---|---|---|---|---|---|
| Quadrant | DetID | PixID | Counts | Sigma | Mean | Median | Sigma |
| A | 0 | 118 | 80083 | 505.97 | 766 | 753 | 156.8 |
| A | 0 | 50 | 24896 | 153.99 | 766 | 753 | 156.8 |
| A | 0 | 226 | 16032 | 97.45 | 766 | 753 | 156.8 |
| B | 15 | 204 | 559193 | 3758.17 | 789 | 771 | 148.6 |
| B | 5 | 200 | 63252 | 420.5 | 789 | 771 | 148.6 |
| B | 2 | 249 | 33798 | 222.27 | 789 | 771 | 148.6 |
| C | 14 | 223 | 195684 | 1112.97 | 754 | 760 | 175.1 |
| C | 6 | 80 | 91200 | 516.39 | 754 | 760 | 175.1 |
| C | 15 | 208 | 34541 | 192.88 | 754 | 760 | 175.1 |
| D | 13 | 223 | 330056 | 1849.48 | 737 | 718 | 178.1 |
| D | 13 | 239 | 201950 | 1130.07 | 737 | 718 | 178.1 |
| D | 13 | 114 | 167741 | 937.96 | 737 | 718 | 178.1 |
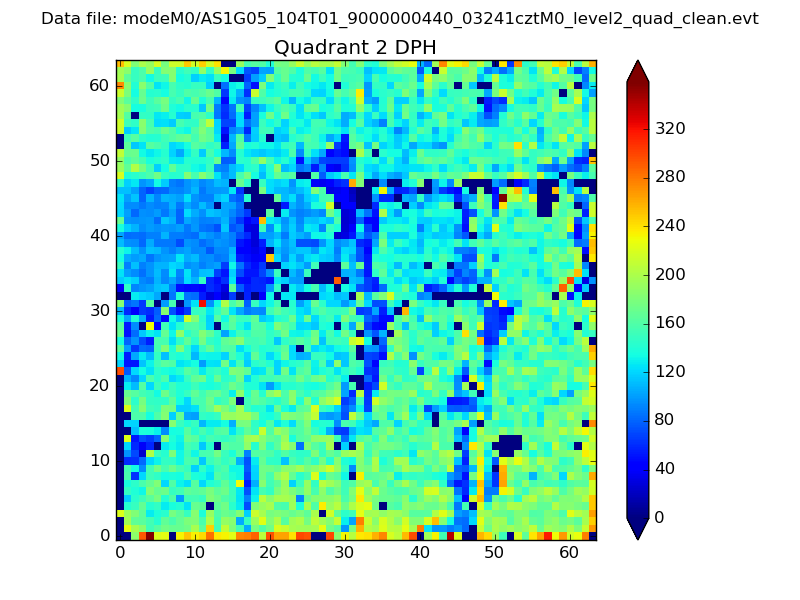
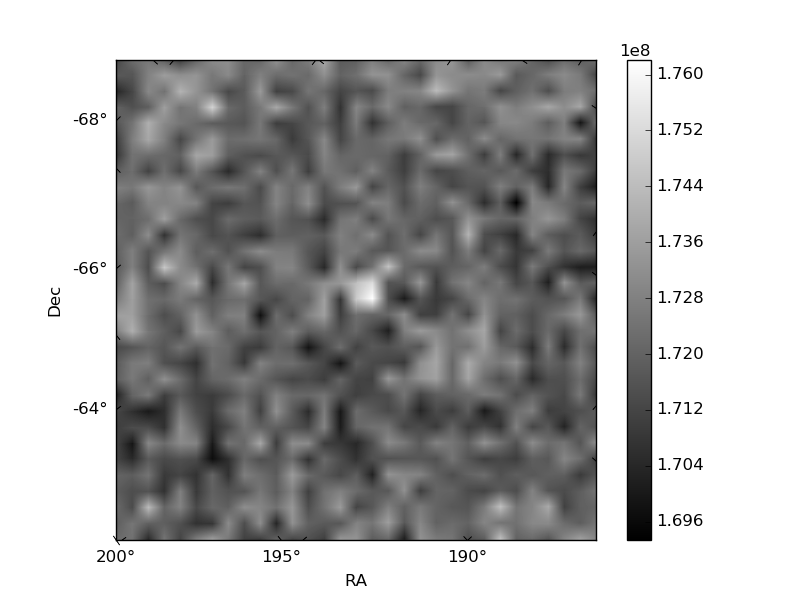
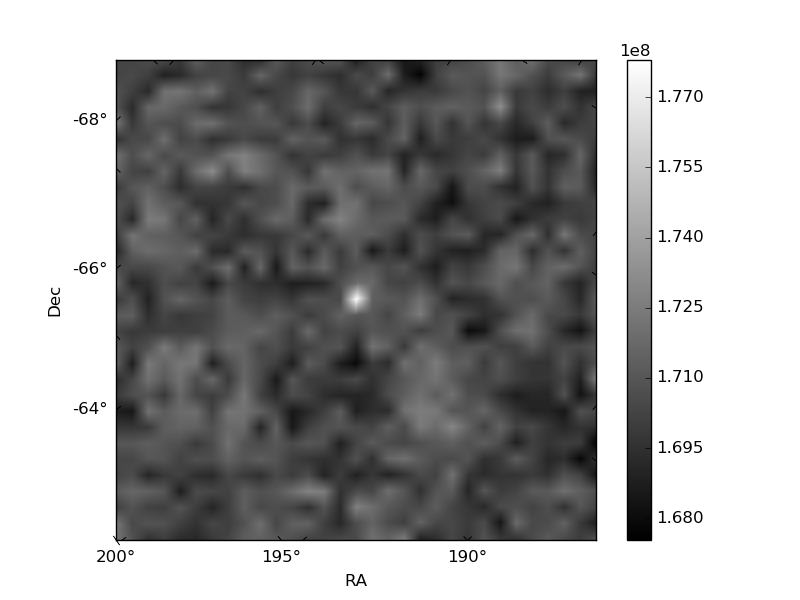
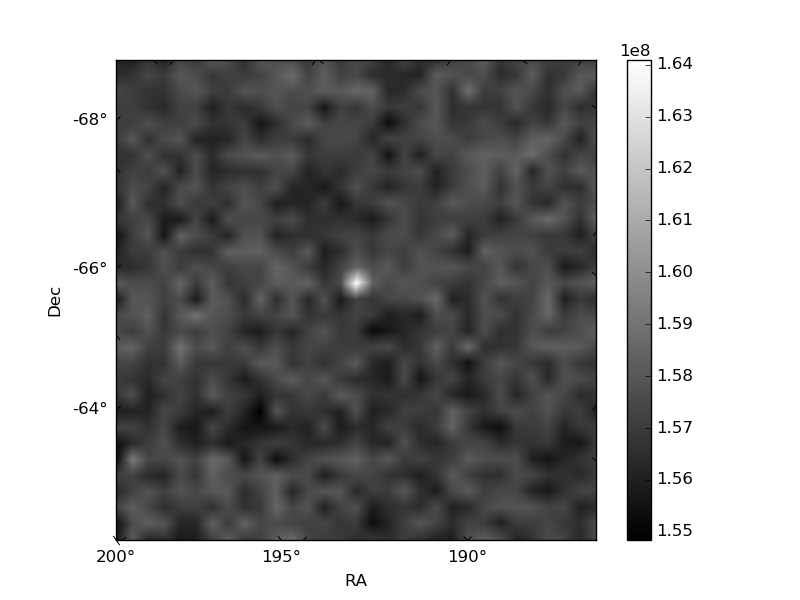
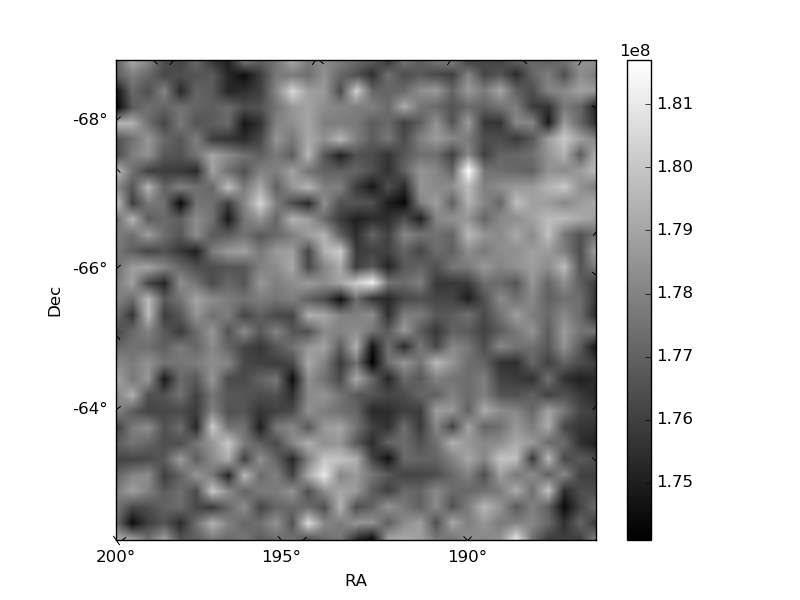
Histogram calculated using DETX and DETY for each event in the final _common_clean file
| Quadrant A | 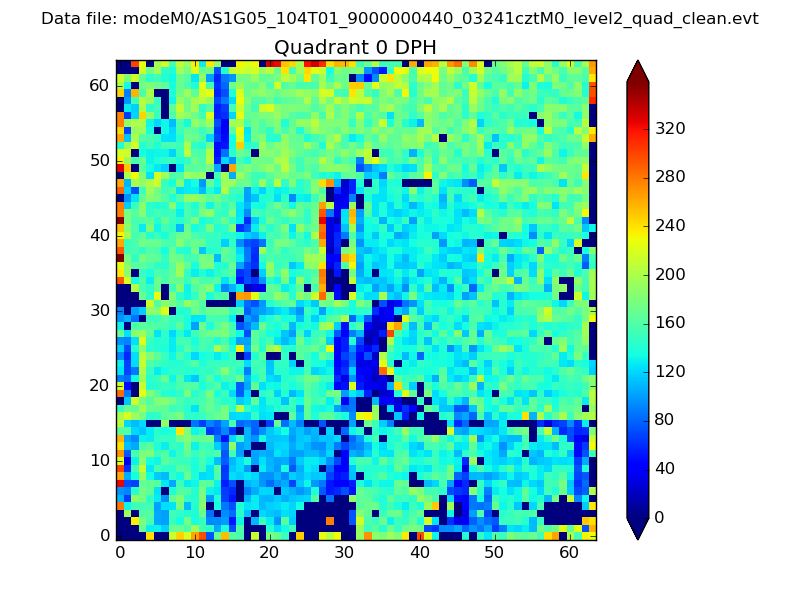 |
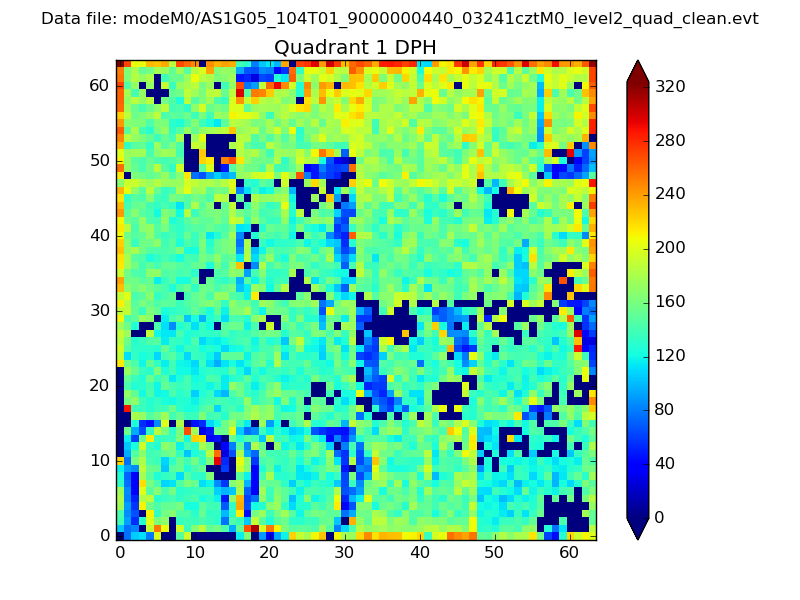 |
Quadrant B |
|---|---|---|---|
| Quadrant D | 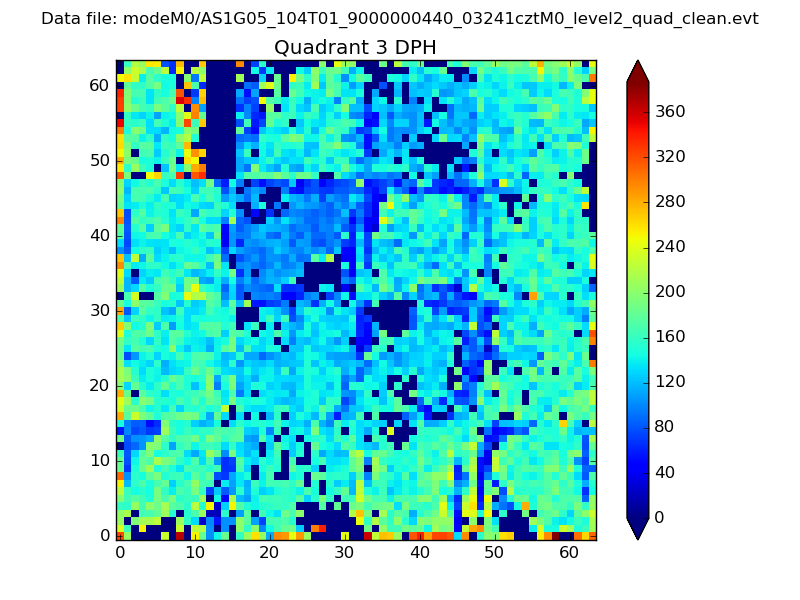 |
 |
Quadrant C |
| Plot type | Count rate plots | Images |
|---|---|---|
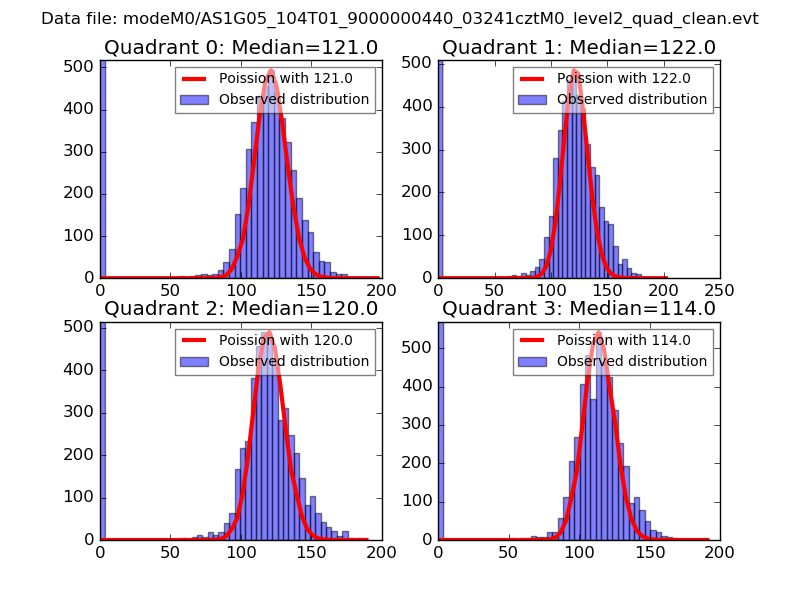
| Comparison with Poisson distribution Blue bars denote a histogram of data divided into 1 sec bins. Red curve is a Poisson curve with rate = median count rate of data. |
 |
 |
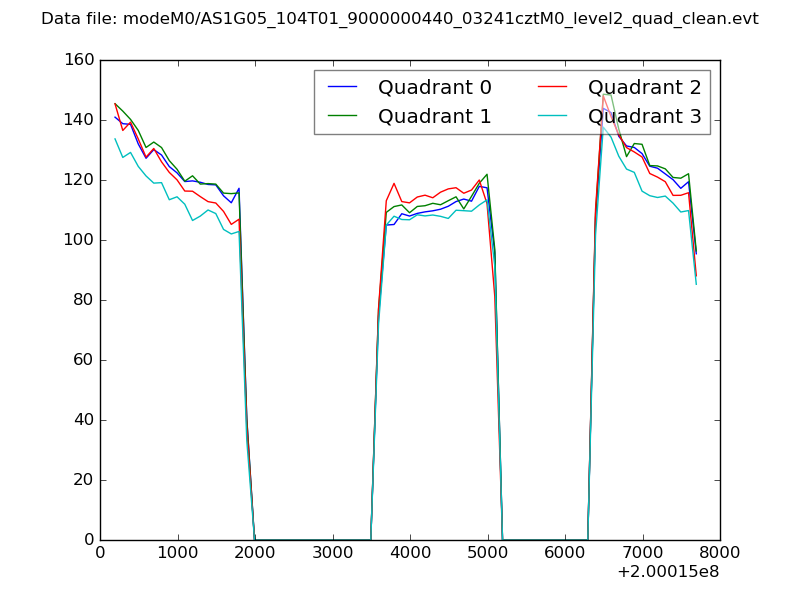
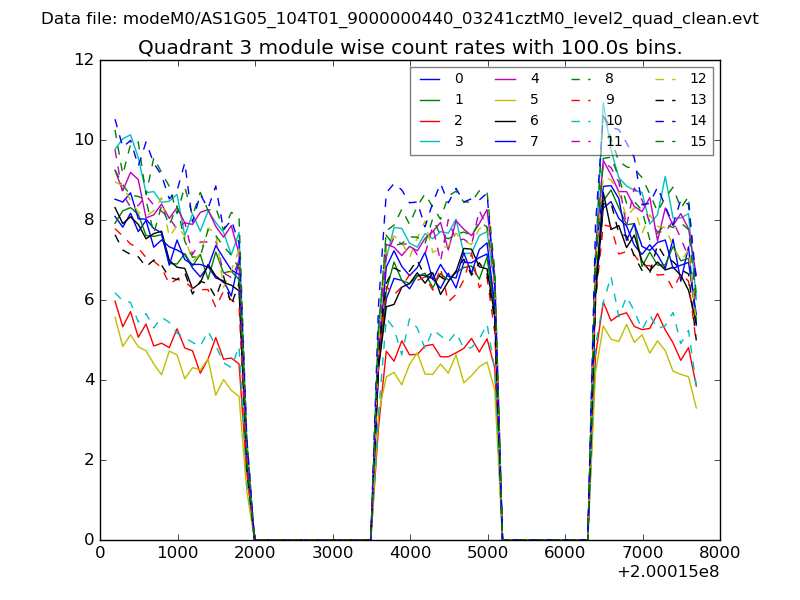
| Quadrant-wise count rates Data is divided into 100 sec bins |
 |
|
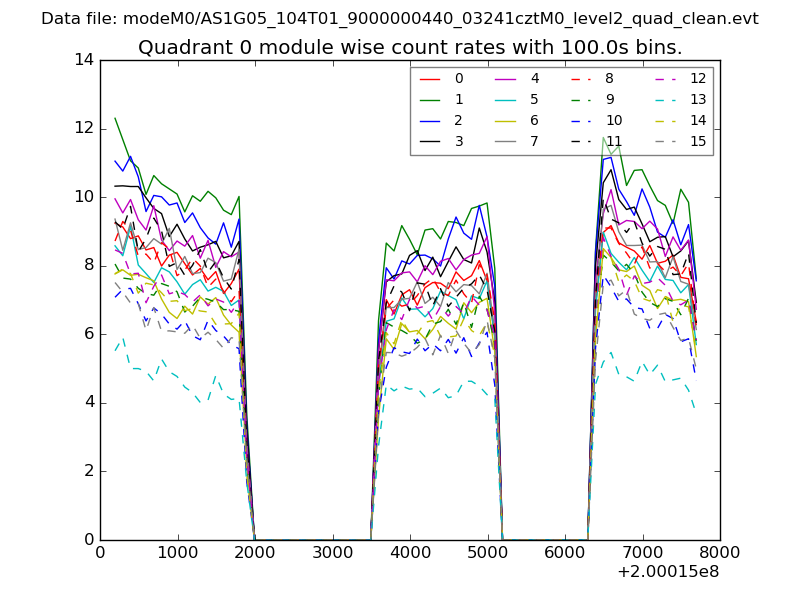
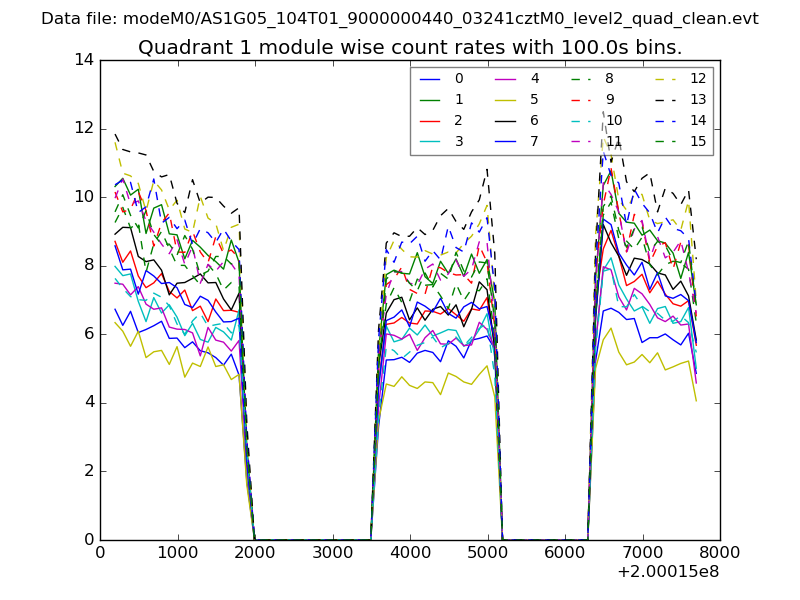
| Module-wise count rates for Quadrant A Data is divided into 100 sec bins |
 |
 |
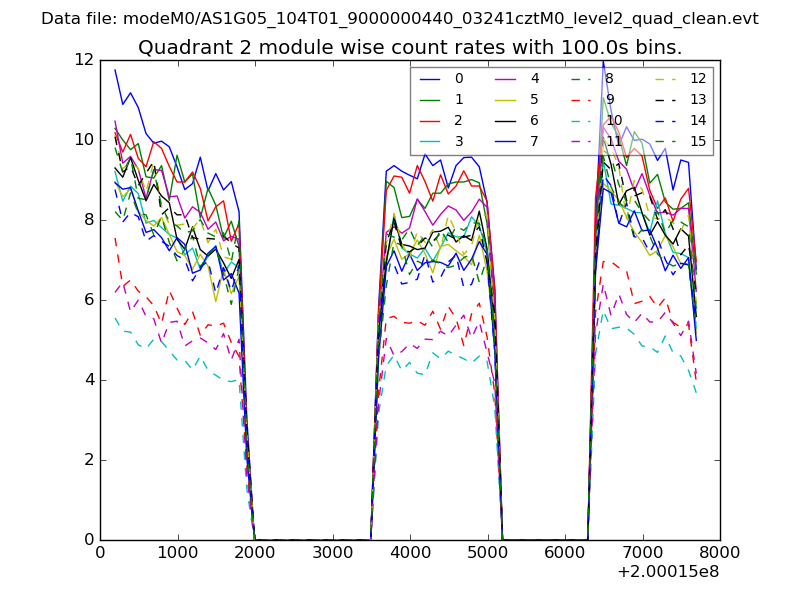
| Module-wise count rates for Quadrant B Data is divided into 100 sec bins |
 |
 |
| Module-wise count rates for Quadrant C Data is divided into 100 sec bins |
 |
 |
| Module-wise count rates for Quadrant D Data is divided into 100 sec bins |
 |
 |
| Parameter | Plot |
|---|---|
| CZT HV Monitor | 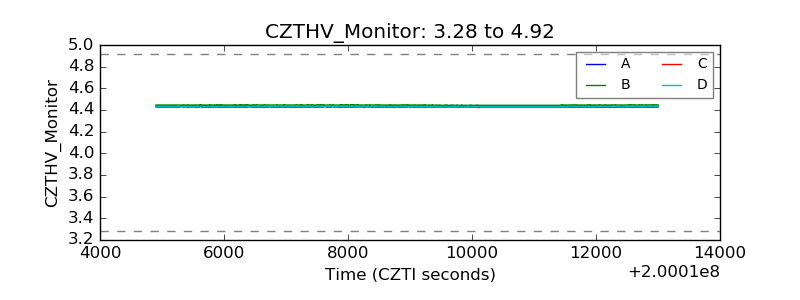 |
| D_VDD | 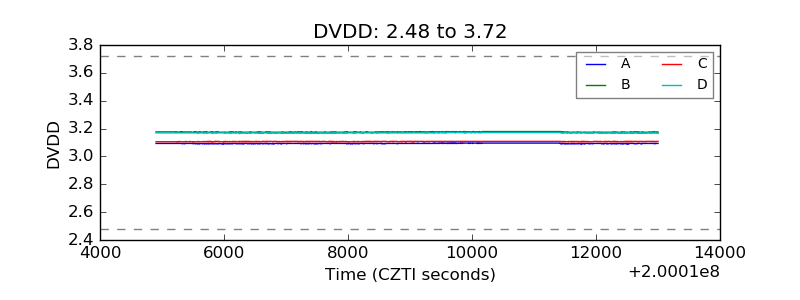 |
| Temperature 1 |  |
| Veto HV Monitor | 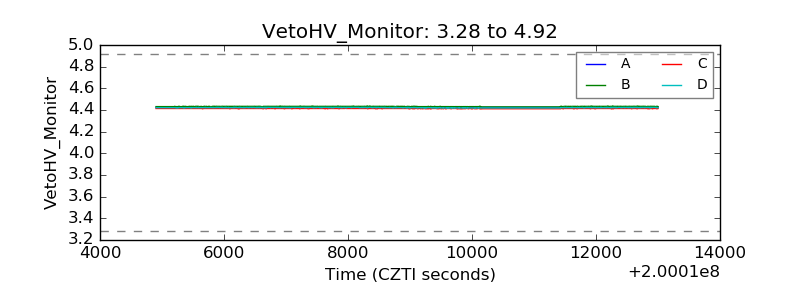 |
| Veto LLD |  |
| Alpha Counter | 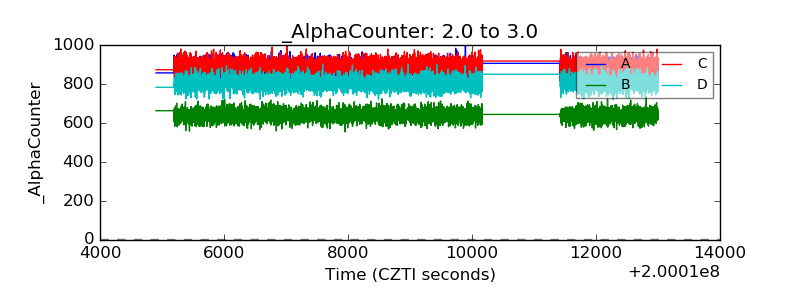 |
| _CPM_Rate | 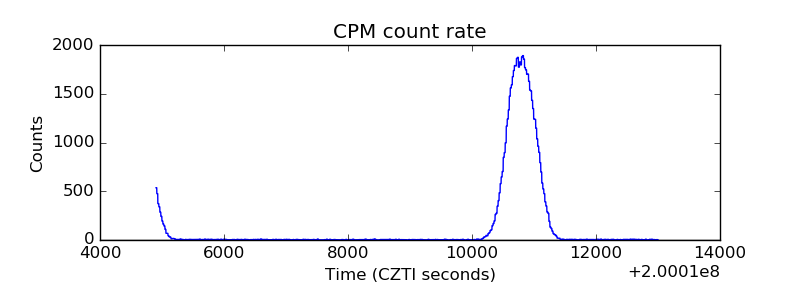 |
| CZT Counter | 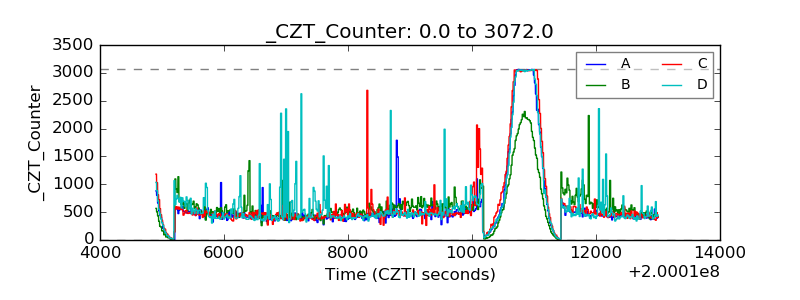 |
| +2.5 Volts monitor |  |
| +5 Volts monitor |  |
| _ROLL_ROT | 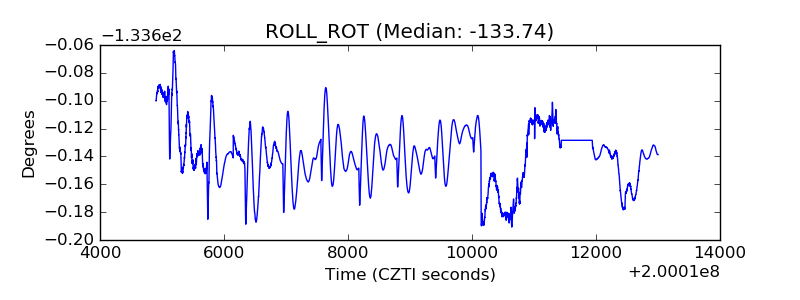 |
| _Roll_DEC | 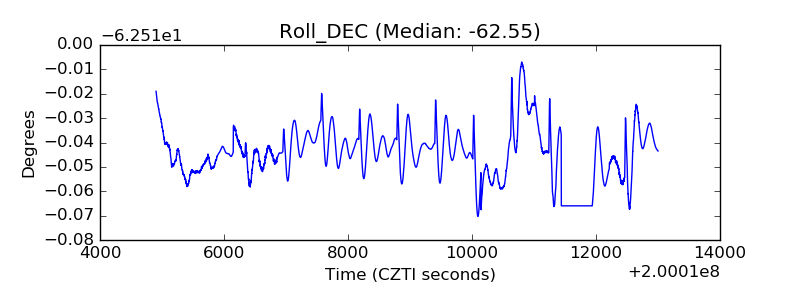 |
| _Roll_RA | 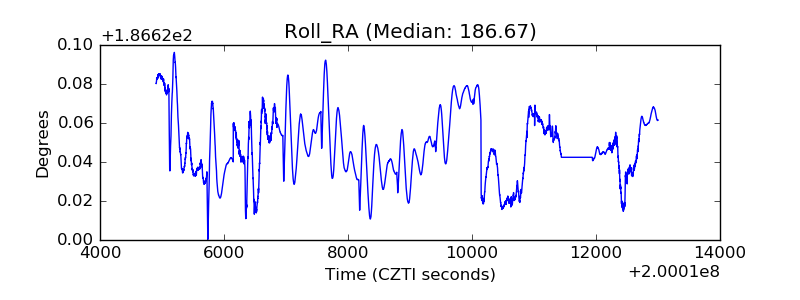 |
| Veto Counter | 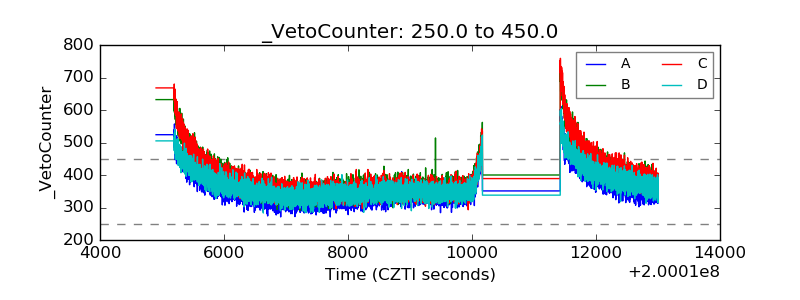 |