| Param | Original file | Final file |
|---|---|---|
| Filename | modeM0/AS1G05_104T01_9000000440_03242cztM0_level2.evt | modeM0/AS1G05_104T01_9000000440_03242cztM0_level2_quad_clean.evt |
| Size (bytes) | 469,719,360 | 70,931,520 |
| Size | 448.0 MB | 67.6 MB |
| Events in quadrant A | 2,721,428 | 439,475 |
| Events in quadrant B | 3,302,875 | 446,419 |
| Events in quadrant C | 4,541,404 | 432,534 |
| Events in quadrant D | 3,258,924 | 416,621 |
| Mode M0 | |||
|---|---|---|---|
| Quadrant | BADHDUFLAG | Total packets | Discarded packets |
| A | 0 | 12096 | 2 |
| B | 0 | 13616 | 1 |
| C | 0 | 17596 | 1 |
| D | 0 | 13835 | 1 |
| Mode SS | |||
|---|---|---|---|
| Quadrant | BADHDUFLAG | Total packets | Discarded packets |
| A | 0 | 120 | 0 |
| B | 0 | 120 | 0 |
| C | 0 | 120 | 0 |
| D | 0 | 120 | 0 |
| Mode M9 | |||
|---|---|---|---|
| Quadrant | BADHDUFLAG | Total packets | Discarded packets |
| A | 0 | 13 | 0 |
| B | 0 | 13 | 0 |
| C | 0 | 13 | 0 |
| D | 0 | 13 | 0 |
| Quadrant | Total seconds | Saturated seconds | Saturation percentage |
|---|---|---|---|
| A | 5906 | 18 | 0.304775% |
| B | 5906 | 44 | 0.745005% |
| C | 5906 | 320 | 5.418219% |
| D | 5906 | 111 | 1.879445% |
Noise dominated data is calculated using 1-second bins in cleaned event files. If a bin has >2000 counts, and if more than 50% of those come from <1% of pixels, then it is considered to be noise-dominated and hence unusable.
| Quadrant | # 1 sec bins | Bins with >0 counts | Bins with >2000 counts | High rate bins dominated by noise | Noise dominated (total time) | Noise dominated (detector-on time) | Marked lightcurve |
|---|---|---|---|---|---|---|---|
| A | 7186 | 5907 | 3 | 3 | 0.04% | 0.05% | 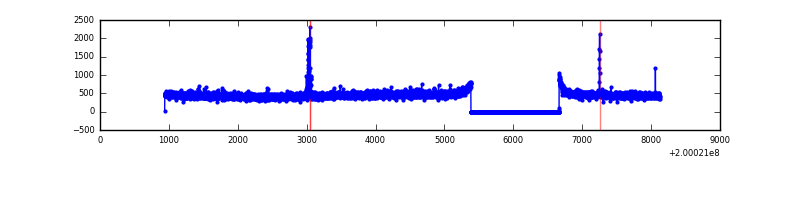 |
| B | 7186 | 5907 | 7 | 7 | 0.10% | 0.12% | 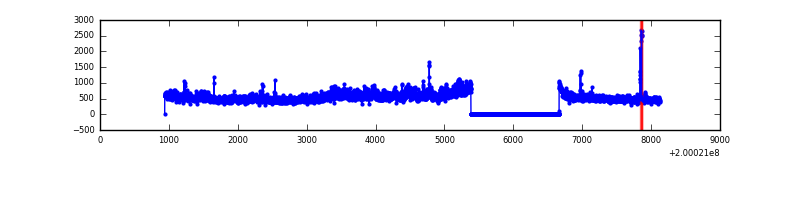 |
| C | 7186 | 5907 | 280 | 280 | 3.90% | 4.74% | 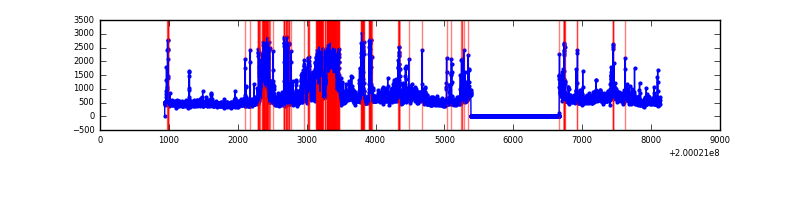 |
| D | 7186 | 5907 | 90 | 90 | 1.25% | 1.52% | 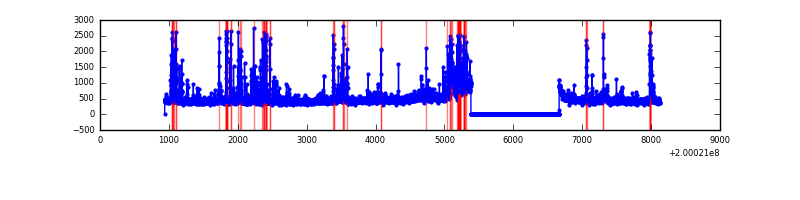 |
Top three noisy pixels from each quadrant. If the there are fewer than three noisy pixels in the level2.evt file, extra rows are filled as -1
| Pixel properties | Quadrant properties | ||||||
|---|---|---|---|---|---|---|---|
| Quadrant | DetID | PixID | Counts | Sigma | Mean | Median | Sigma |
| A | 0 | 118 | 49154 | 344.03 | 691 | 677 | 140.9 |
| A | 0 | 226 | 11819 | 79.07 | 691 | 677 | 140.9 |
| A | 12 | 194 | 7434 | 47.95 | 691 | 677 | 140.9 |
| B | 15 | 204 | 485568 | 3659.05 | 708 | 693 | 132.5 |
| B | 2 | 249 | 55742 | 415.42 | 708 | 693 | 132.5 |
| B | 0 | 229 | 9056 | 63.11 | 708 | 693 | 132.5 |
| C | 14 | 48 | 1386708 | 8898.85 | 674 | 679 | 155.8 |
| C | 14 | 223 | 296413 | 1898.73 | 674 | 679 | 155.8 |
| C | 14 | 234 | 141093 | 901.51 | 674 | 679 | 155.8 |
| D | 13 | 223 | 447518 | 2766.95 | 670 | 653 | 161.5 |
| D | 13 | 239 | 130028 | 801.08 | 670 | 653 | 161.5 |
| D | 13 | 114 | 81264 | 499.14 | 670 | 653 | 161.5 |
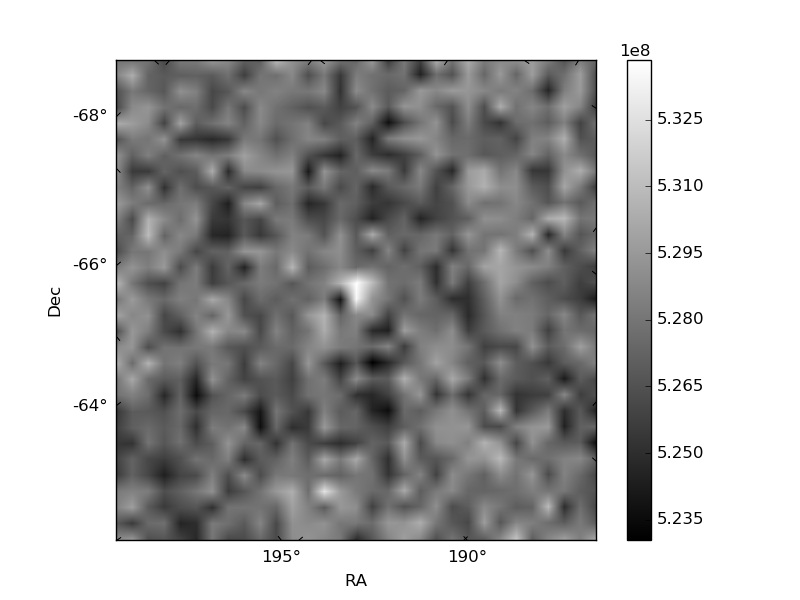
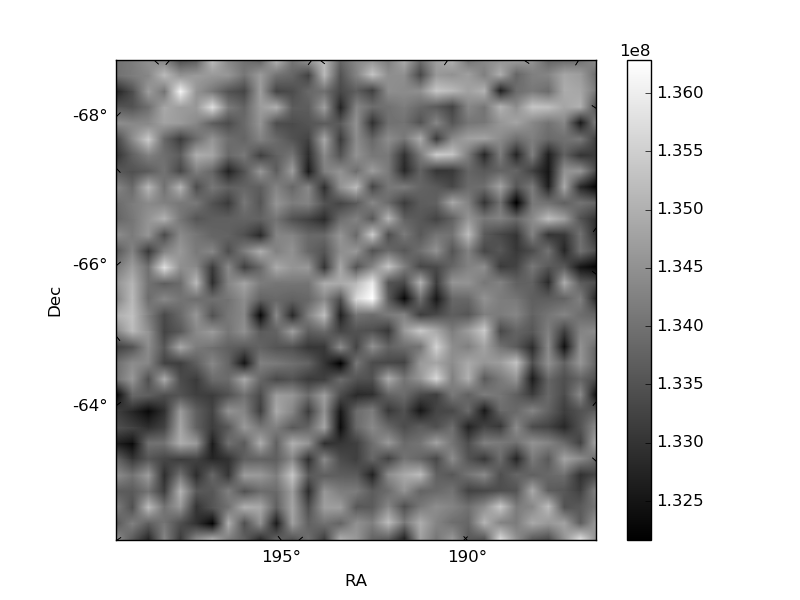
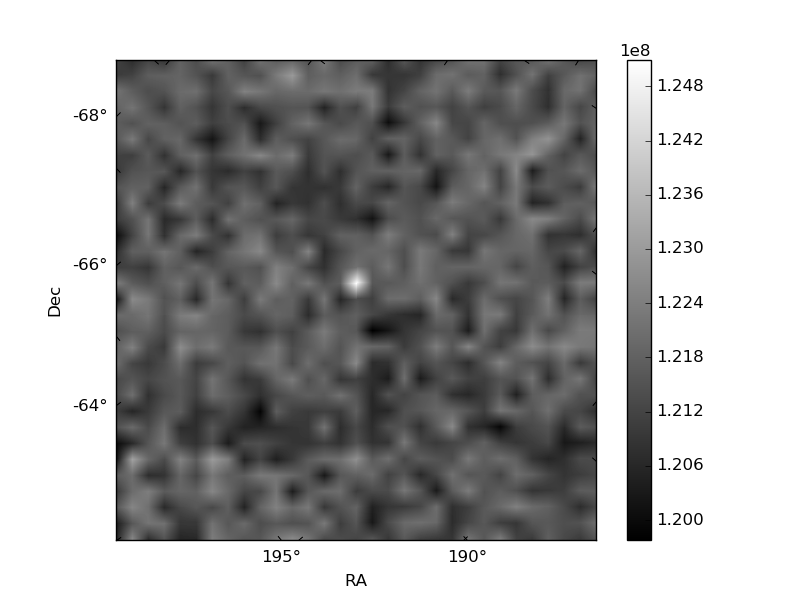
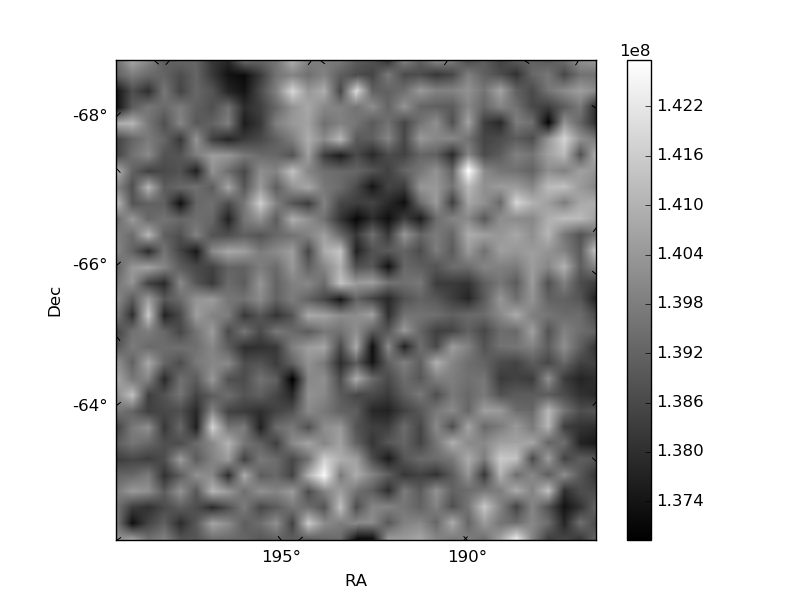
Histogram calculated using DETX and DETY for each event in the final _common_clean file
| Quadrant A | 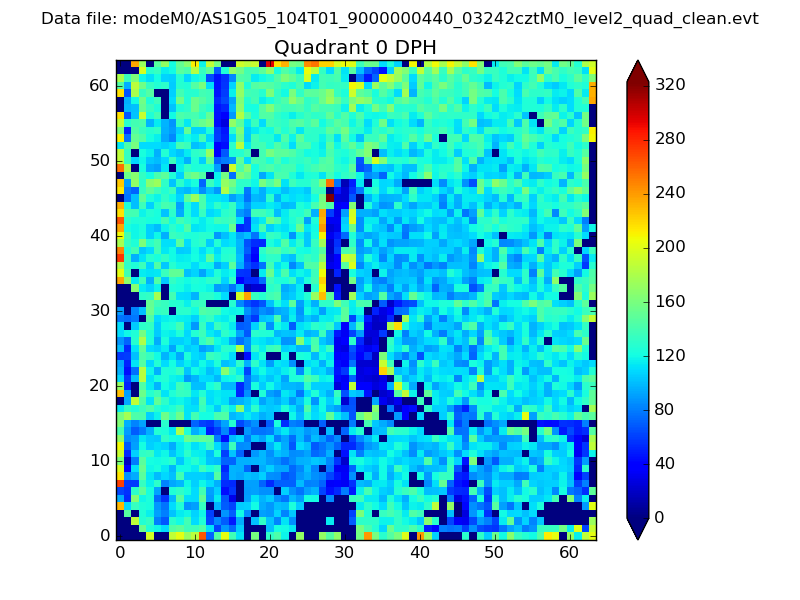 |
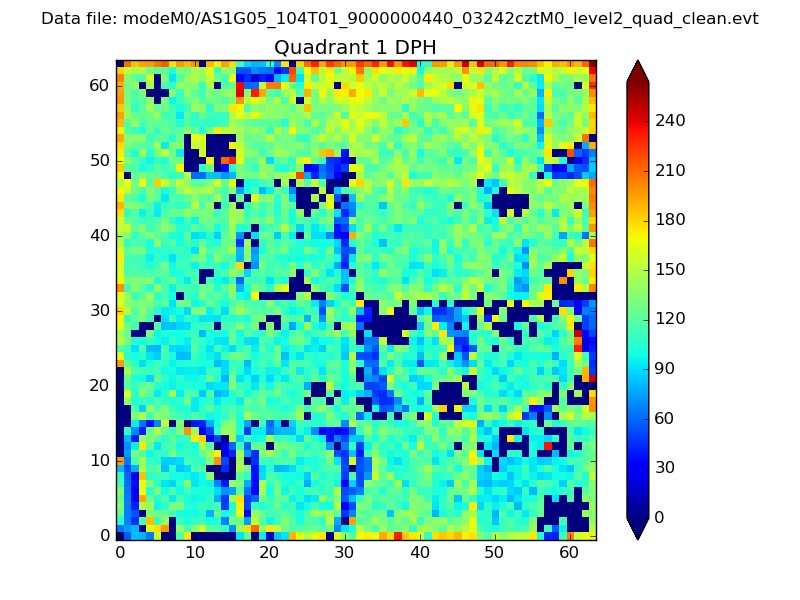 |
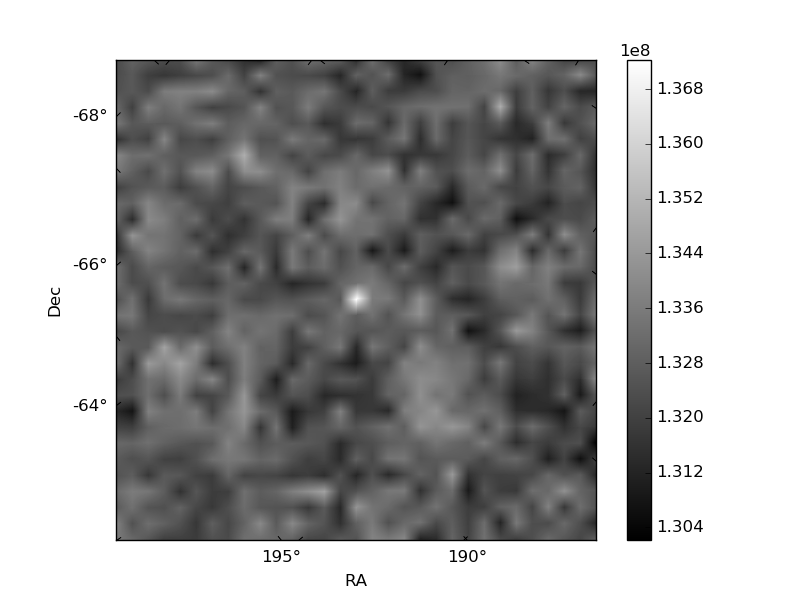
Quadrant B |
|---|---|---|---|
| Quadrant D | 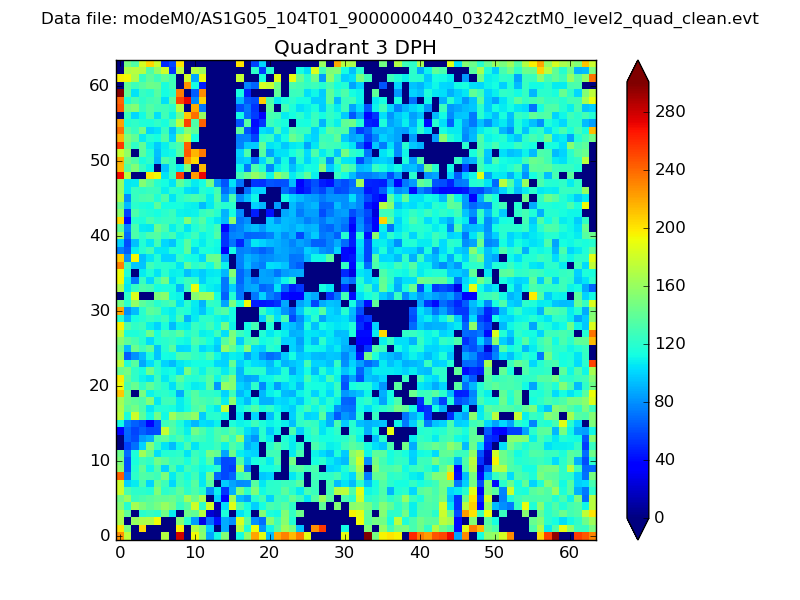 |
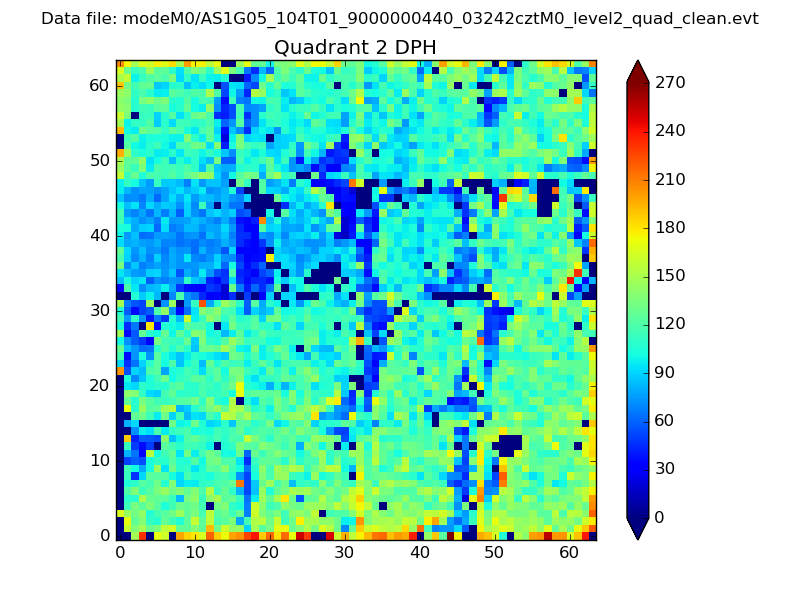 |
Quadrant C |
| Plot type | Count rate plots | Images |
|---|---|---|
| Comparison with Poisson distribution Blue bars denote a histogram of data divided into 1 sec bins. Red curve is a Poisson curve with rate = median count rate of data. |
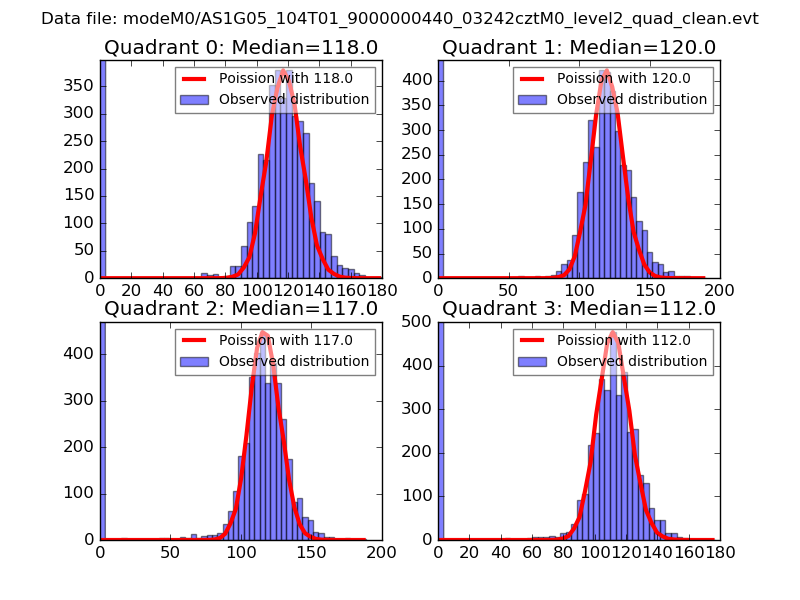 |
 |
| Quadrant-wise count rates Data is divided into 100 sec bins |
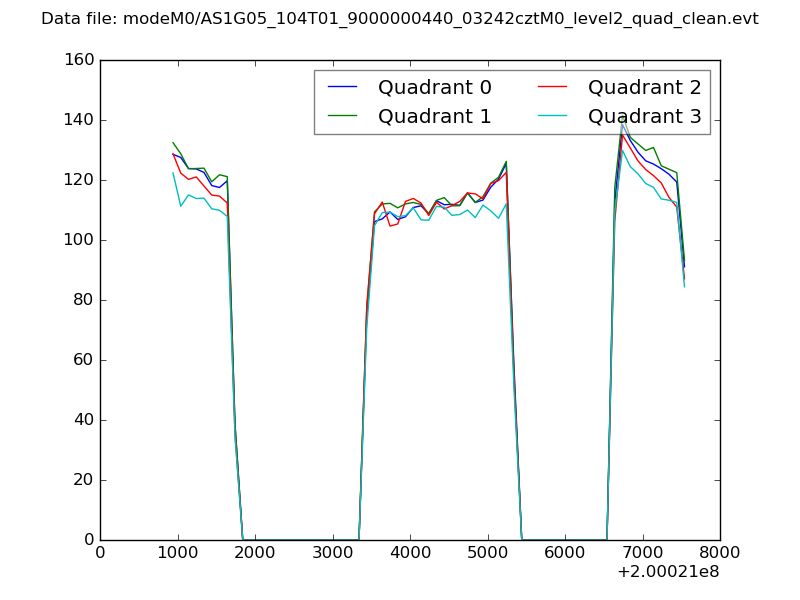 |
|
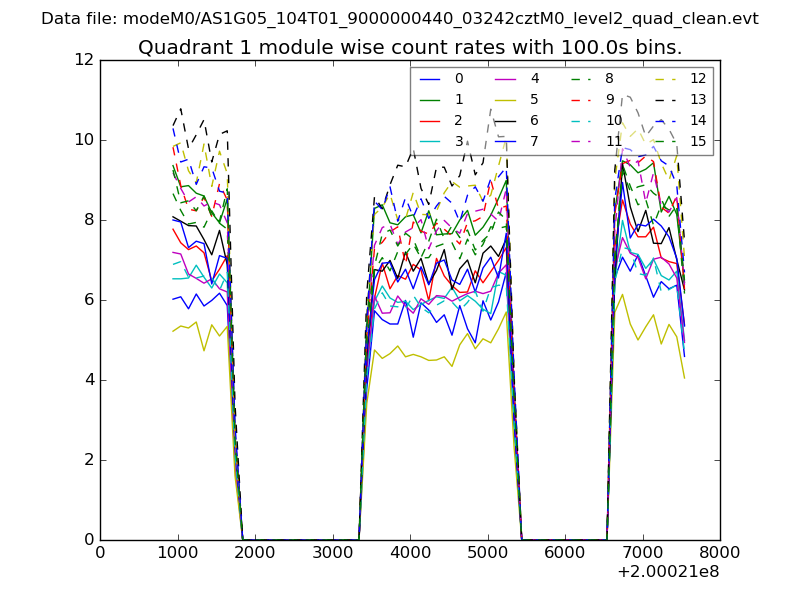
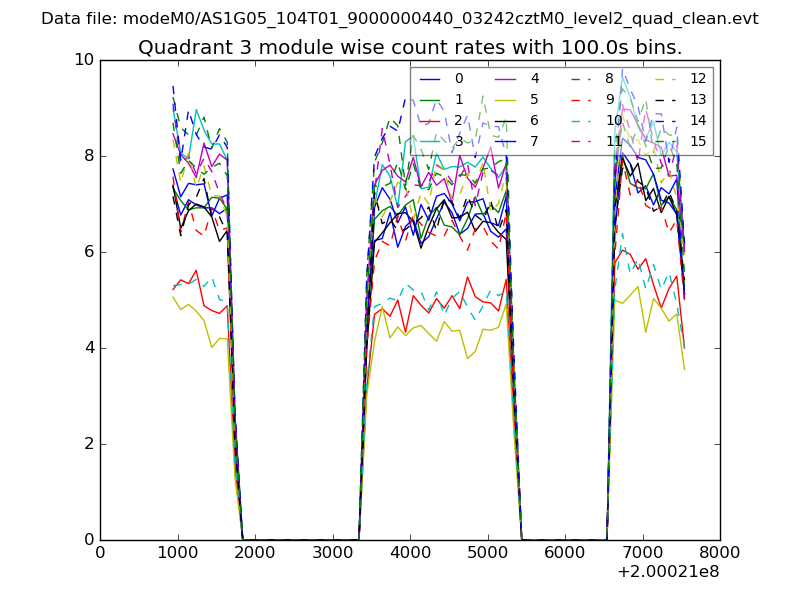
| Module-wise count rates for Quadrant A Data is divided into 100 sec bins |
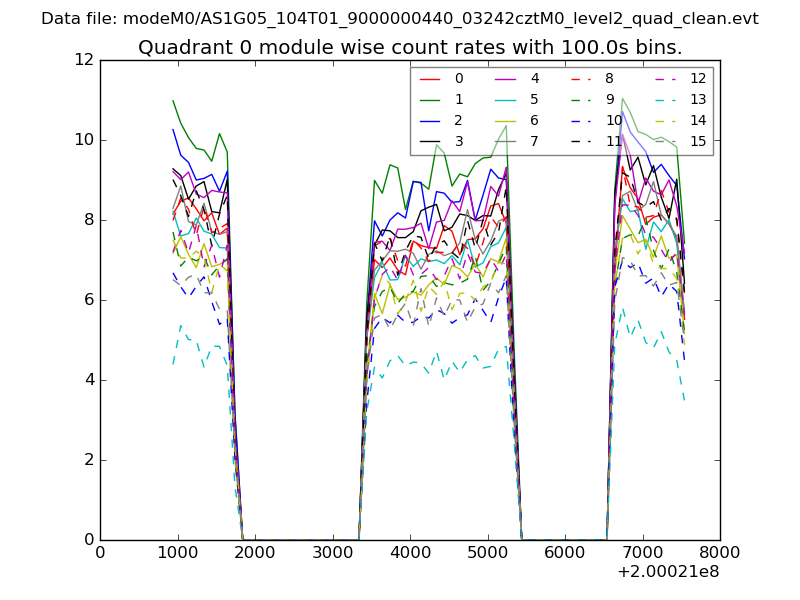 |
 |
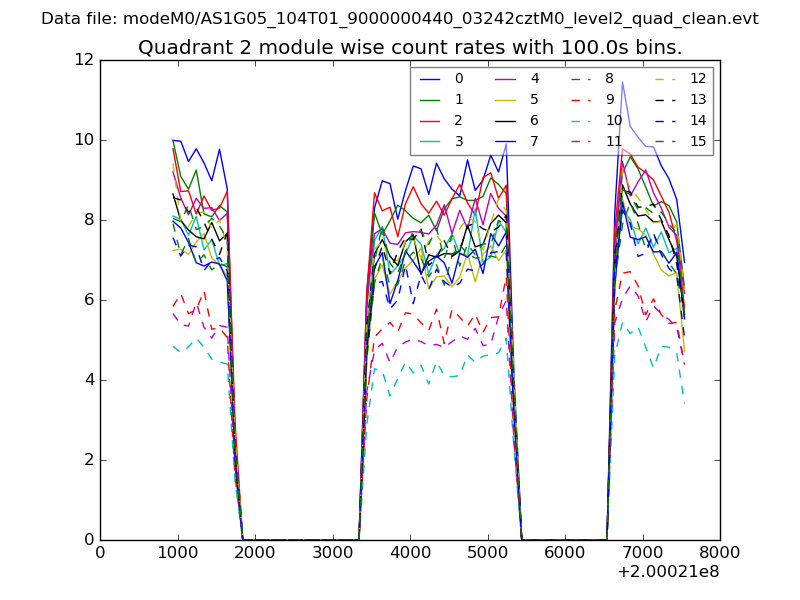
| Module-wise count rates for Quadrant B Data is divided into 100 sec bins |
 |
 |
| Module-wise count rates for Quadrant C Data is divided into 100 sec bins |
 |
 |
| Module-wise count rates for Quadrant D Data is divided into 100 sec bins |
 |
 |
| Parameter | Plot |
|---|---|
| CZT HV Monitor | 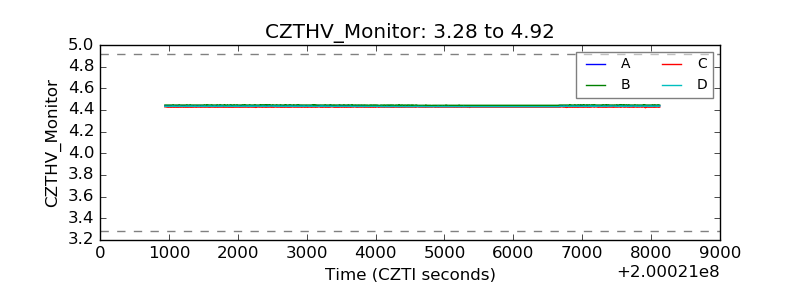 |
| D_VDD | 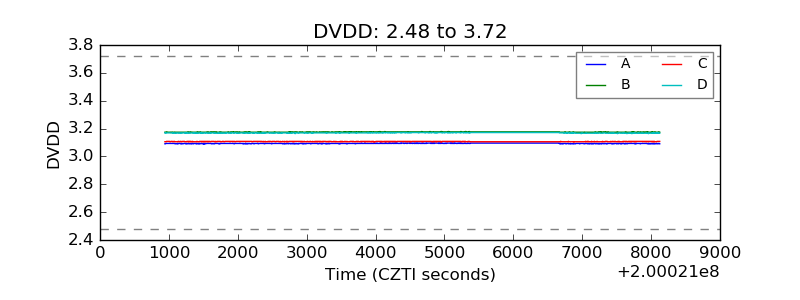 |
| Temperature 1 | 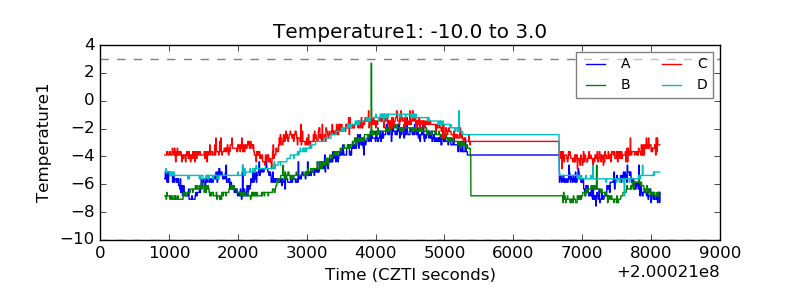 |
| Veto HV Monitor | 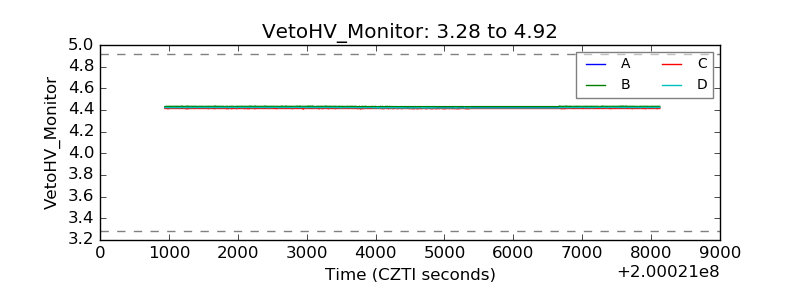 |
| Veto LLD | 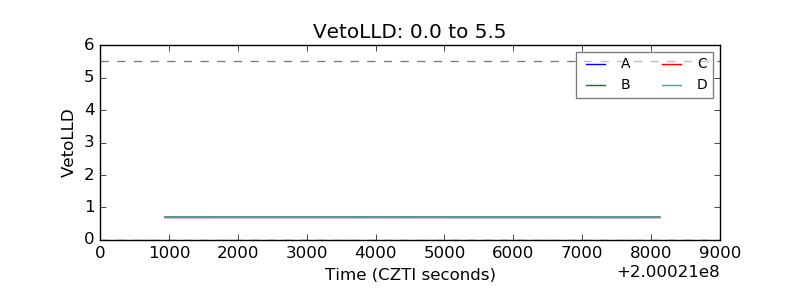 |
| Alpha Counter | 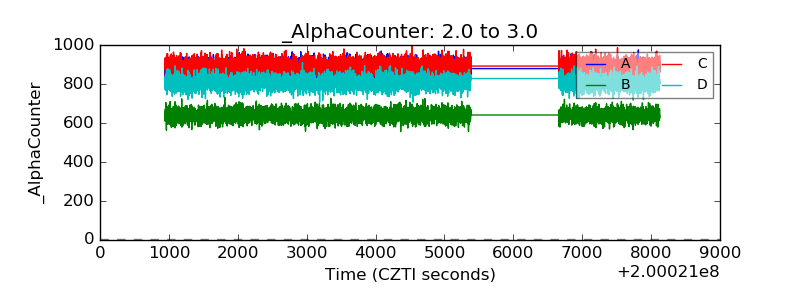 |
| _CPM_Rate | 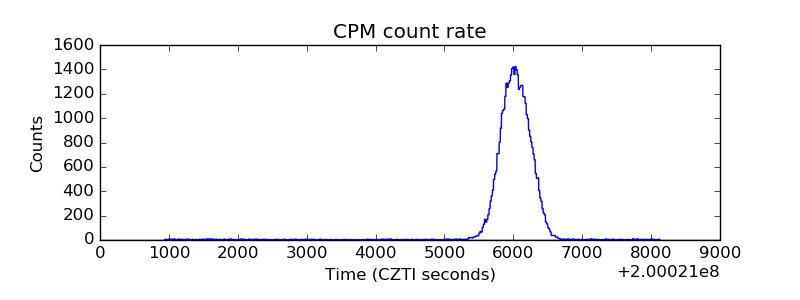 |
| CZT Counter | 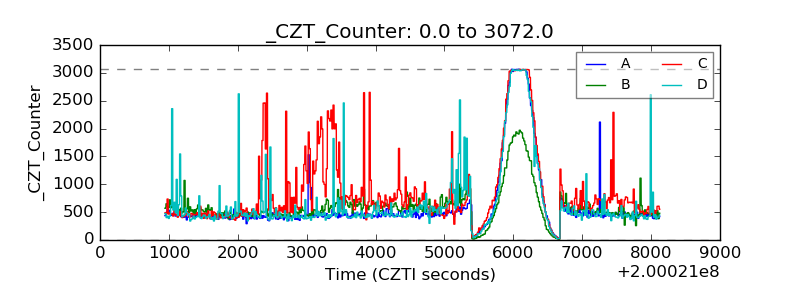 |
| +2.5 Volts monitor |  |
| +5 Volts monitor | 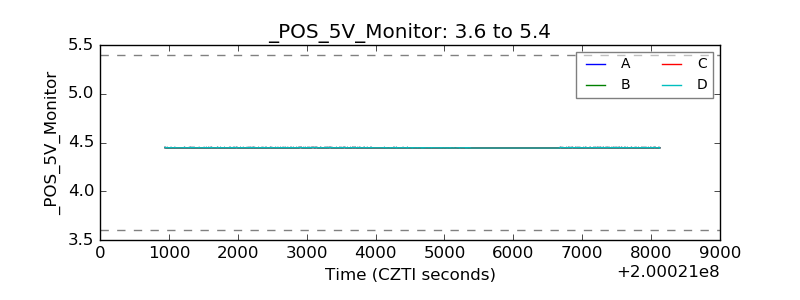 |
| _ROLL_ROT | 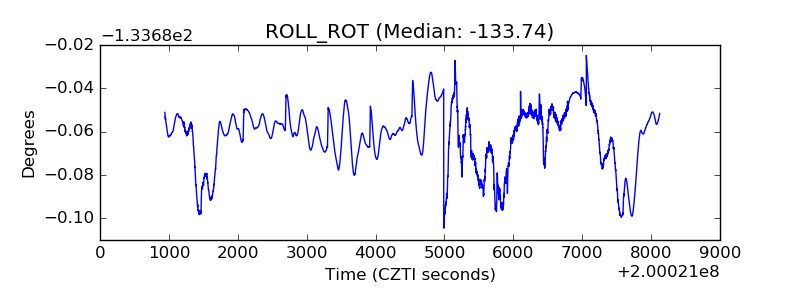 |
| _Roll_DEC | 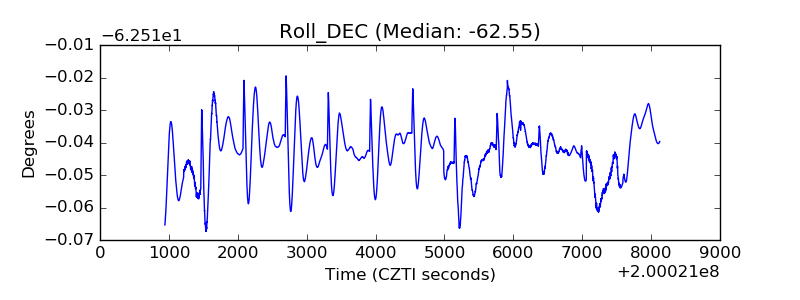 |
| _Roll_RA | 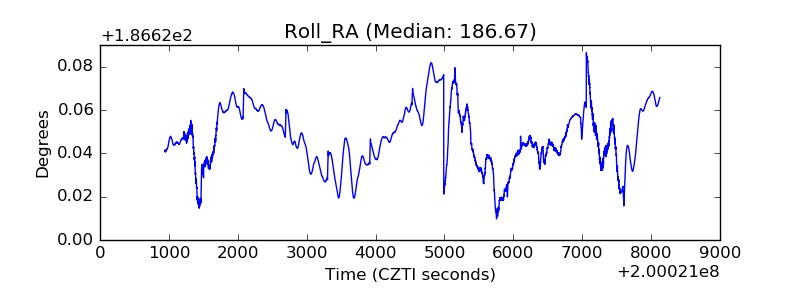 |
| Veto Counter | 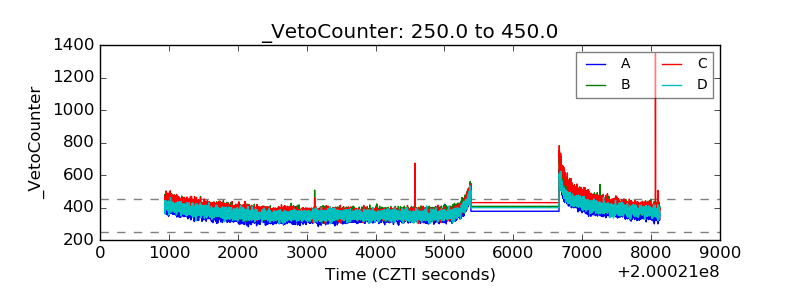 |