| Param | Original file | Final file |
|---|---|---|
| Filename | modeM0/AS1G05_104T01_9000000440_03243cztM0_level2.evt | modeM0/AS1G05_104T01_9000000440_03243cztM0_level2_quad_clean.evt |
| Size (bytes) | 461,119,680 | 73,209,600 |
| Size | 439.8 MB | 69.8 MB |
| Events in quadrant A | 2,948,190 | 444,769 |
| Events in quadrant B | 3,882,619 | 449,758 |
| Events in quadrant C | 3,509,945 | 444,917 |
| Events in quadrant D | 3,186,327 | 427,416 |
| Mode M0 | |||
|---|---|---|---|
| Quadrant | BADHDUFLAG | Total packets | Discarded packets |
| A | 0 | 13160 | 3 |
| B | 0 | 15642 | 2 |
| C | 0 | 14581 | 2 |
| D | 0 | 14018 | 2 |
| Mode SS | |||
|---|---|---|---|
| Quadrant | BADHDUFLAG | Total packets | Discarded packets |
| A | 0 | 132 | 0 |
| B | 0 | 132 | 0 |
| C | 0 | 132 | 0 |
| D | 0 | 132 | 0 |
| Mode M9 | |||
|---|---|---|---|
| Quadrant | BADHDUFLAG | Total packets | Discarded packets |
| A | 0 | 12 | 0 |
| B | 0 | 12 | 0 |
| C | 0 | 12 | 0 |
| D | 0 | 12 | 0 |
| Quadrant | Total seconds | Saturated seconds | Saturation percentage |
|---|---|---|---|
| A | 6444 | 28 | 0.434513% |
| B | 6444 | 72 | 1.117318% |
| C | 6444 | 48 | 0.744879% |
| D | 6444 | 40 | 0.620732% |
Noise dominated data is calculated using 1-second bins in cleaned event files. If a bin has >2000 counts, and if more than 50% of those come from <1% of pixels, then it is considered to be noise-dominated and hence unusable.
| Quadrant | # 1 sec bins | Bins with >0 counts | Bins with >2000 counts | High rate bins dominated by noise | Noise dominated (total time) | Noise dominated (detector-on time) | Marked lightcurve |
|---|---|---|---|---|---|---|---|
| A | 7699 | 6445 | 2 | 2 | 0.03% | 0.03% | 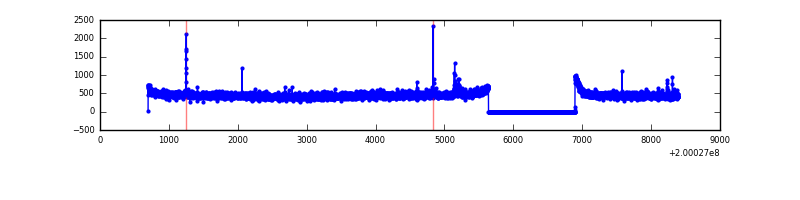 |
| B | 7699 | 6445 | 25 | 25 | 0.32% | 0.39% | 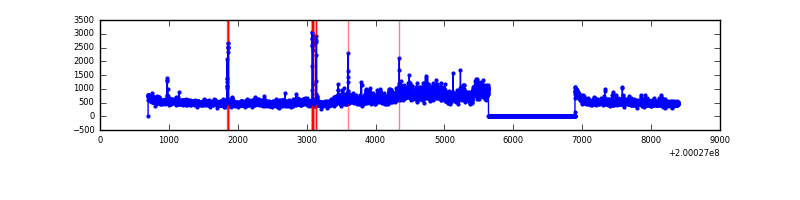 |
| C | 7699 | 6445 | 15 | 15 | 0.19% | 0.23% | 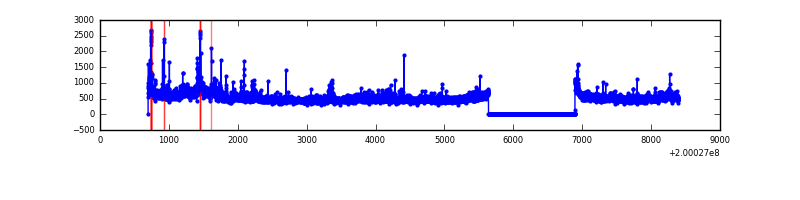 |
| D | 7699 | 6445 | 23 | 23 | 0.30% | 0.36% | 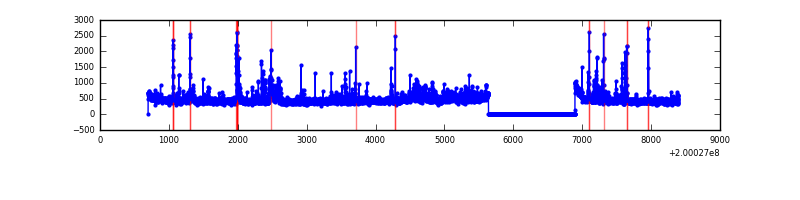 |
Top three noisy pixels from each quadrant. If the there are fewer than three noisy pixels in the level2.evt file, extra rows are filled as -1
| Pixel properties | Quadrant properties | ||||||
|---|---|---|---|---|---|---|---|
| Quadrant | DetID | PixID | Counts | Sigma | Mean | Median | Sigma |
| A | 0 | 118 | 18173 | 113.3 | 754 | 738 | 153.9 |
| A | 0 | 149 | 12657 | 77.45 | 754 | 738 | 153.9 |
| A | 0 | 226 | 10544 | 63.72 | 754 | 738 | 153.9 |
| B | 15 | 204 | 775252 | 5379.05 | 770 | 752 | 144.0 |
| B | 2 | 249 | 82753 | 569.51 | 770 | 752 | 144.0 |
| B | 0 | 229 | 23410 | 157.36 | 770 | 752 | 144.0 |
| C | 14 | 48 | 402847 | 2342.92 | 745 | 748 | 171.6 |
| C | 14 | 223 | 75589 | 436.08 | 745 | 748 | 171.6 |
| C | 6 | 80 | 51960 | 298.4 | 745 | 748 | 171.6 |
| D | 13 | 223 | 227360 | 1298.14 | 731 | 710 | 174.6 |
| D | 13 | 114 | 102965 | 585.67 | 731 | 710 | 174.6 |
| D | 2 | 248 | 24741 | 137.64 | 731 | 710 | 174.6 |
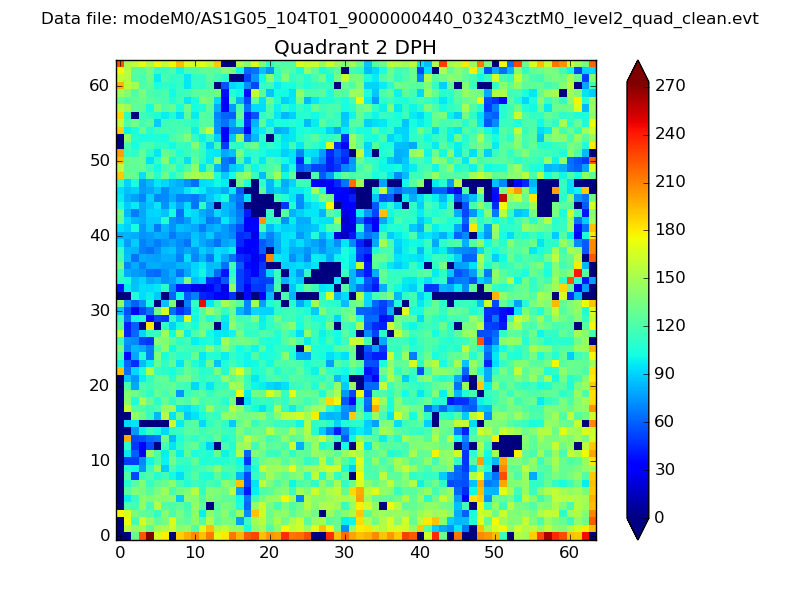
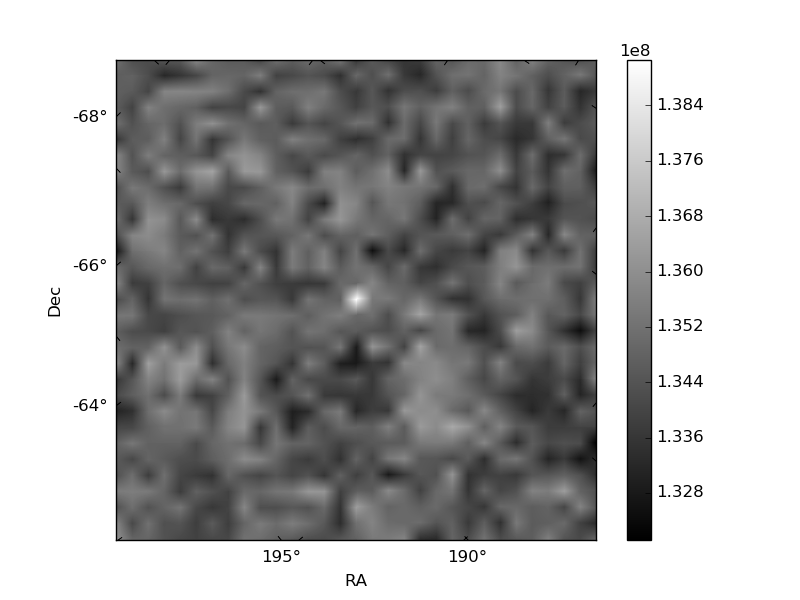
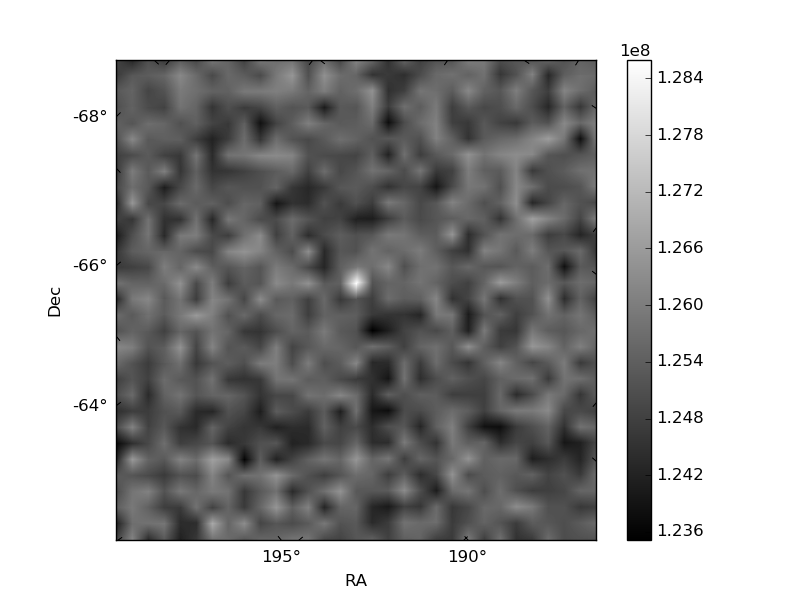
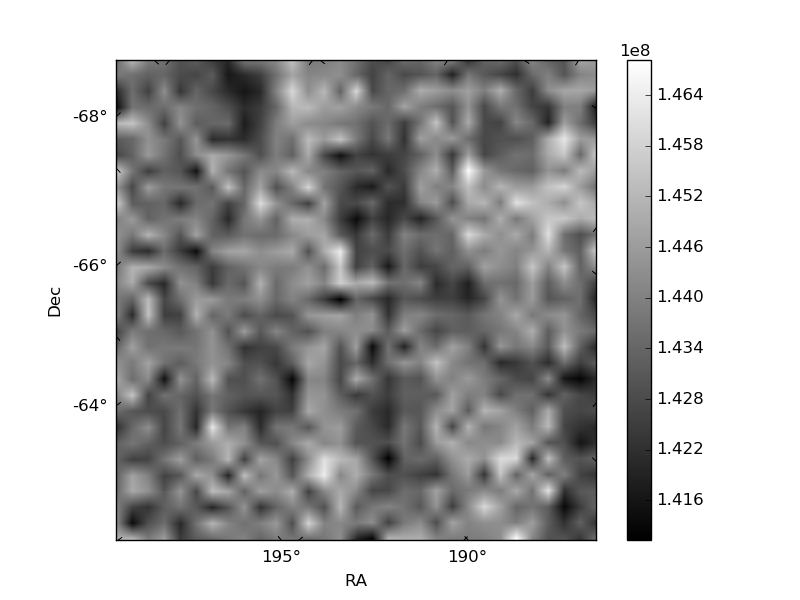
Histogram calculated using DETX and DETY for each event in the final _common_clean file
| Quadrant A | 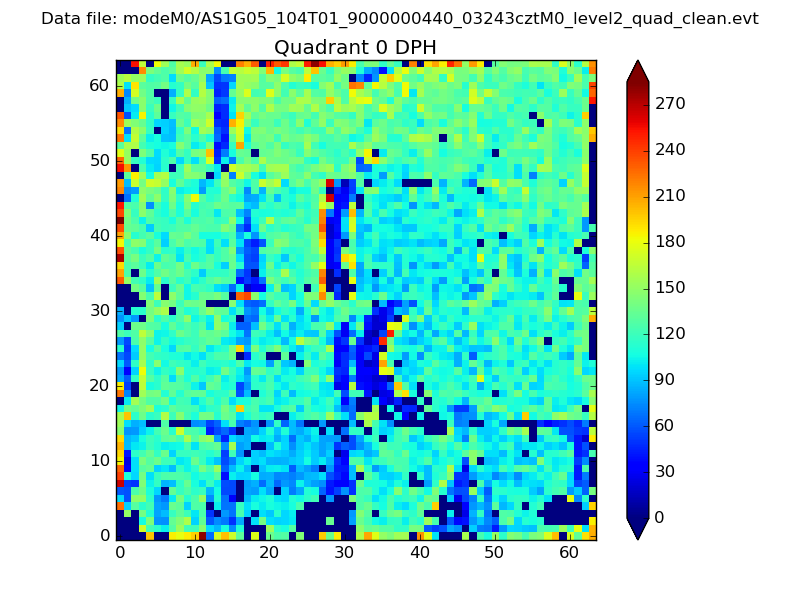 |
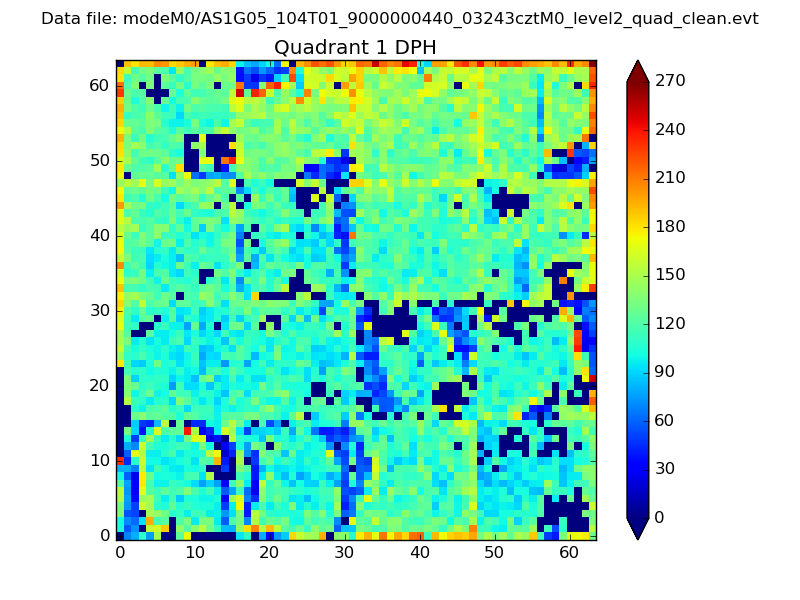 |
Quadrant B |
|---|---|---|---|
| Quadrant D | 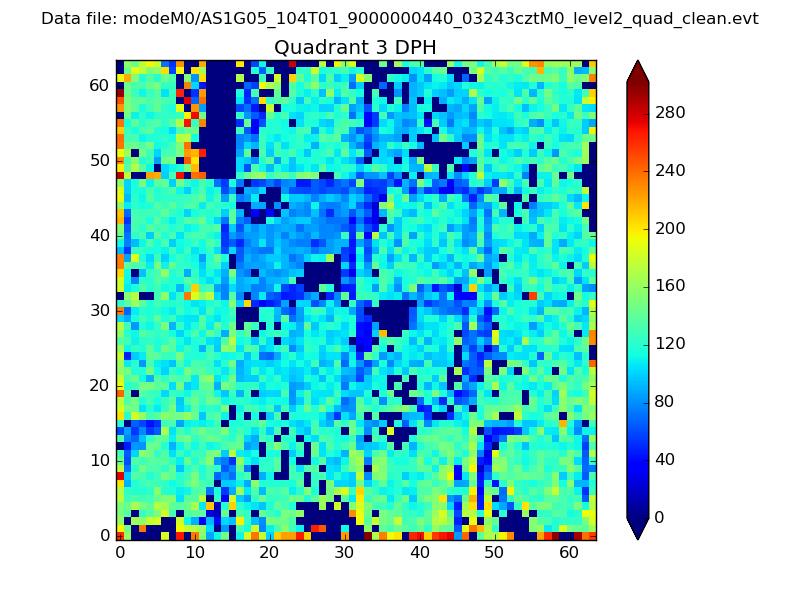 |
 |
Quadrant C |
| Plot type | Count rate plots | Images |
|---|---|---|
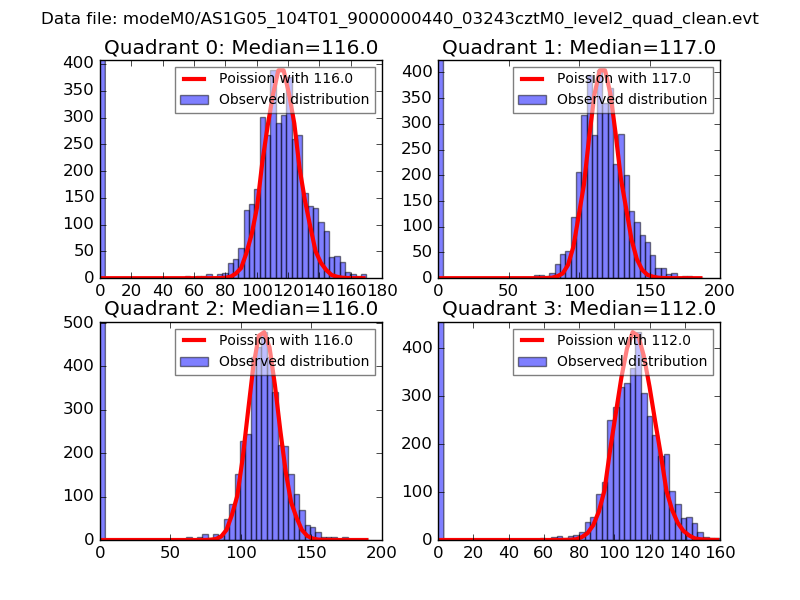
| Comparison with Poisson distribution Blue bars denote a histogram of data divided into 1 sec bins. Red curve is a Poisson curve with rate = median count rate of data. |
 |
 |
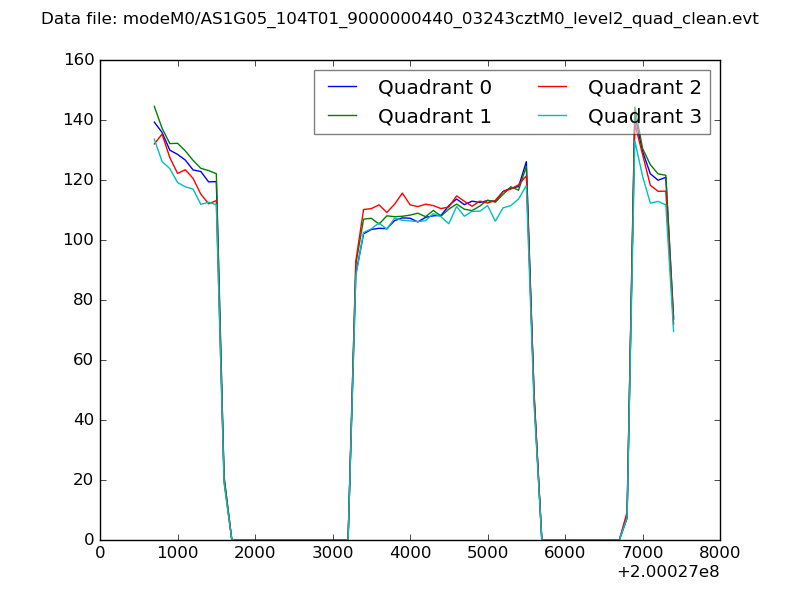
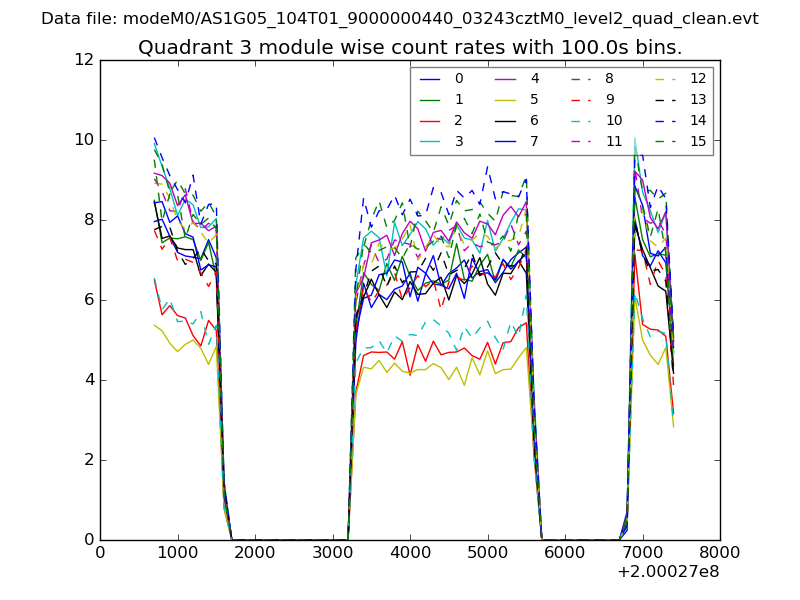
| Quadrant-wise count rates Data is divided into 100 sec bins |
 |
|
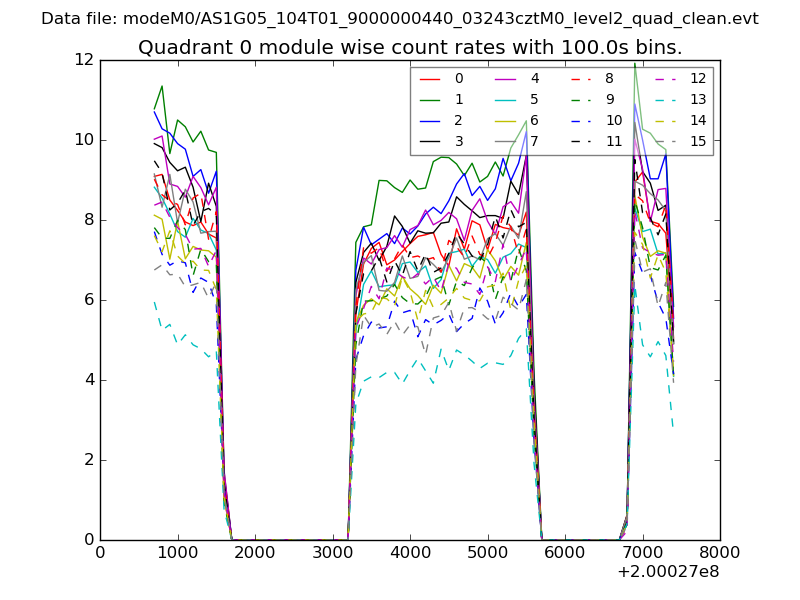
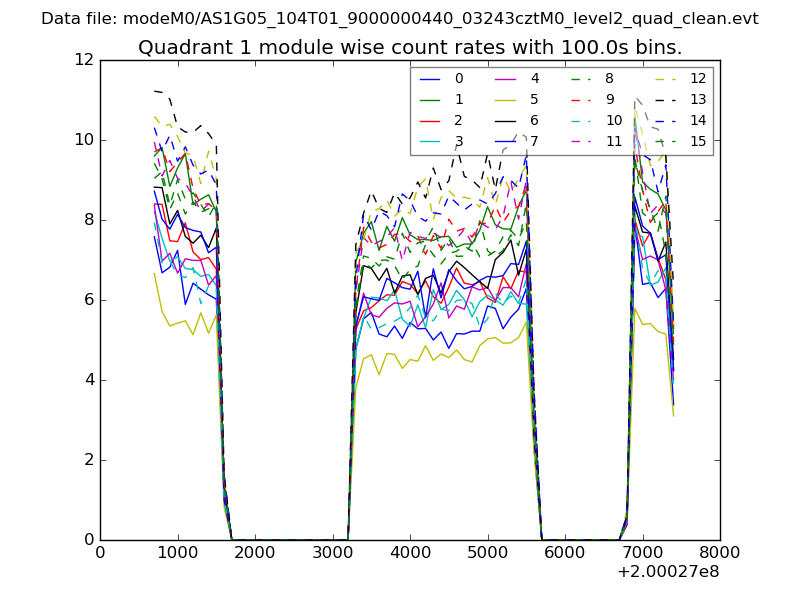
| Module-wise count rates for Quadrant A Data is divided into 100 sec bins |
 |
 |
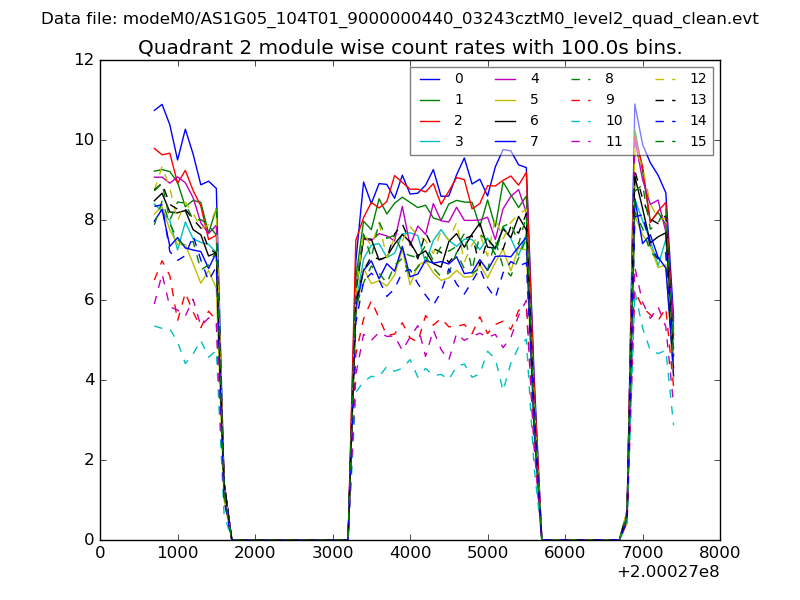
| Module-wise count rates for Quadrant B Data is divided into 100 sec bins |
 |
 |
| Module-wise count rates for Quadrant C Data is divided into 100 sec bins |
 |
 |
| Module-wise count rates for Quadrant D Data is divided into 100 sec bins |
 |
 |
| Parameter | Plot |
|---|---|
| CZT HV Monitor | 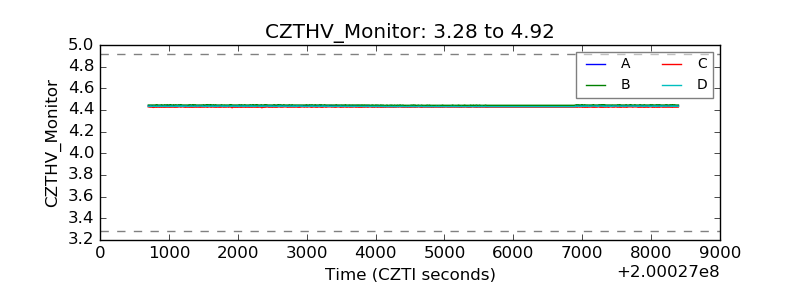 |
| D_VDD | 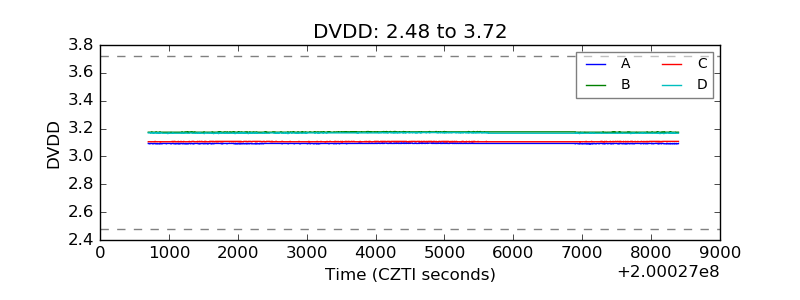 |
| Temperature 1 | 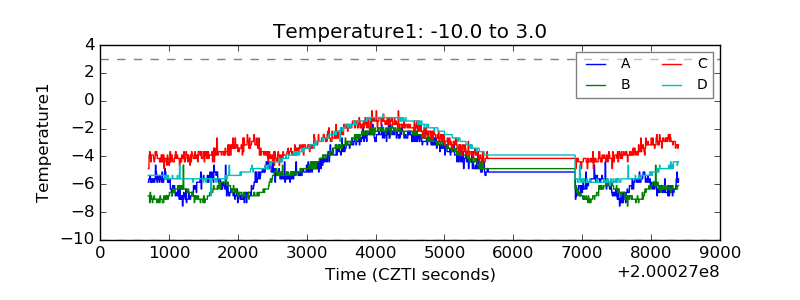 |
| Veto HV Monitor | 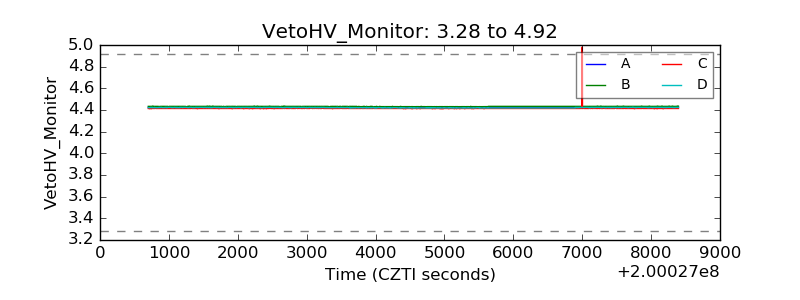 |
| Veto LLD | 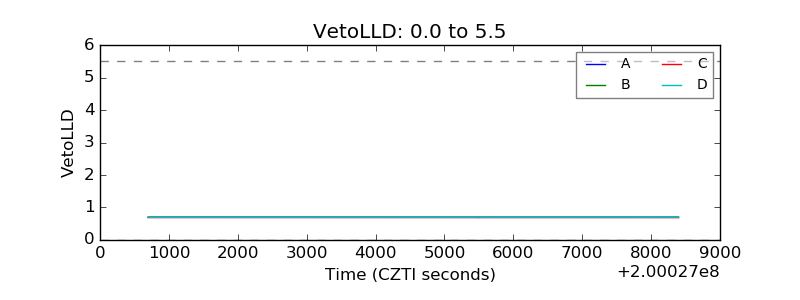 |
| Alpha Counter | 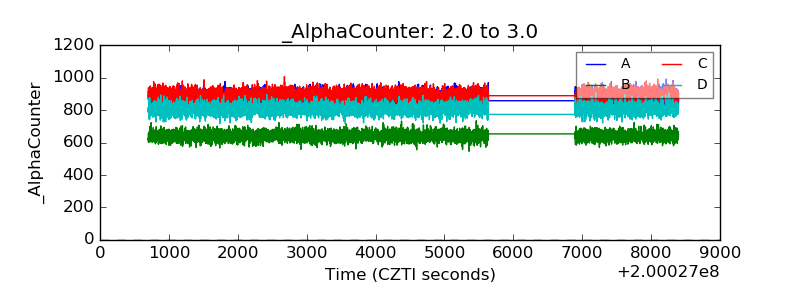 |
| _CPM_Rate | 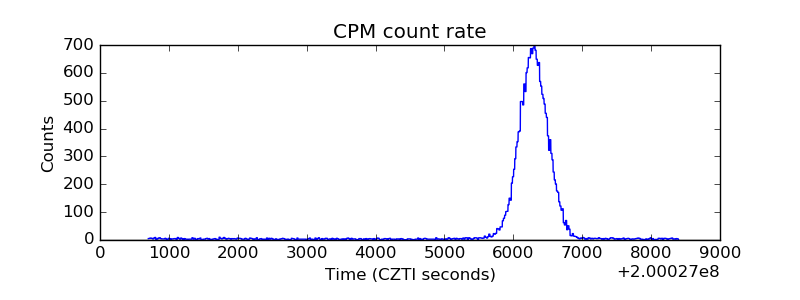 |
| CZT Counter | 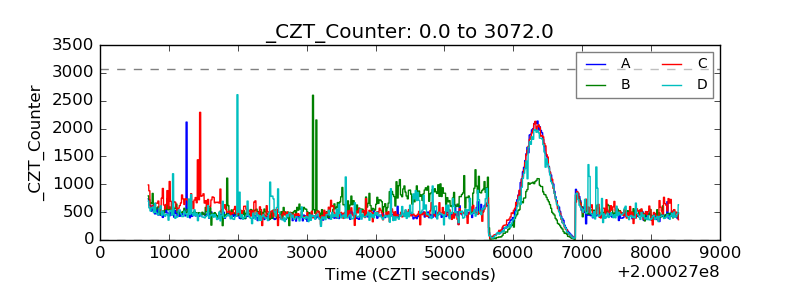 |
| +2.5 Volts monitor |  |
| +5 Volts monitor |  |
| _ROLL_ROT |  |
| _Roll_DEC | 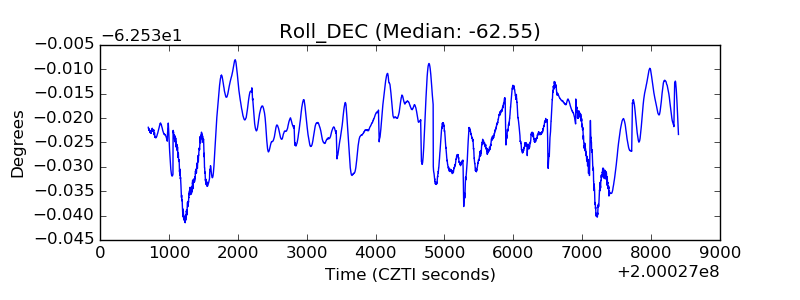 |
| _Roll_RA | 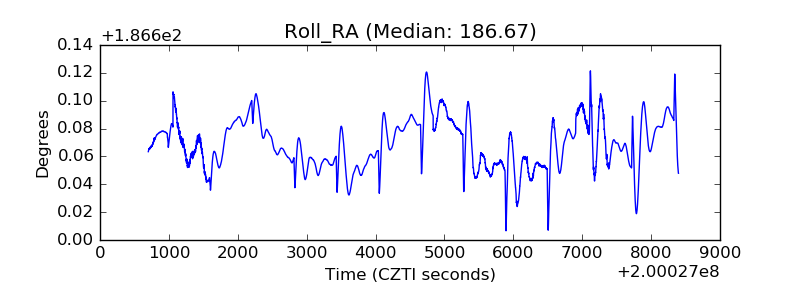 |
| Veto Counter | 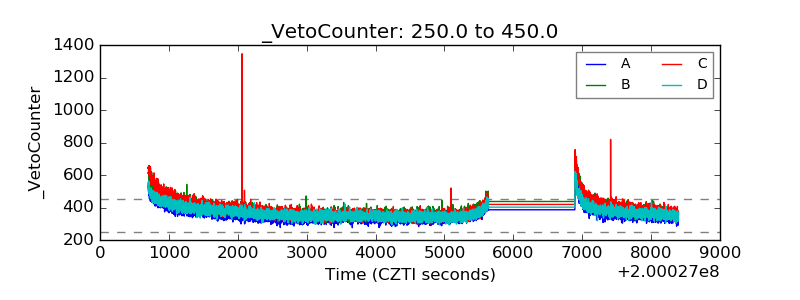 |