| Param | Original file | Final file |
|---|---|---|
| Filename | modeM0/AS1G05_104T01_9000000440_03244cztM0_level2.evt | modeM0/AS1G05_104T01_9000000440_03244cztM0_level2_quad_clean.evt |
| Size (bytes) | 457,064,640 | 65,652,480 |
| Size | 435.9 MB | 62.6 MB |
| Events in quadrant A | 2,865,658 | 389,678 |
| Events in quadrant B | 3,592,651 | 391,103 |
| Events in quadrant C | 3,501,427 | 390,243 |
| Events in quadrant D | 3,450,986 | 373,385 |
| Mode M0 | |||
|---|---|---|---|
| Quadrant | BADHDUFLAG | Total packets | Discarded packets |
| A | 0 | 12984 | 2 |
| B | 0 | 14657 | 1 |
| C | 0 | 14501 | 1 |
| D | 0 | 14754 | 1 |
| Mode SS | |||
|---|---|---|---|
| Quadrant | BADHDUFLAG | Total packets | Discarded packets |
| A | 0 | 130 | 0 |
| B | 0 | 130 | 0 |
| C | 0 | 130 | 0 |
| D | 0 | 130 | 0 |
| Mode M9 | |||
|---|---|---|---|
| Quadrant | BADHDUFLAG | Total packets | Discarded packets |
| A | 0 | 10 | 0 |
| B | 0 | 10 | 0 |
| C | 0 | 10 | 0 |
| D | 0 | 10 | 0 |
| Quadrant | Total seconds | Saturated seconds | Saturation percentage |
|---|---|---|---|
| A | 6349 | 54 | 0.850528% |
| B | 6349 | 73 | 1.149787% |
| C | 6349 | 113 | 1.779808% |
| D | 6349 | 150 | 2.362577% |
Noise dominated data is calculated using 1-second bins in cleaned event files. If a bin has >2000 counts, and if more than 50% of those come from <1% of pixels, then it is considered to be noise-dominated and hence unusable.
| Quadrant | # 1 sec bins | Bins with >0 counts | Bins with >2000 counts | High rate bins dominated by noise | Noise dominated (total time) | Noise dominated (detector-on time) | Marked lightcurve |
|---|---|---|---|---|---|---|---|
| A | 7409 | 6350 | 4 | 4 | 0.05% | 0.06% | 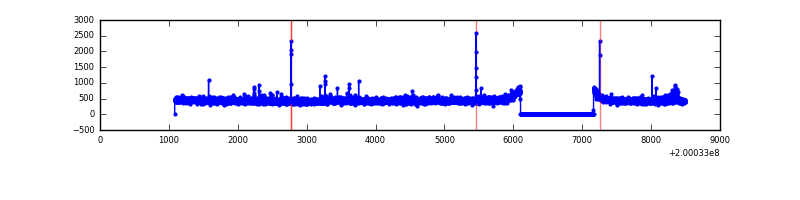 |
| B | 7409 | 6350 | 2 | 2 | 0.03% | 0.03% |  |
| C | 7409 | 6350 | 49 | 49 | 0.66% | 0.77% | 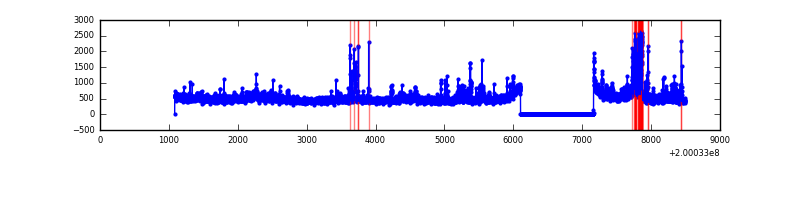 |
| D | 7409 | 6350 | 113 | 113 | 1.53% | 1.78% | 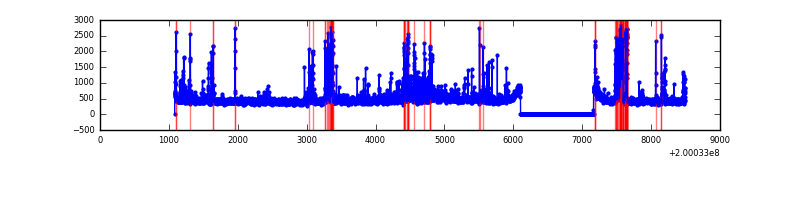 |
Top three noisy pixels from each quadrant. If the there are fewer than three noisy pixels in the level2.evt file, extra rows are filled as -1
| Pixel properties | Quadrant properties | ||||||
|---|---|---|---|---|---|---|---|
| Quadrant | DetID | PixID | Counts | Sigma | Mean | Median | Sigma |
| A | 0 | 118 | 37604 | 248.44 | 727 | 712 | 148.5 |
| A | 0 | 31 | 14335 | 91.74 | 727 | 712 | 148.5 |
| A | 0 | 226 | 11271 | 71.11 | 727 | 712 | 148.5 |
| B | 15 | 204 | 629234 | 4460.94 | 743 | 725 | 140.9 |
| B | 2 | 249 | 28125 | 194.48 | 743 | 725 | 140.9 |
| B | 0 | 229 | 15717 | 106.41 | 743 | 725 | 140.9 |
| C | 14 | 48 | 338461 | 2054.59 | 714 | 717 | 164.4 |
| C | 14 | 223 | 296679 | 1800.42 | 714 | 717 | 164.4 |
| C | 6 | 80 | 53240 | 319.51 | 714 | 717 | 164.4 |
| D | 13 | 223 | 408939 | 2422.54 | 702 | 684 | 168.5 |
| D | 13 | 114 | 267632 | 1584.04 | 702 | 684 | 168.5 |
| D | 5 | 233 | 45865 | 268.1 | 702 | 684 | 168.5 |
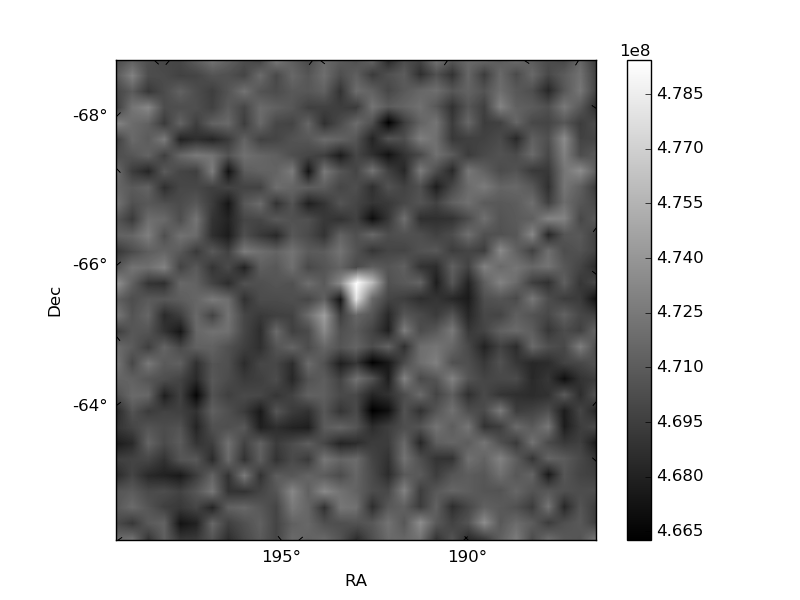
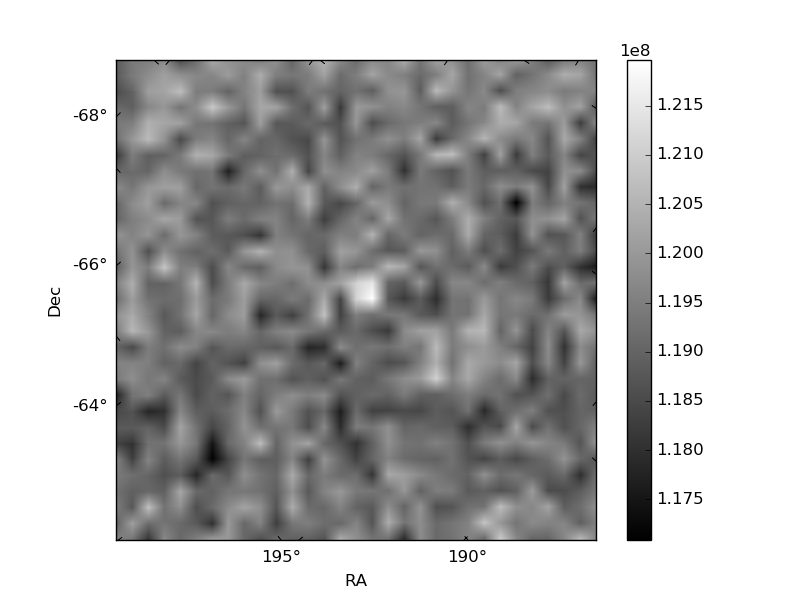
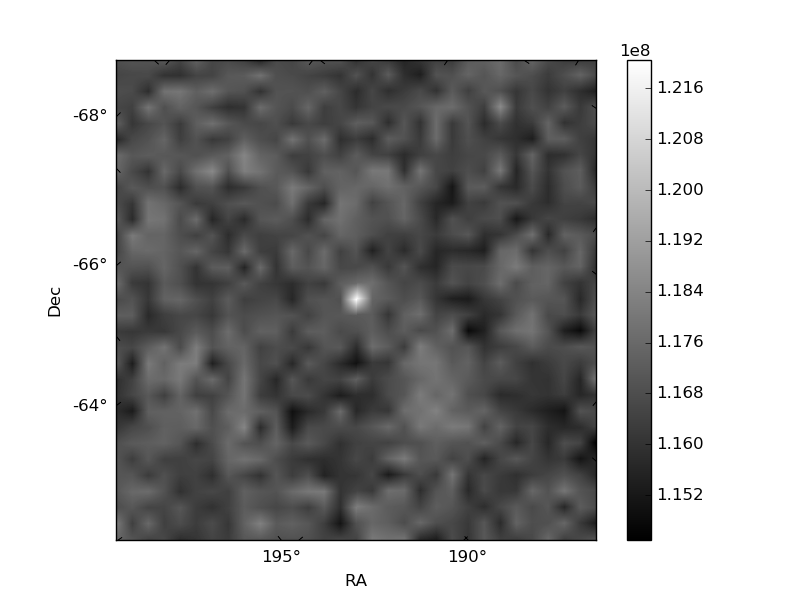
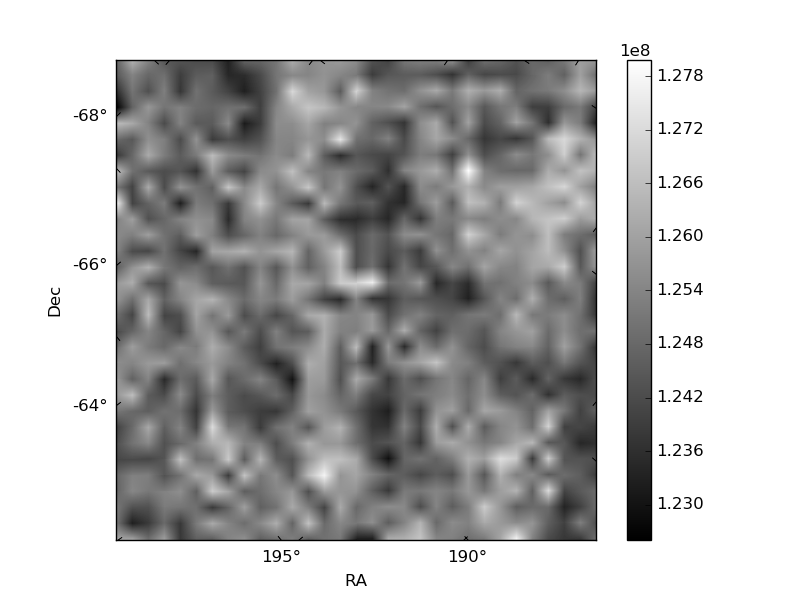
Histogram calculated using DETX and DETY for each event in the final _common_clean file
| Quadrant A | 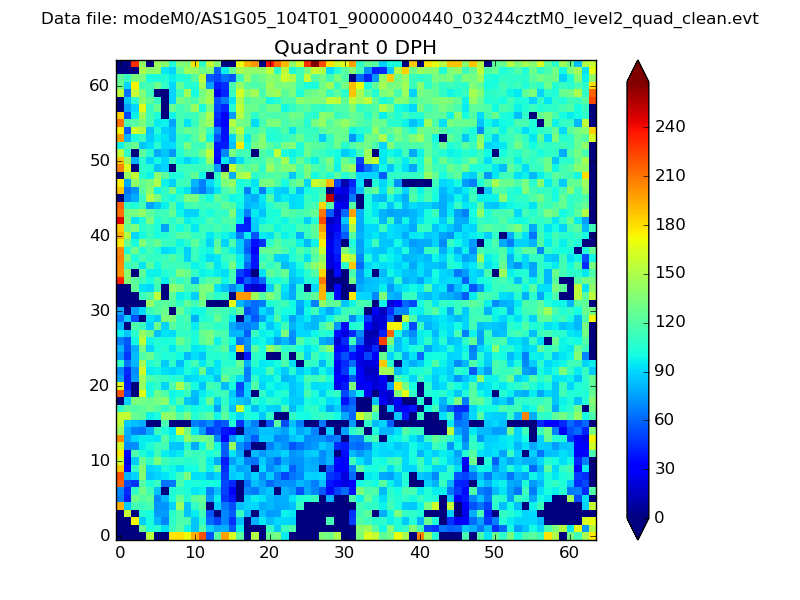 |
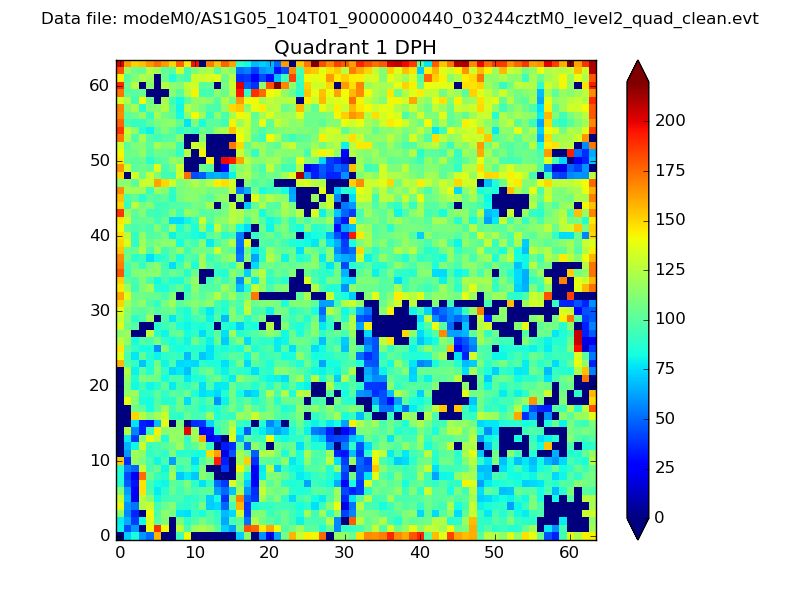 |
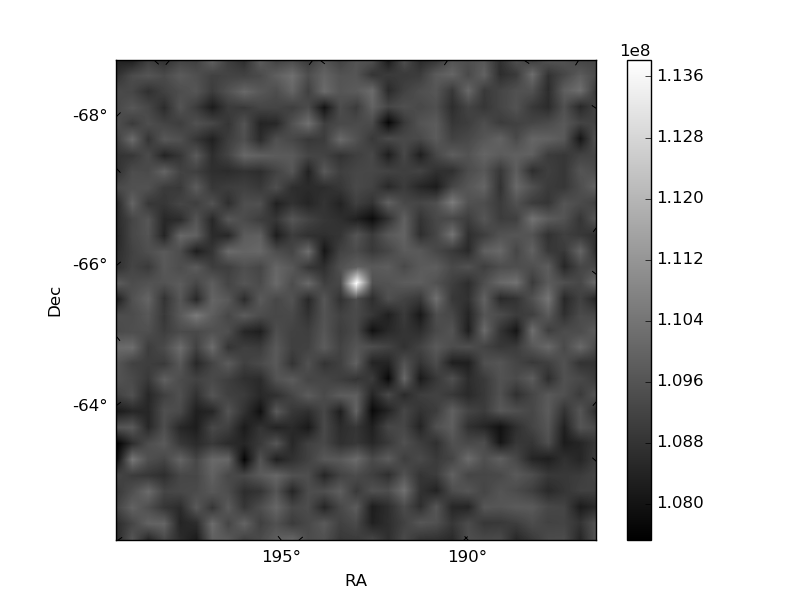
Quadrant B |
|---|---|---|---|
| Quadrant D | 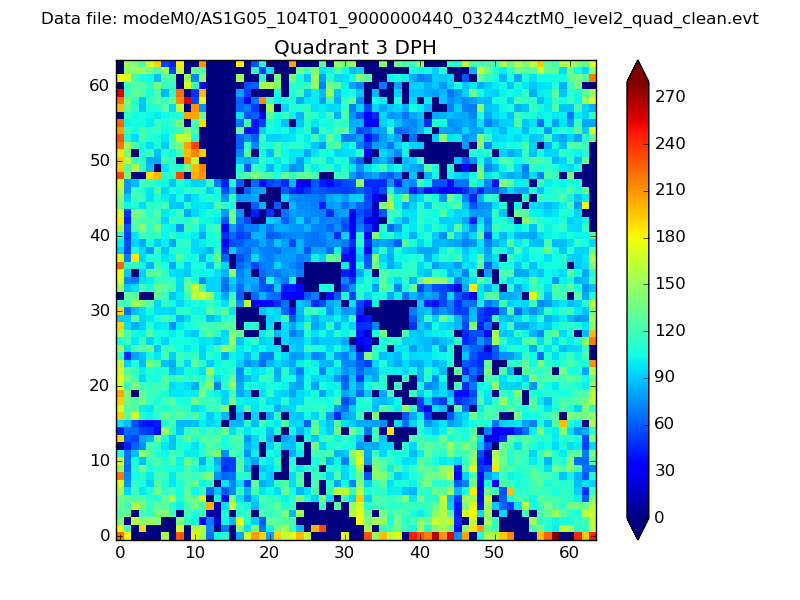 |
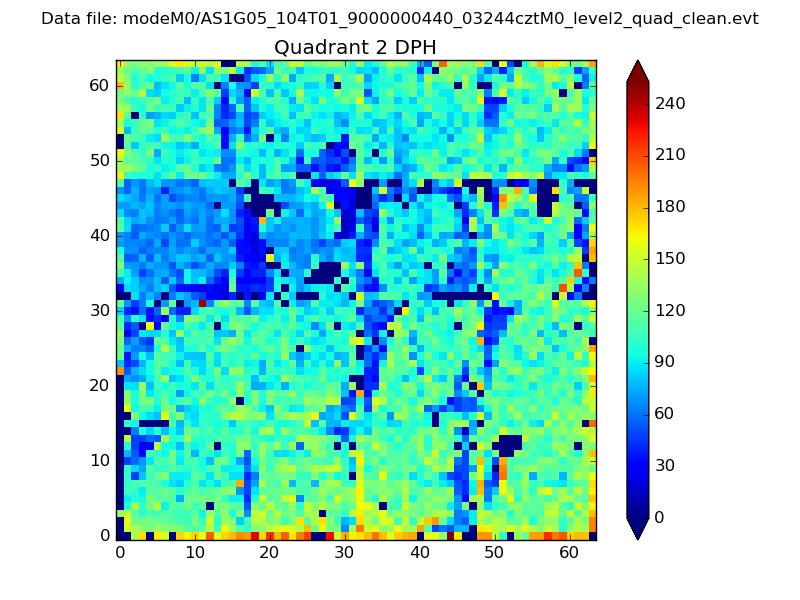 |
Quadrant C |
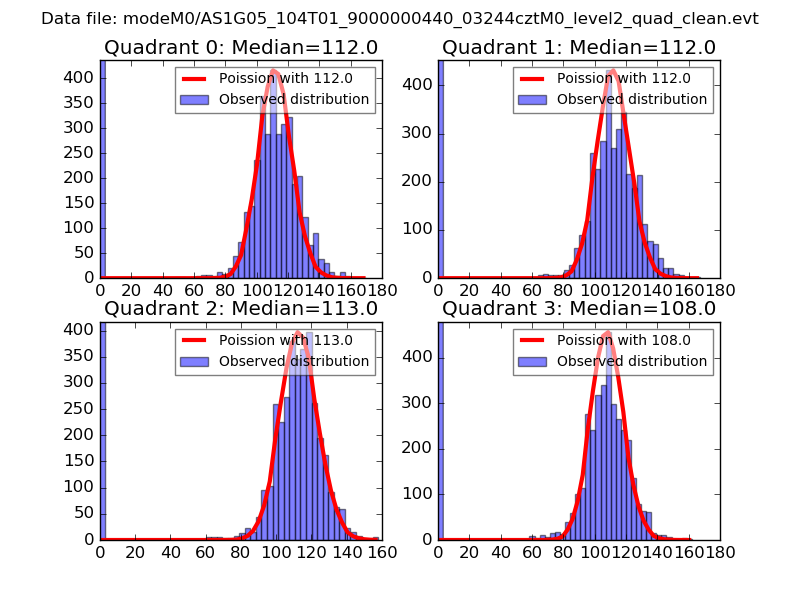
| Plot type | Count rate plots | Images |
|---|---|---|
| Comparison with Poisson distribution Blue bars denote a histogram of data divided into 1 sec bins. Red curve is a Poisson curve with rate = median count rate of data. |
 |
 |
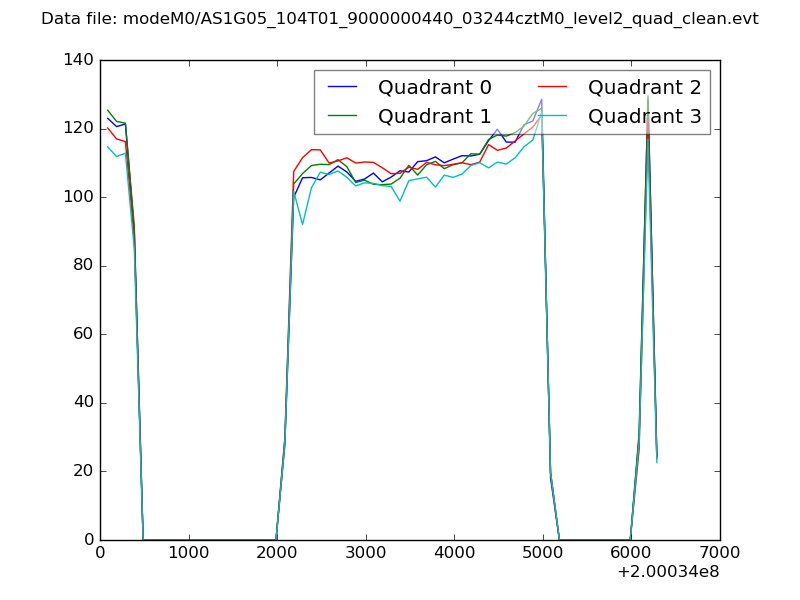
| Quadrant-wise count rates Data is divided into 100 sec bins |
 |
|
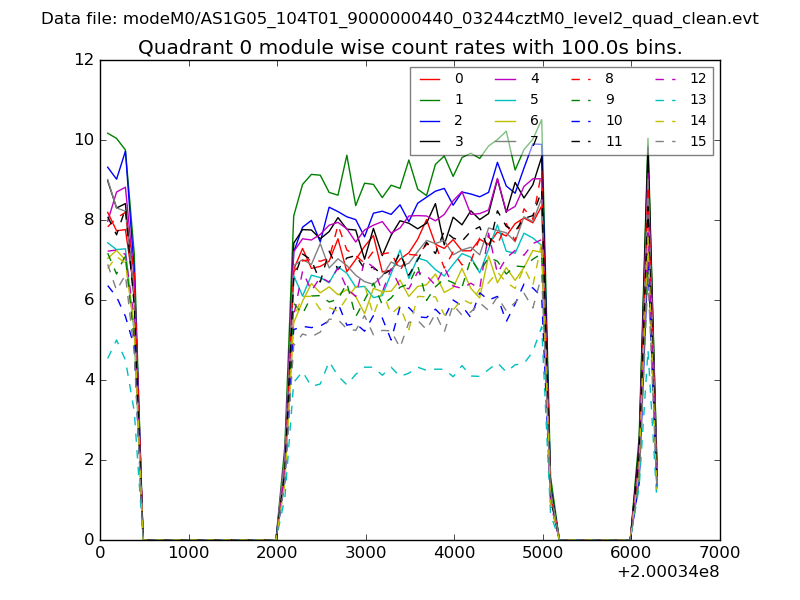
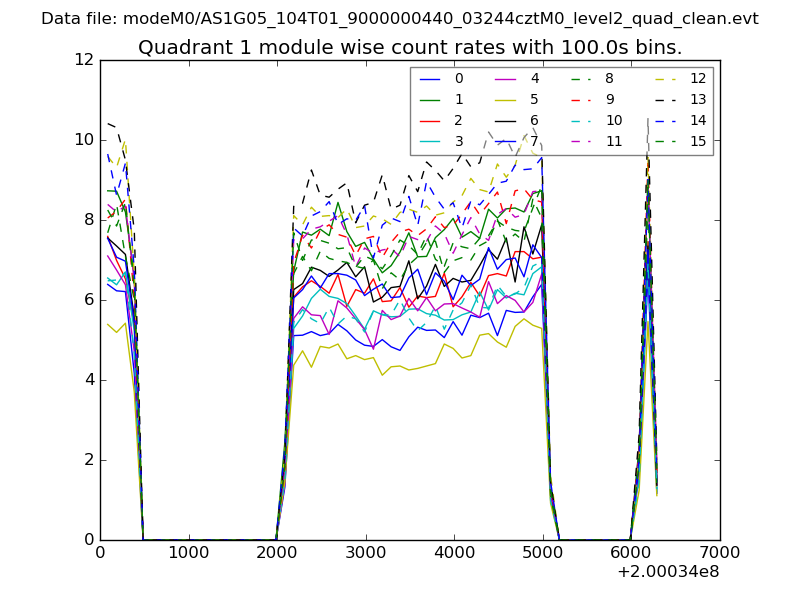
| Module-wise count rates for Quadrant A Data is divided into 100 sec bins |
 |
 |
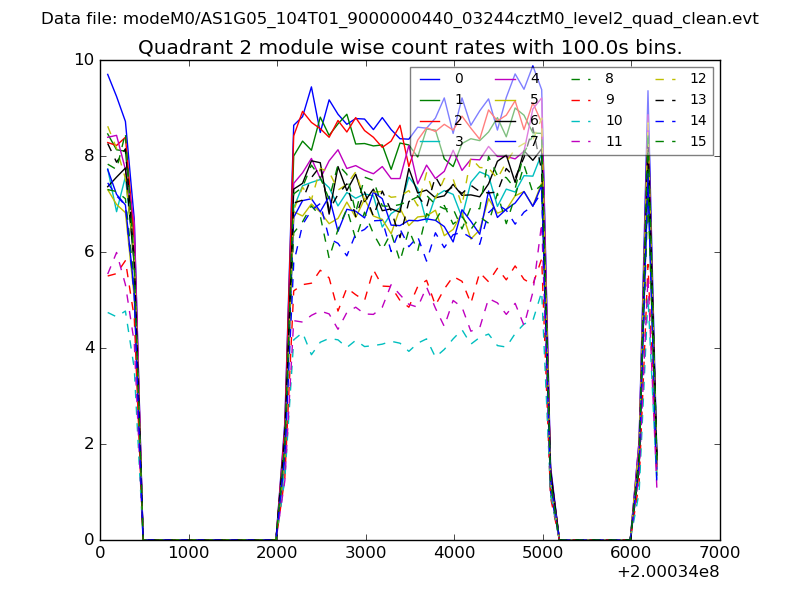
| Module-wise count rates for Quadrant B Data is divided into 100 sec bins |
 |
 |
| Module-wise count rates for Quadrant C Data is divided into 100 sec bins |
 |
 |
| Module-wise count rates for Quadrant D Data is divided into 100 sec bins |
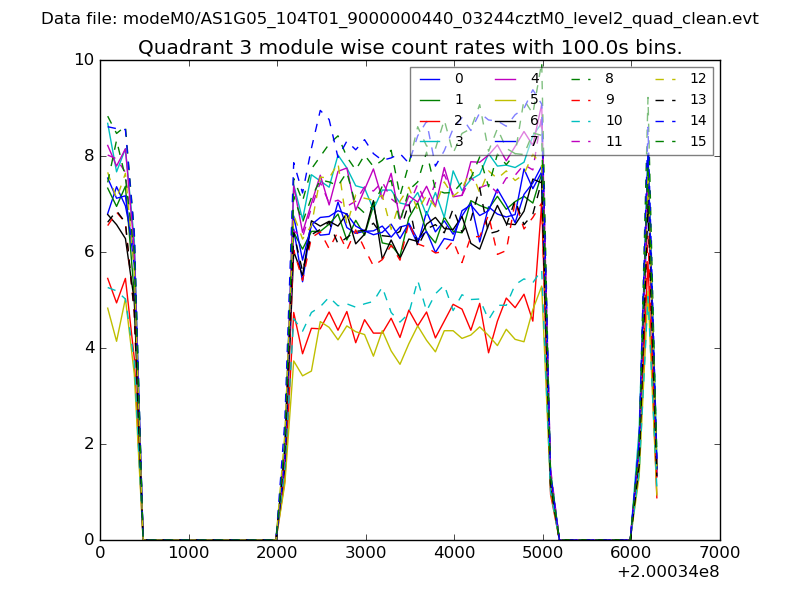 |
 |
| Parameter | Plot |
|---|---|
| CZT HV Monitor | 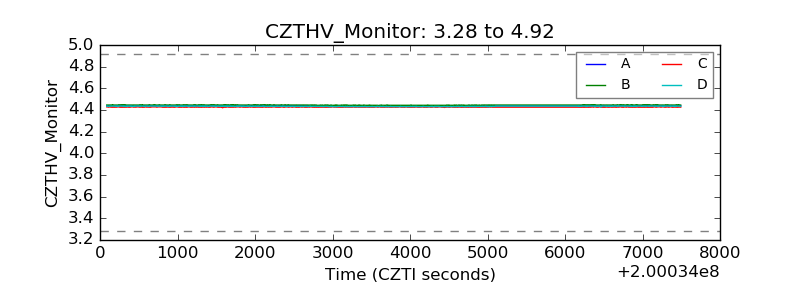 |
| D_VDD | 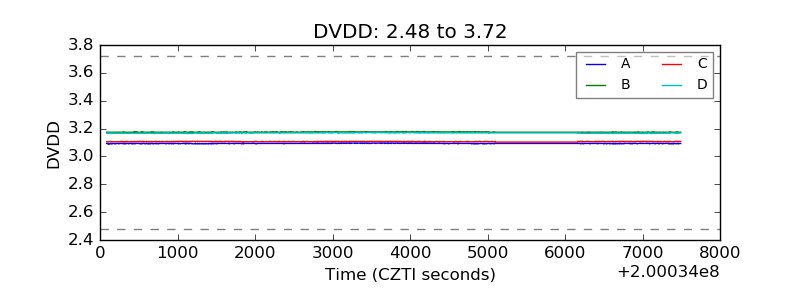 |
| Temperature 1 | 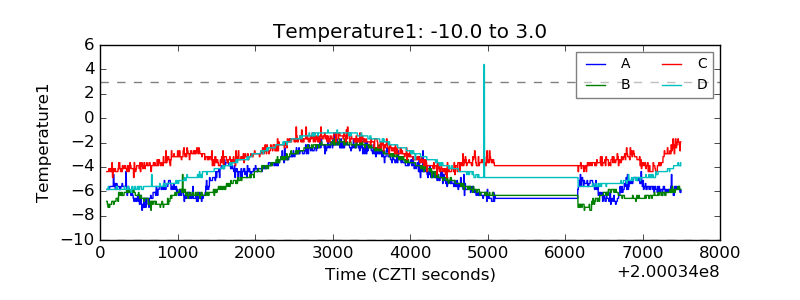 |
| Veto HV Monitor | 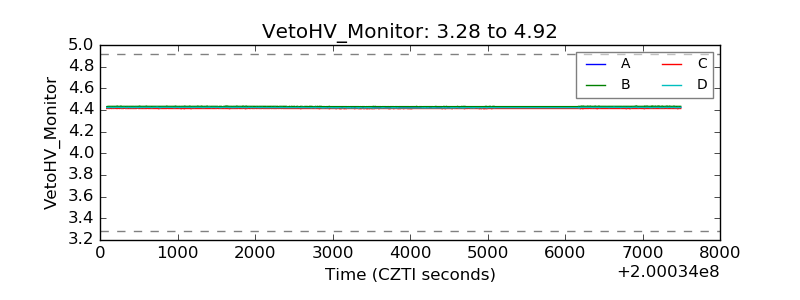 |
| Veto LLD | 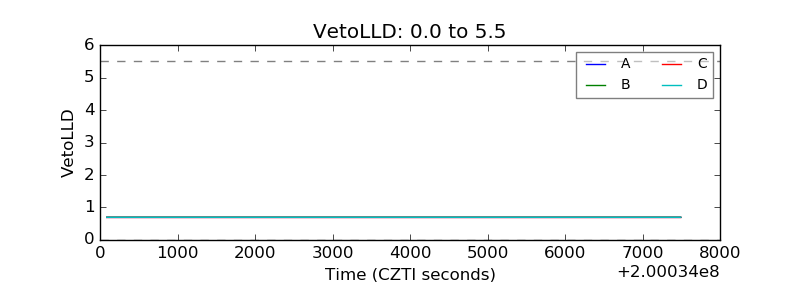 |
| Alpha Counter | 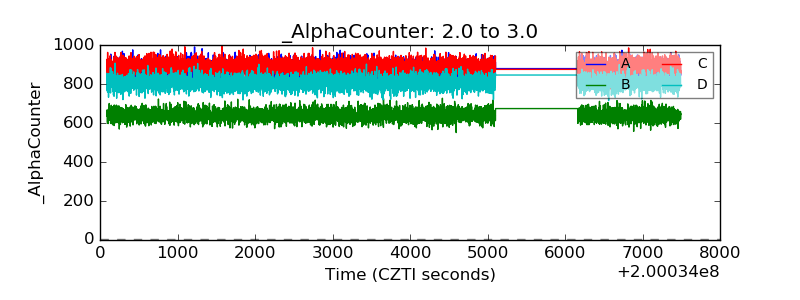 |
| _CPM_Rate | 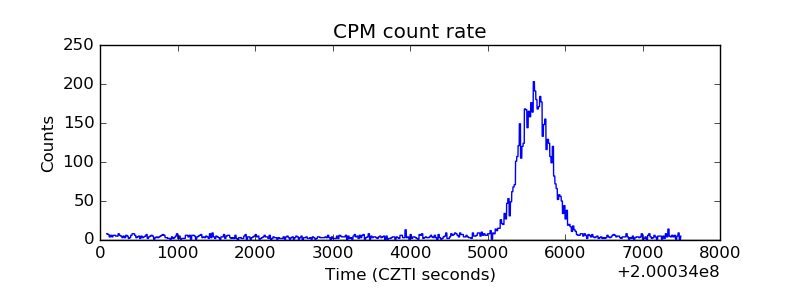 |
| CZT Counter | 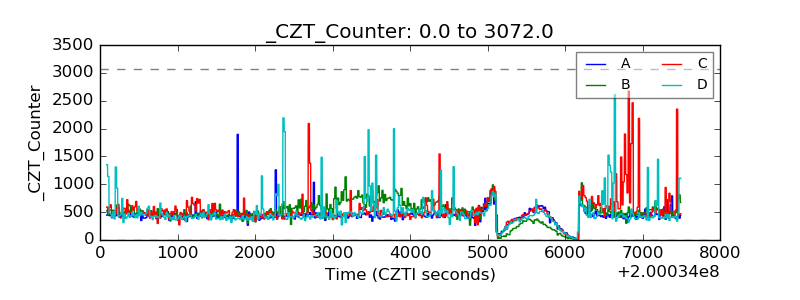 |
| +2.5 Volts monitor |  |
| +5 Volts monitor |  |
| _ROLL_ROT | 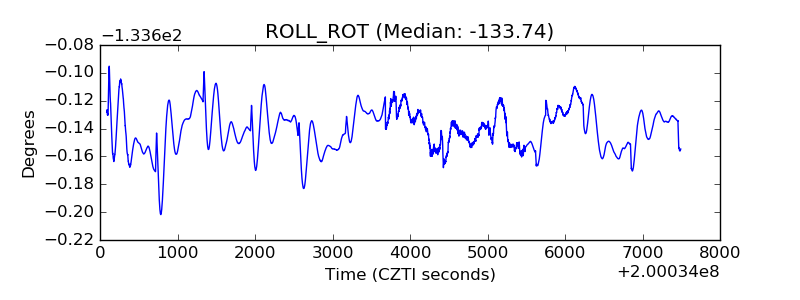 |
| _Roll_DEC | 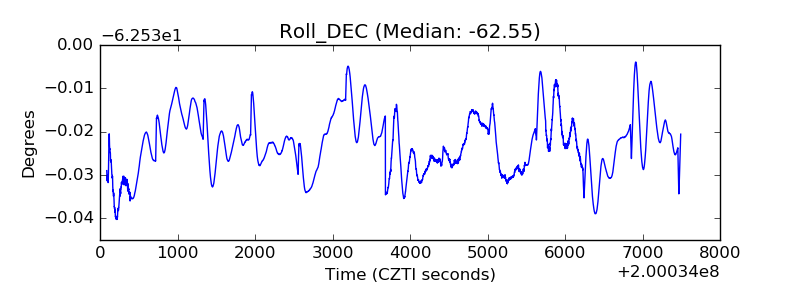 |
| _Roll_RA | 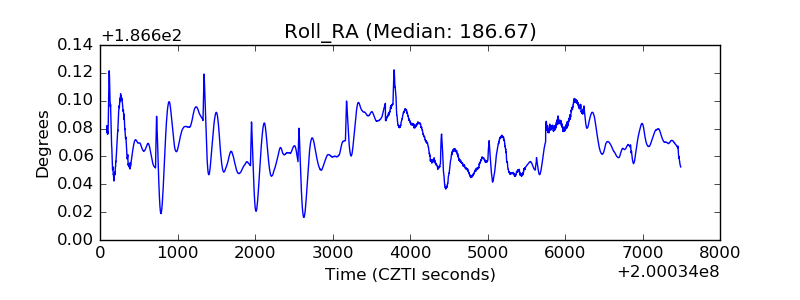 |
| Veto Counter | 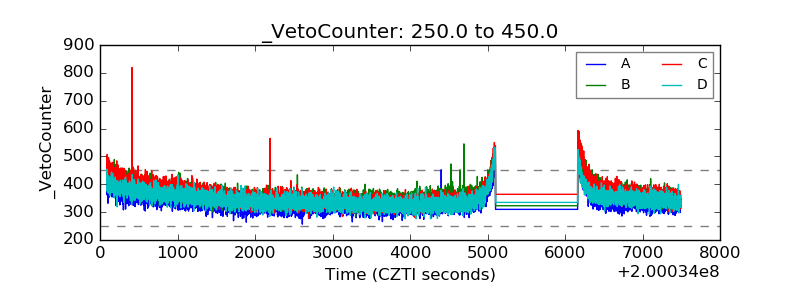 |