| Param | Original file | Final file |
|---|---|---|
| Filename | modeM0/AS1G05_104T01_9000000440_03245cztM0_level2.evt | modeM0/AS1G05_104T01_9000000440_03245cztM0_level2_quad_clean.evt |
| Size (bytes) | 581,915,520 | 87,384,960 |
| Size | 555.0 MB | 83.3 MB |
| Events in quadrant A | 3,705,912 | 529,273 |
| Events in quadrant B | 4,474,046 | 531,693 |
| Events in quadrant C | 4,281,412 | 526,102 |
| Events in quadrant D | 4,621,152 | 504,678 |
| Mode M0 | |||
|---|---|---|---|
| Quadrant | BADHDUFLAG | Total packets | Discarded packets |
| A | 0 | 16682 | 5 |
| B | 0 | 18191 | 4 |
| C | 0 | 18368 | 4 |
| D | 0 | 19431 | 4 |
| Mode SS | |||
|---|---|---|---|
| Quadrant | BADHDUFLAG | Total packets | Discarded packets |
| A | 0 | 166 | 0 |
| B | 0 | 166 | 0 |
| C | 0 | 166 | 0 |
| D | 0 | 166 | 0 |
| Mode M9 | |||
|---|---|---|---|
| Quadrant | BADHDUFLAG | Total packets | Discarded packets |
| A | 0 | 16 | 0 |
| B | 0 | 16 | 0 |
| C | 0 | 16 | 0 |
| D | 0 | 16 | 0 |
| Quadrant | Total seconds | Saturated seconds | Saturation percentage |
|---|---|---|---|
| A | 7968 | 227 | 2.848896% |
| B | 7968 | 234 | 2.936747% |
| C | 7968 | 285 | 3.576807% |
| D | 7968 | 350 | 4.392570% |
Noise dominated data is calculated using 1-second bins in cleaned event files. If a bin has >2000 counts, and if more than 50% of those come from <1% of pixels, then it is considered to be noise-dominated and hence unusable.
| Quadrant | # 1 sec bins | Bins with >0 counts | Bins with >2000 counts | High rate bins dominated by noise | Noise dominated (total time) | Noise dominated (detector-on time) | Marked lightcurve |
|---|---|---|---|---|---|---|---|
| A | 9638 | 7972 | 20 | 20 | 0.21% | 0.25% |  |
| B | 9638 | 7972 | 4 | 4 | 0.04% | 0.05% |  |
| C | 9638 | 7972 | 67 | 67 | 0.70% | 0.84% | 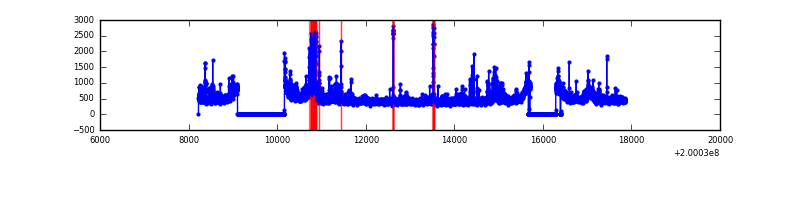 |
| D | 9638 | 7972 | 179 | 179 | 1.86% | 2.25% | 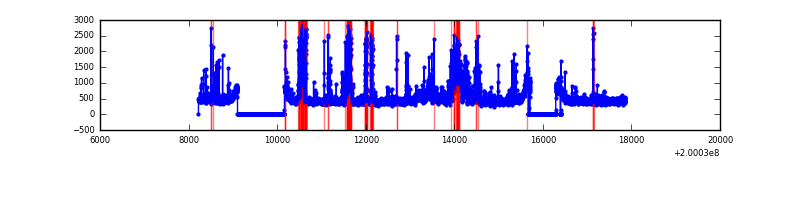 |
Top three noisy pixels from each quadrant. If the there are fewer than three noisy pixels in the level2.evt file, extra rows are filled as -1
| Pixel properties | Quadrant properties | ||||||
|---|---|---|---|---|---|---|---|
| Quadrant | DetID | PixID | Counts | Sigma | Mean | Median | Sigma |
| A | 0 | 118 | 84894 | 439.58 | 930 | 908 | 191.1 |
| A | 0 | 226 | 18017 | 89.55 | 930 | 908 | 191.1 |
| A | 0 | 31 | 14578 | 71.55 | 930 | 908 | 191.1 |
| B | 15 | 204 | 687029 | 3747.8 | 950 | 928 | 183.1 |
| B | 2 | 249 | 93084 | 503.4 | 950 | 928 | 183.1 |
| B | 5 | 200 | 16400 | 84.52 | 950 | 928 | 183.1 |
| C | 14 | 48 | 324093 | 1519.95 | 908 | 912 | 212.6 |
| C | 14 | 223 | 288700 | 1353.49 | 908 | 912 | 212.6 |
| C | 6 | 80 | 85608 | 398.33 | 908 | 912 | 212.6 |
| D | 13 | 114 | 539711 | 2475.79 | 896 | 867 | 217.6 |
| D | 13 | 223 | 523771 | 2402.55 | 896 | 867 | 217.6 |
| D | 5 | 233 | 43126 | 194.16 | 896 | 867 | 217.6 |
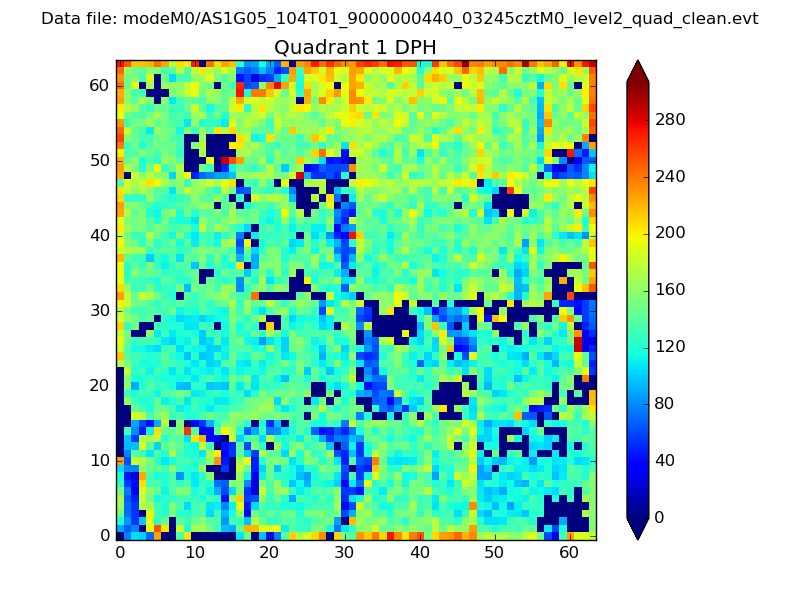
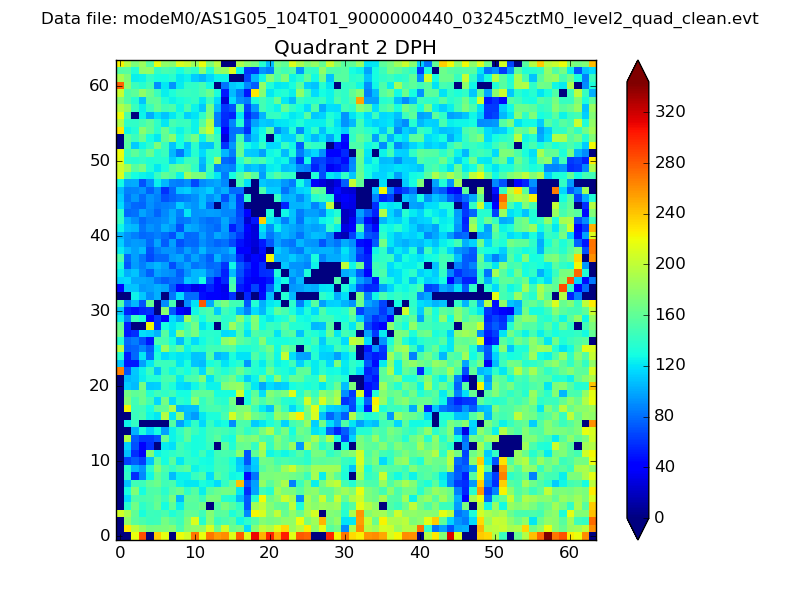
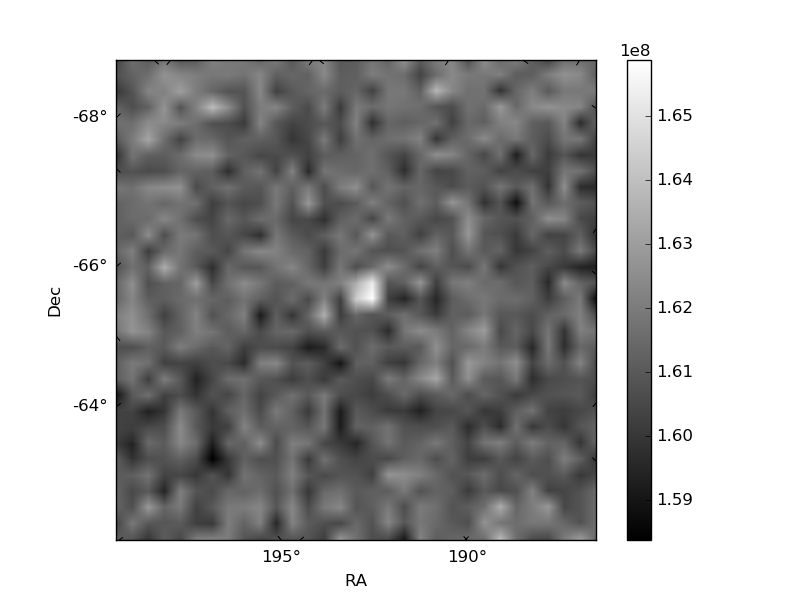
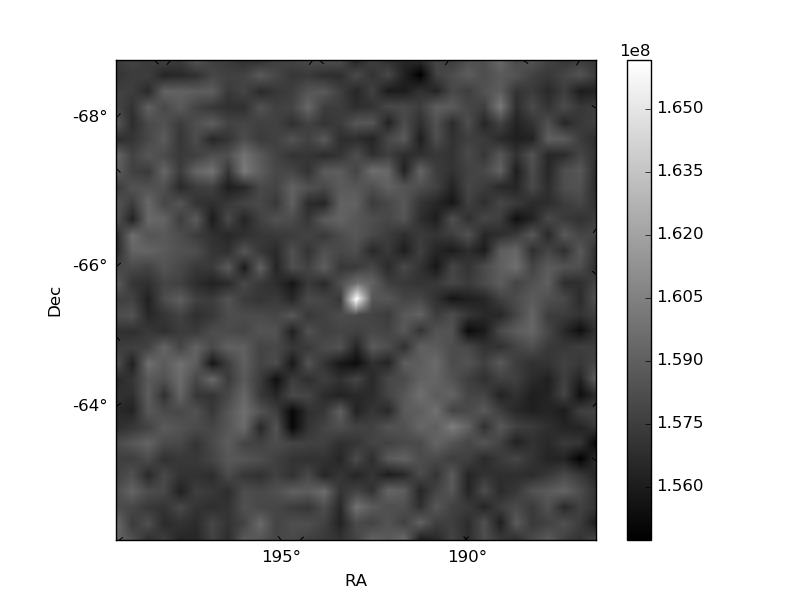
Histogram calculated using DETX and DETY for each event in the final _common_clean file
| Quadrant A |  |
 |
Quadrant B |
|---|---|---|---|
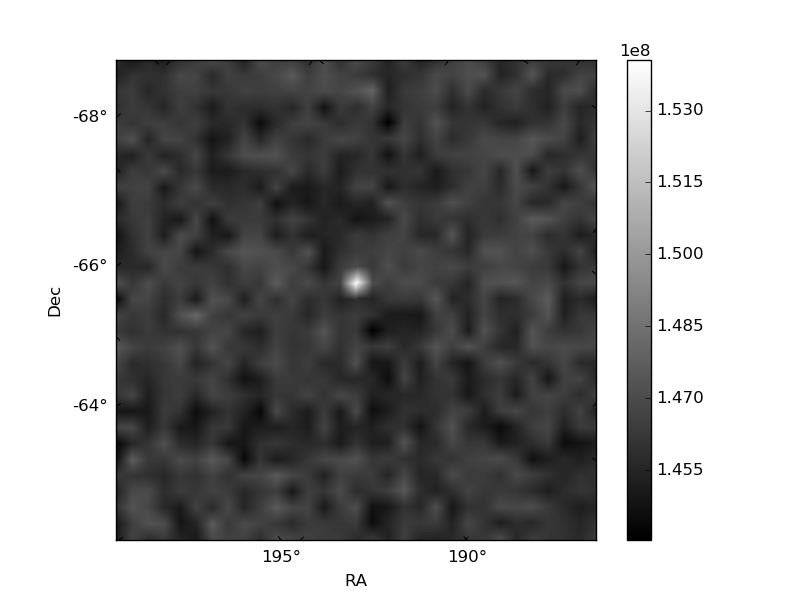
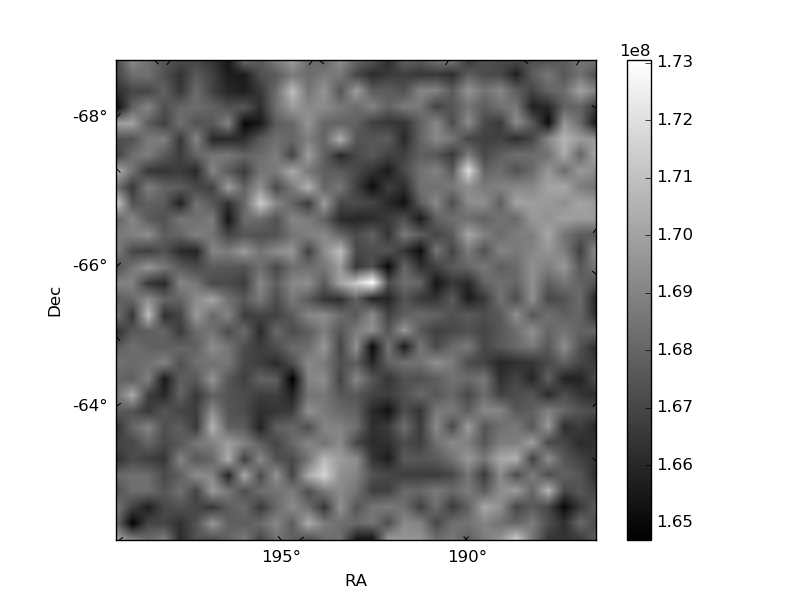
| Quadrant D | 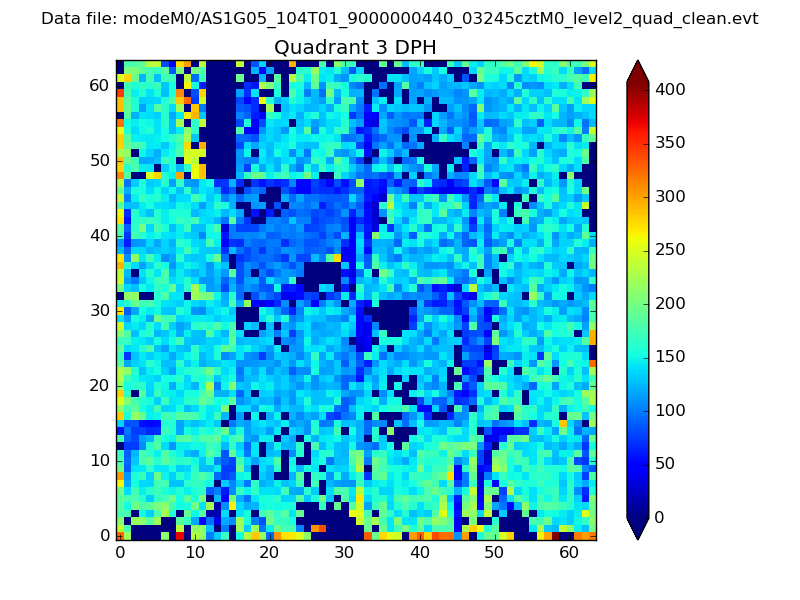 |
 |
Quadrant C |
| Plot type | Count rate plots | Images |
|---|---|---|
| Comparison with Poisson distribution Blue bars denote a histogram of data divided into 1 sec bins. Red curve is a Poisson curve with rate = median count rate of data. |
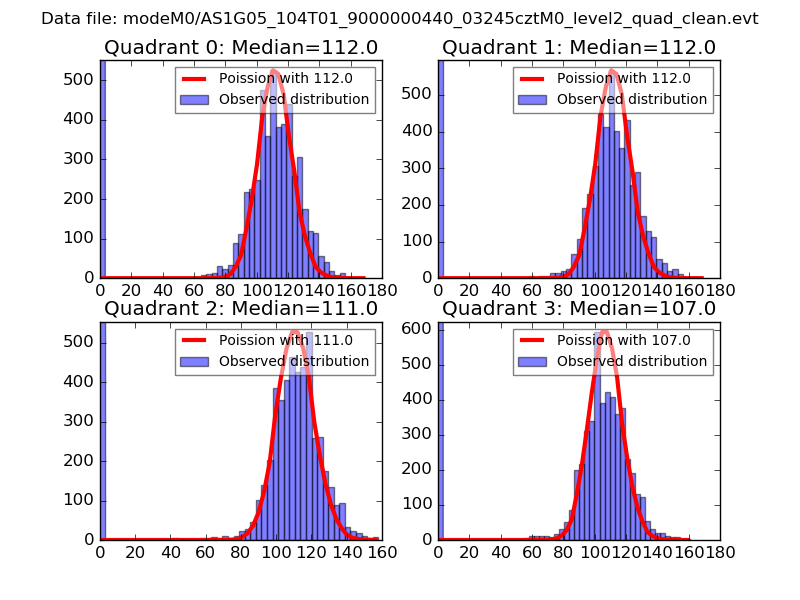 |
 |
| Quadrant-wise count rates Data is divided into 100 sec bins |
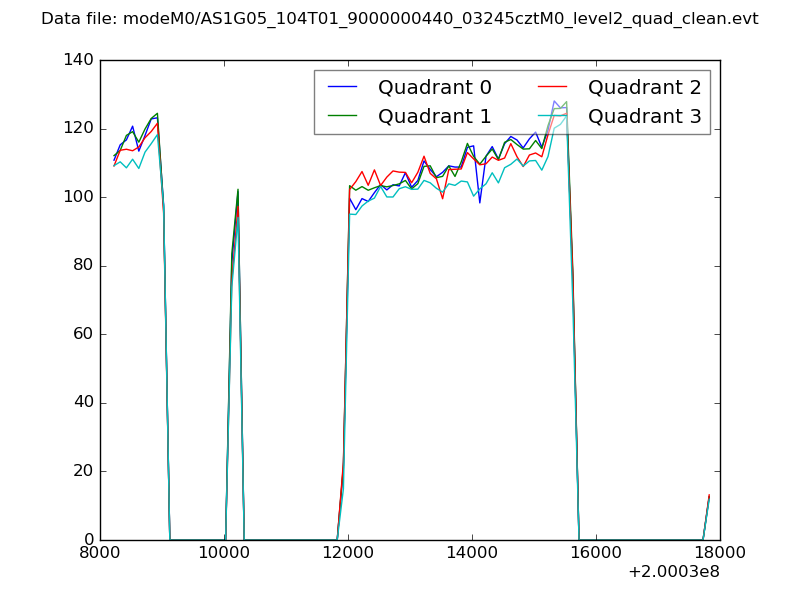 |
|
| Module-wise count rates for Quadrant A Data is divided into 100 sec bins |
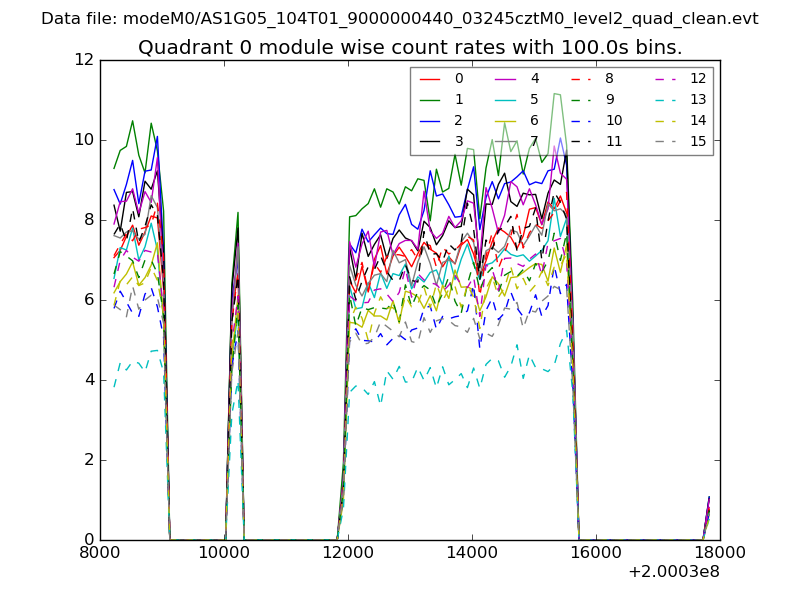 |
 |
| Module-wise count rates for Quadrant B Data is divided into 100 sec bins |
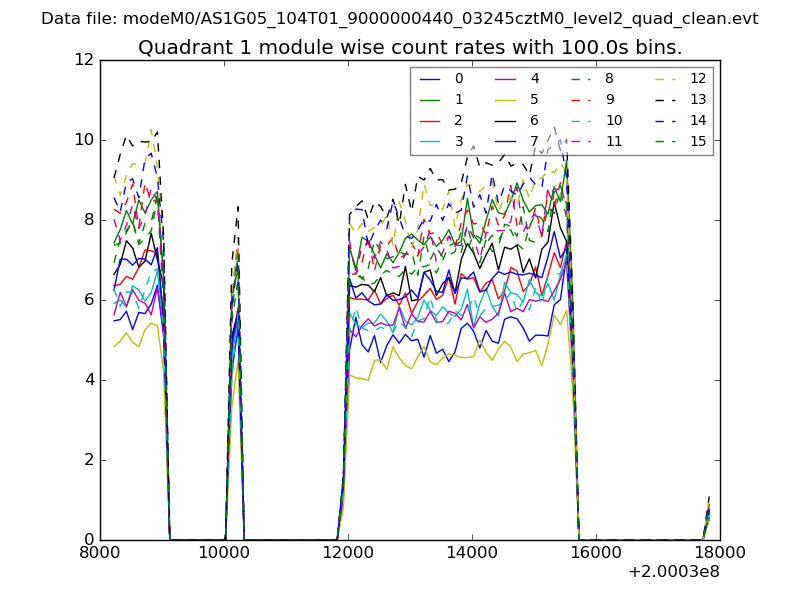 |
 |
| Module-wise count rates for Quadrant C Data is divided into 100 sec bins |
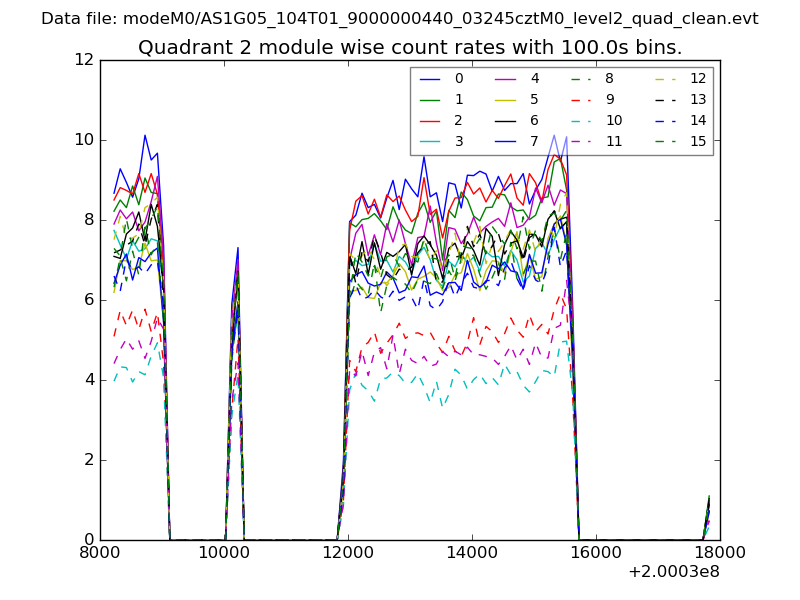 |
 |
| Module-wise count rates for Quadrant D Data is divided into 100 sec bins |
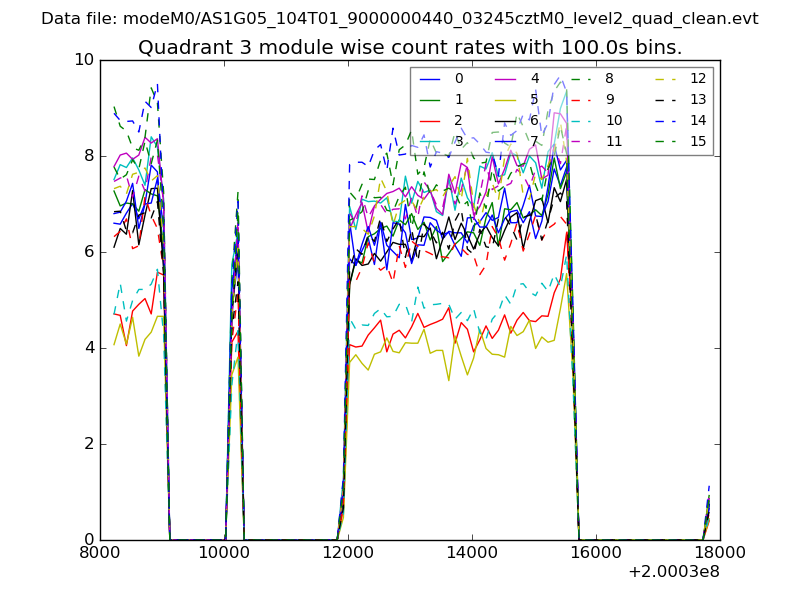 |
 |
| Parameter | Plot |
|---|---|
| CZT HV Monitor | 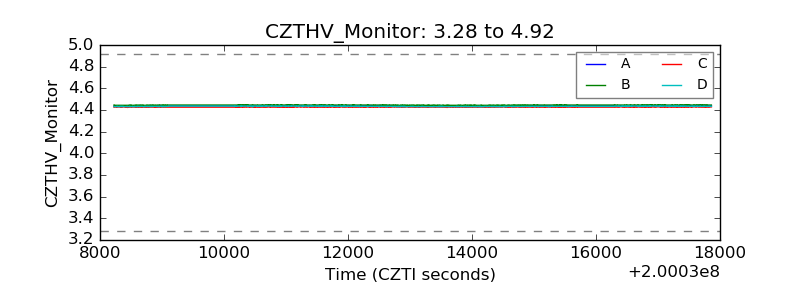 |
| D_VDD | 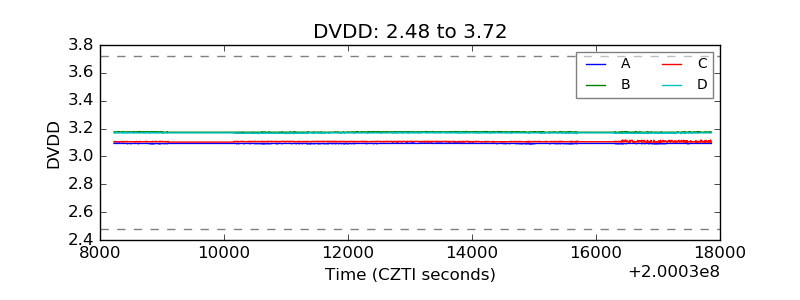 |
| Temperature 1 | 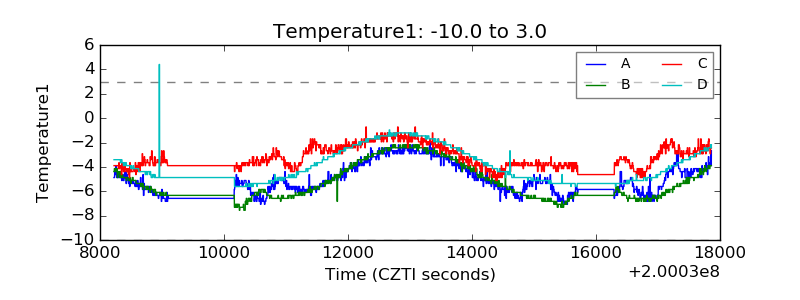 |
| Veto HV Monitor | 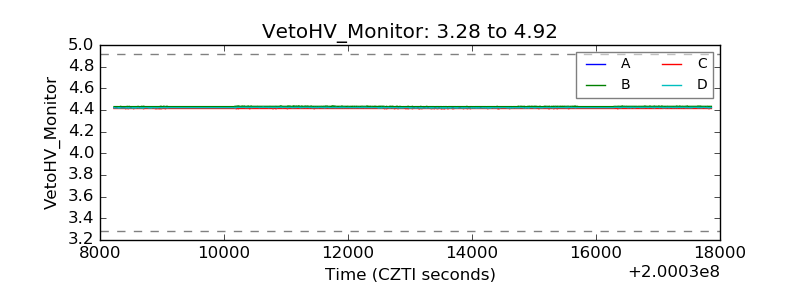 |
| Veto LLD |  |
| Alpha Counter | 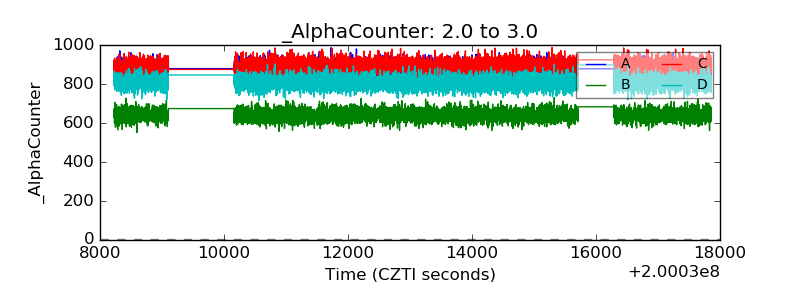 |
| _CPM_Rate | 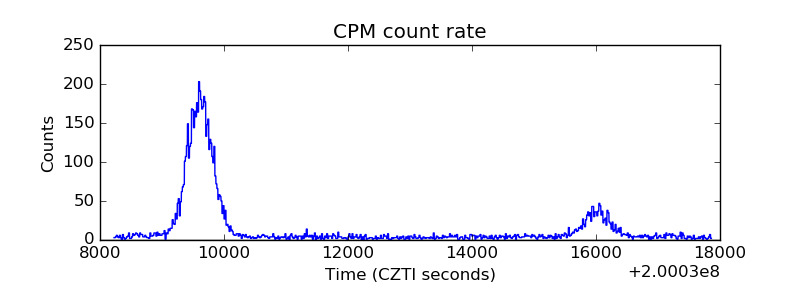 |
| CZT Counter | 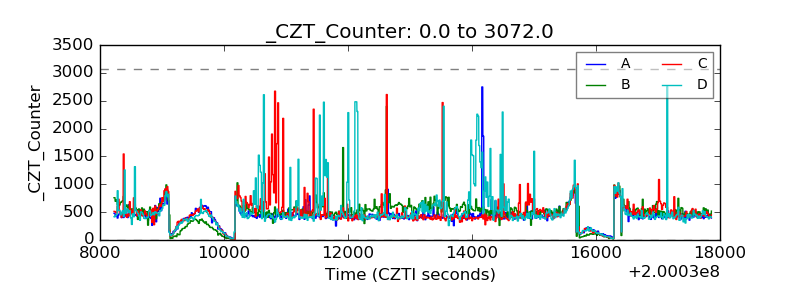 |
| +2.5 Volts monitor |  |
| +5 Volts monitor |  |
| _ROLL_ROT | 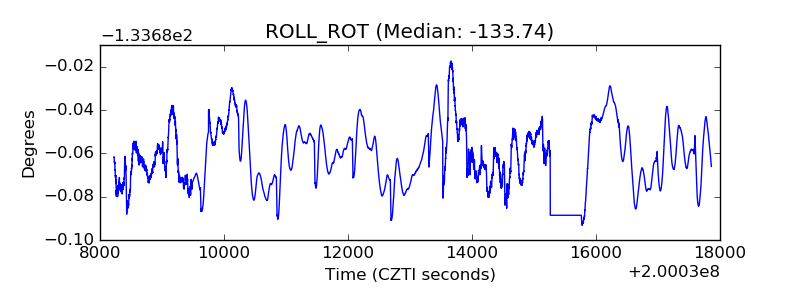 |
| _Roll_DEC | 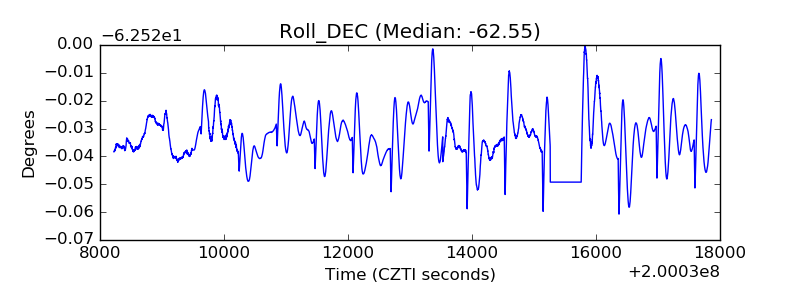 |
| _Roll_RA | 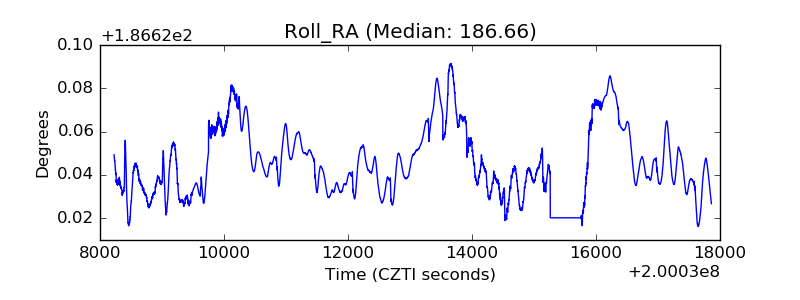 |
| Veto Counter | 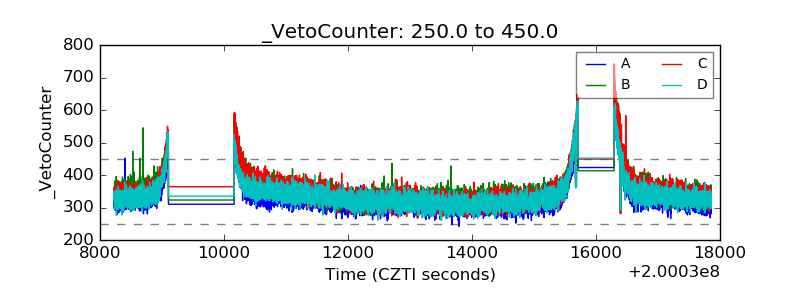 |