| Param | Original file | Final file |
|---|---|---|
| Filename | modeM0/AS1G05_104T01_9000000440_03247cztM0_level2.evt | modeM0/AS1G05_104T01_9000000440_03247cztM0_level2_quad_clean.evt |
| Size (bytes) | 196,738,560 | 28,451,520 |
| Size | 187.6 MB | 27.1 MB |
| Events in quadrant A | 1,448,623 | 166,510 |
| Events in quadrant B | 1,569,961 | 166,715 |
| Events in quadrant C | 1,293,793 | 172,202 |
| Events in quadrant D | 1,459,871 | 161,862 |
| Mode M0 | |||
|---|---|---|---|
| Quadrant | BADHDUFLAG | Total packets | Discarded packets |
| A | 0 | 6209 | 1 |
| B | 0 | 6394 | 0 |
| C | 0 | 5718 | 0 |
| D | 0 | 6237 | 0 |
| Mode SS | |||
|---|---|---|---|
| Quadrant | BADHDUFLAG | Total packets | Discarded packets |
| A | 0 | 54 | 0 |
| B | 0 | 54 | 0 |
| C | 0 | 54 | 0 |
| D | 0 | 54 | 0 |
| Quadrant | Total seconds | Saturated seconds | Saturation percentage |
|---|---|---|---|
| A | 2705 | 108 | 3.992606% |
| B | 2705 | 32 | 1.182994% |
| C | 2705 | 26 | 0.961183% |
| D | 2705 | 41 | 1.515712% |
Noise dominated data is calculated using 1-second bins in cleaned event files. If a bin has >2000 counts, and if more than 50% of those come from <1% of pixels, then it is considered to be noise-dominated and hence unusable.
| Quadrant | # 1 sec bins | Bins with >0 counts | Bins with >2000 counts | High rate bins dominated by noise | Noise dominated (total time) | Noise dominated (detector-on time) | Marked lightcurve |
|---|---|---|---|---|---|---|---|
| A | 2705 | 2705 | 77 | 77 | 2.85% | 2.85% |  |
| B | 2705 | 2705 | 0 | 0 | 0.00% | 0.00% | 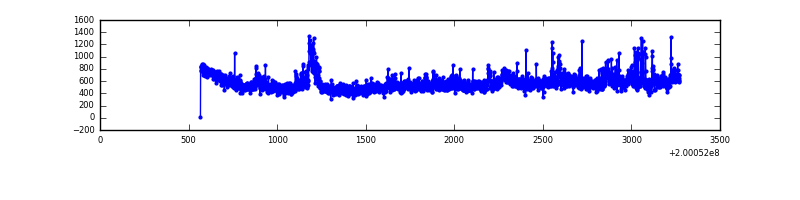 |
| C | 2705 | 2705 | 2 | 2 | 0.07% | 0.07% | 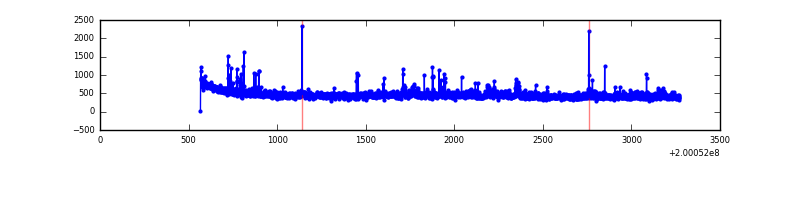 |
| D | 2705 | 2705 | 31 | 31 | 1.15% | 1.15% | 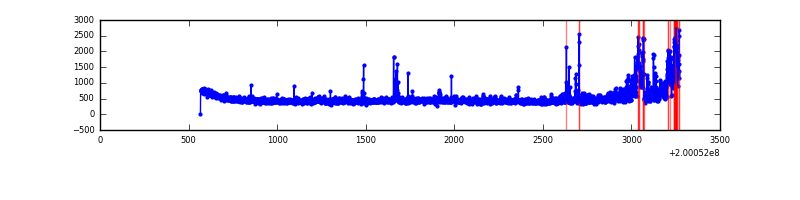 |
Top three noisy pixels from each quadrant. If the there are fewer than three noisy pixels in the level2.evt file, extra rows are filled as -1
| Pixel properties | Quadrant properties | ||||||
|---|---|---|---|---|---|---|---|
| Quadrant | DetID | PixID | Counts | Sigma | Mean | Median | Sigma |
| A | 0 | 50 | 232417 | 3529.17 | 309 | 303 | 65.8 |
| A | 0 | 118 | 15872 | 236.72 | 309 | 303 | 65.8 |
| A | 0 | 226 | 4726 | 67.25 | 309 | 303 | 65.8 |
| B | 15 | 204 | 292253 | 4651.08 | 314 | 306 | 62.8 |
| B | 2 | 249 | 40853 | 645.96 | 314 | 306 | 62.8 |
| B | 5 | 200 | 7549 | 115.39 | 314 | 306 | 62.8 |
| C | 14 | 48 | 44054 | 601.99 | 305 | 306 | 72.7 |
| C | 14 | 223 | 25416 | 345.53 | 305 | 306 | 72.7 |
| C | 15 | 208 | 15076 | 203.24 | 305 | 306 | 72.7 |
| D | 13 | 114 | 244517 | 3223.18 | 305 | 295 | 75.8 |
| D | 10 | 34 | 16307 | 211.32 | 305 | 295 | 75.8 |
| D | 13 | 223 | 14197 | 183.48 | 305 | 295 | 75.8 |
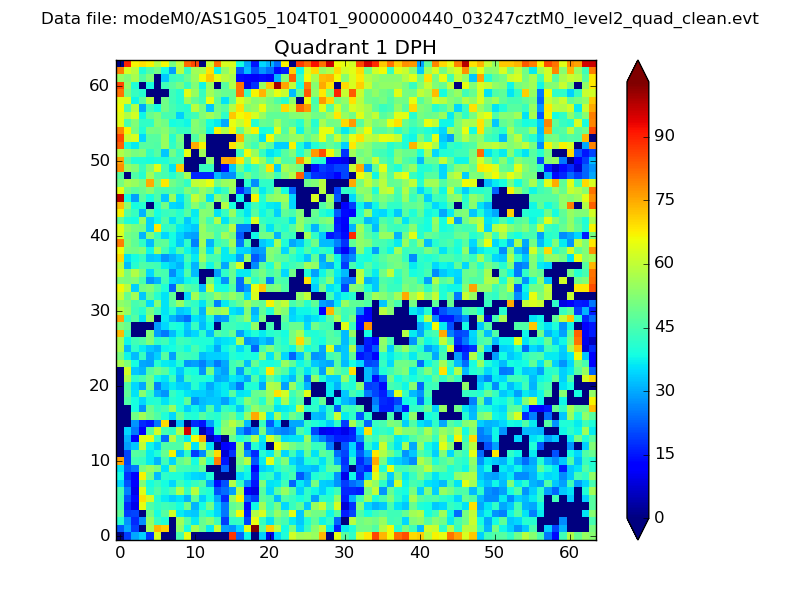
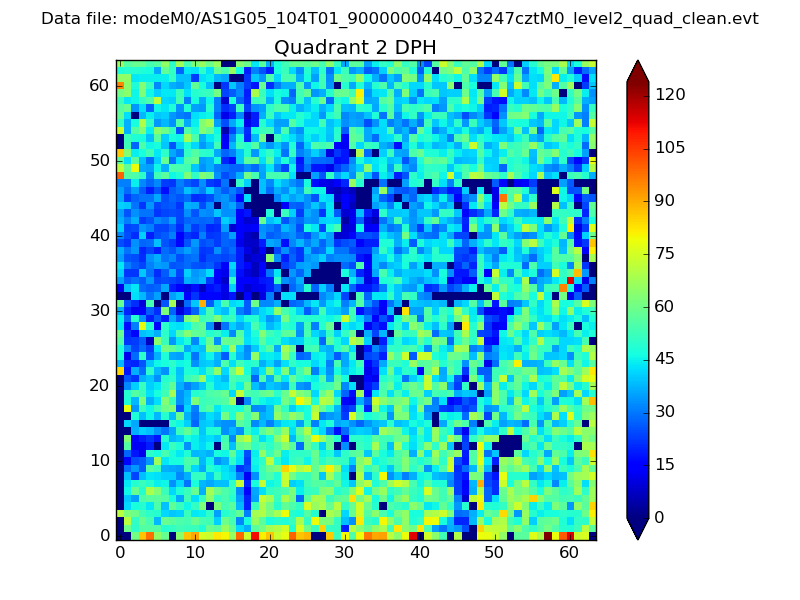
Histogram calculated using DETX and DETY for each event in the final _common_clean file
| Quadrant A | 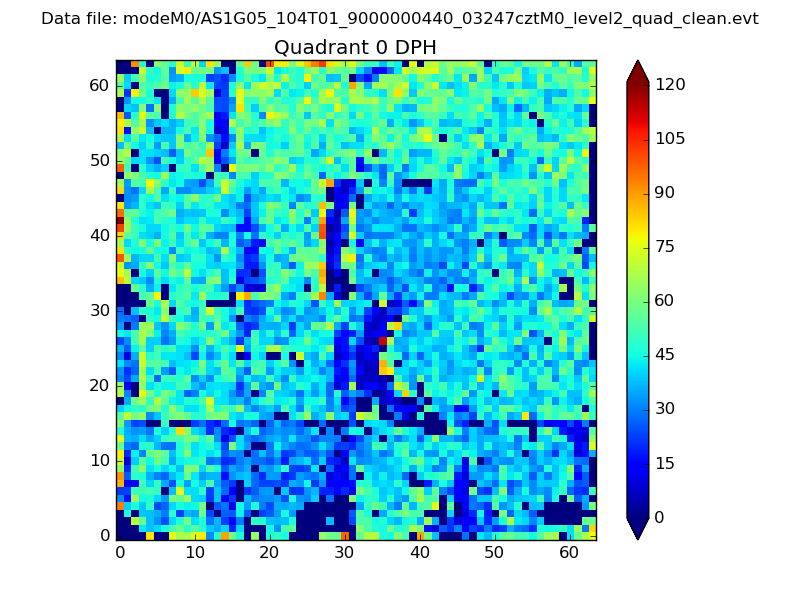 |
 |
Quadrant B |
|---|---|---|---|
| Quadrant D | 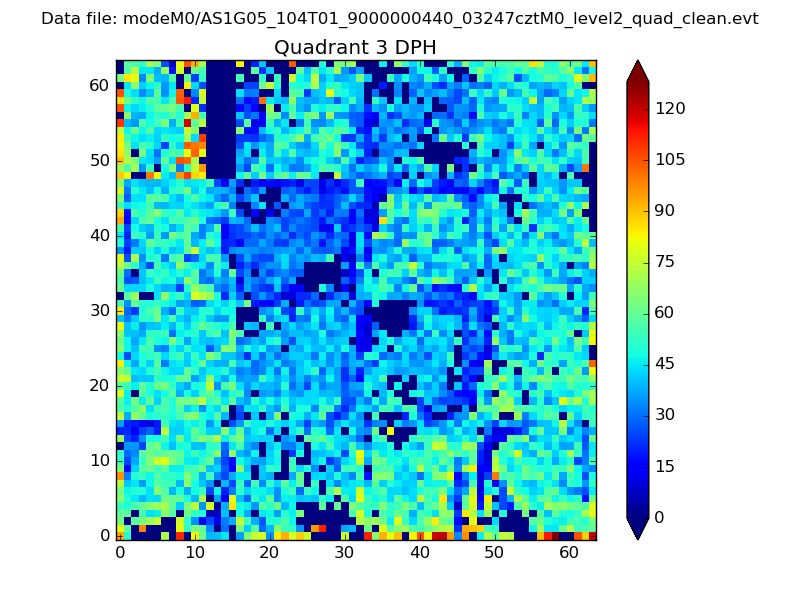 |
 |
Quadrant C |
| Plot type | Count rate plots | Images |
|---|---|---|
| Comparison with Poisson distribution Blue bars denote a histogram of data divided into 1 sec bins. Red curve is a Poisson curve with rate = median count rate of data. |
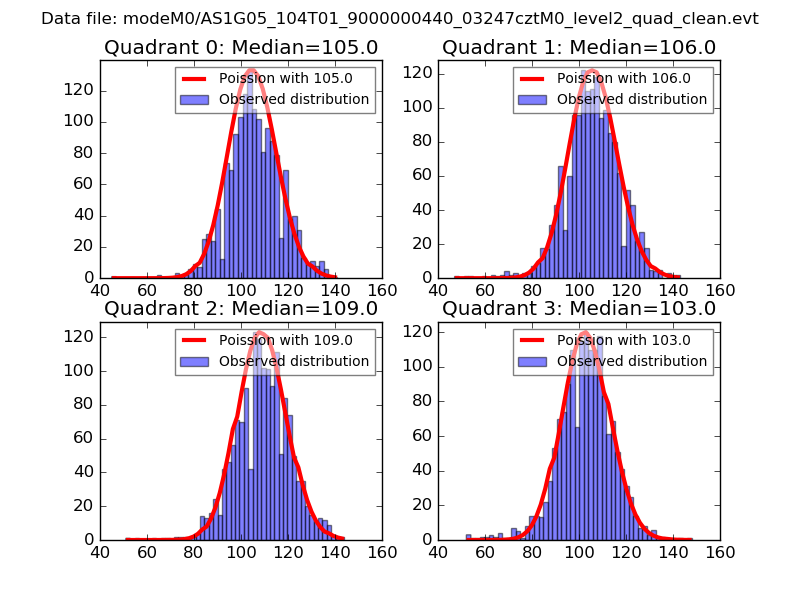 |
 |
| Quadrant-wise count rates Data is divided into 100 sec bins |
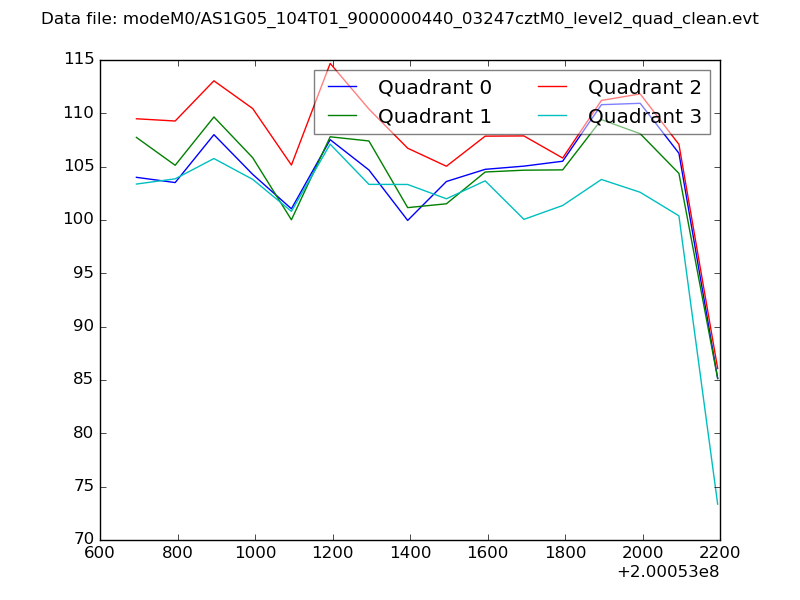 |
|
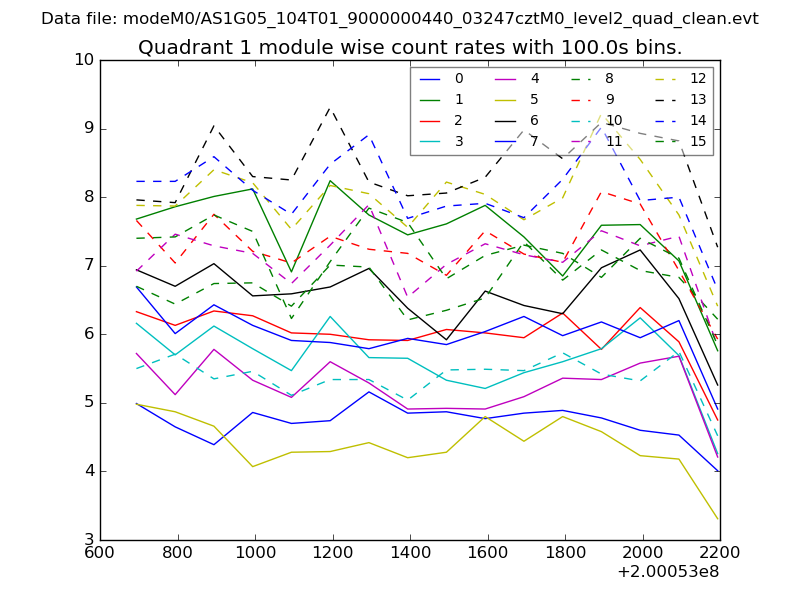
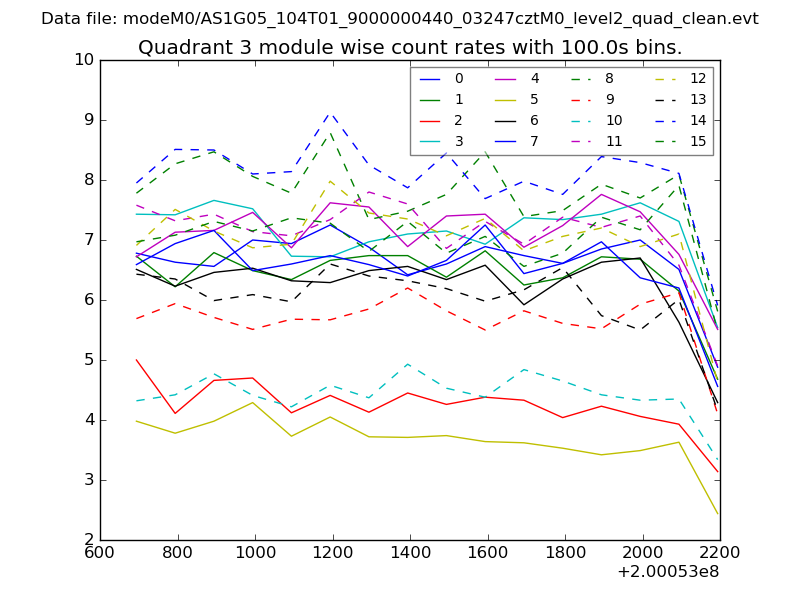
| Module-wise count rates for Quadrant A Data is divided into 100 sec bins |
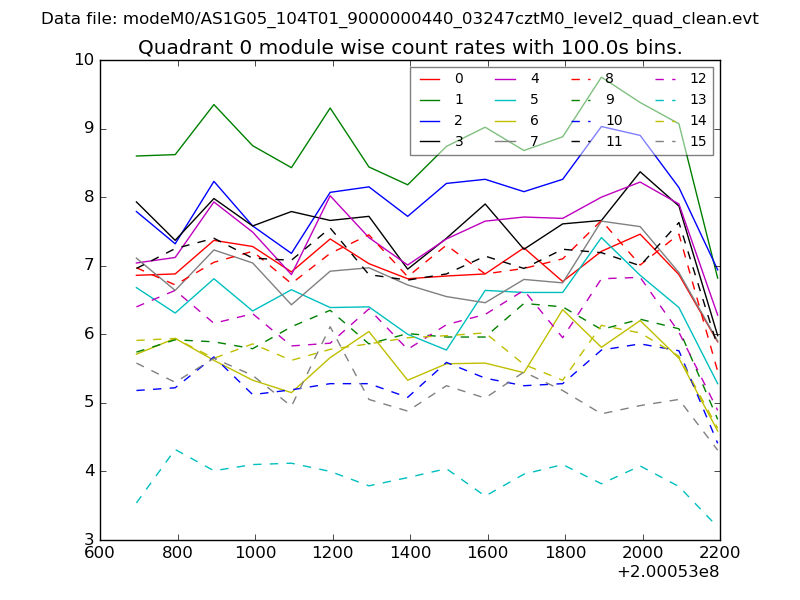 |
 |
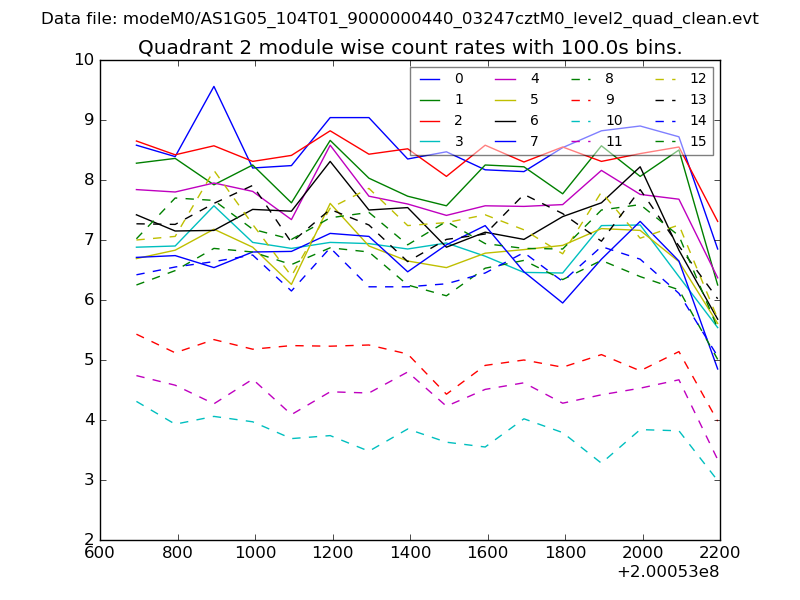
| Module-wise count rates for Quadrant B Data is divided into 100 sec bins |
 |
 |
| Module-wise count rates for Quadrant C Data is divided into 100 sec bins |
 |
 |
| Module-wise count rates for Quadrant D Data is divided into 100 sec bins |
 |
 |
| Parameter | Plot |
|---|---|
| CZT HV Monitor | 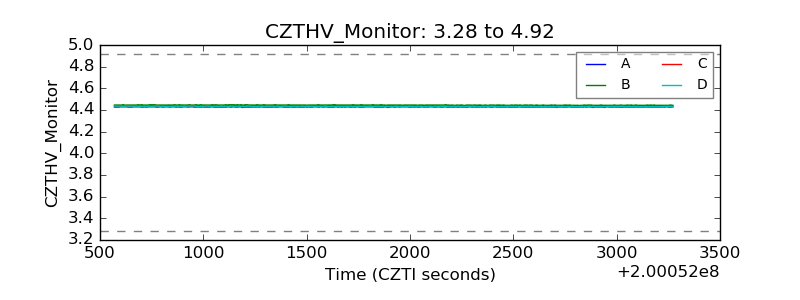 |
| D_VDD | 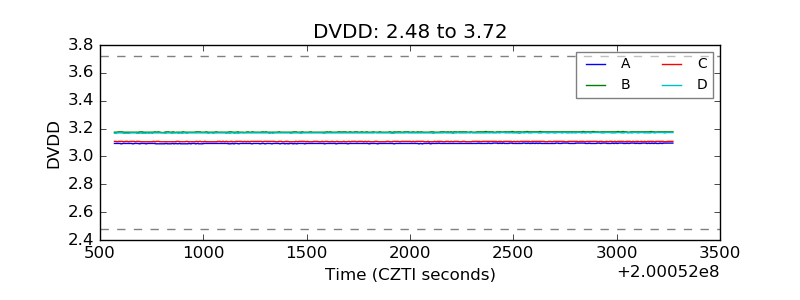 |
| Temperature 1 | 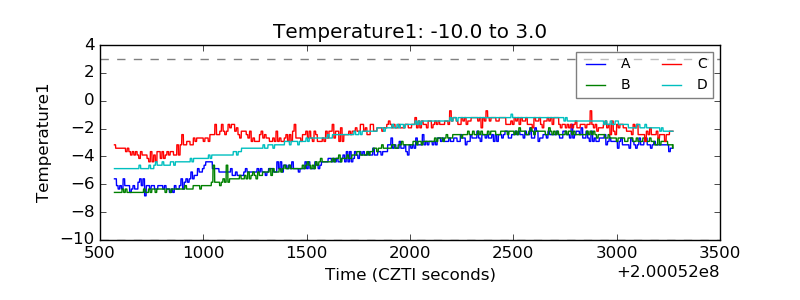 |
| Veto HV Monitor | 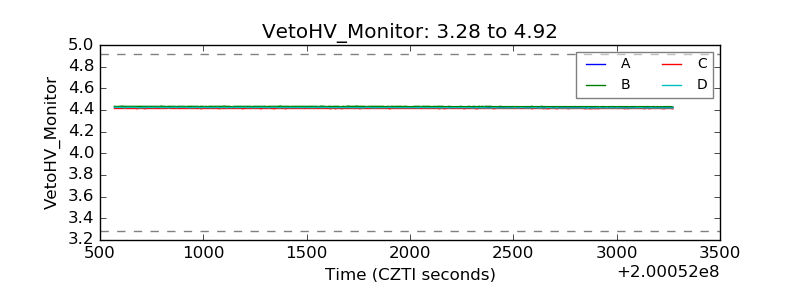 |
| Veto LLD | 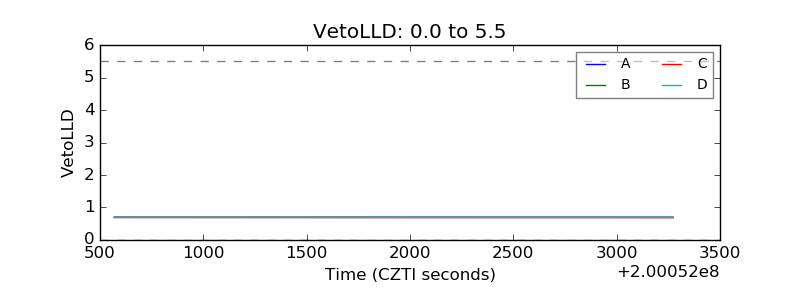 |
| Alpha Counter | 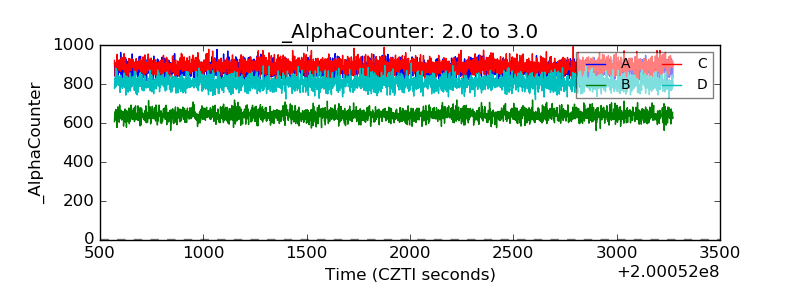 |
| _CPM_Rate | 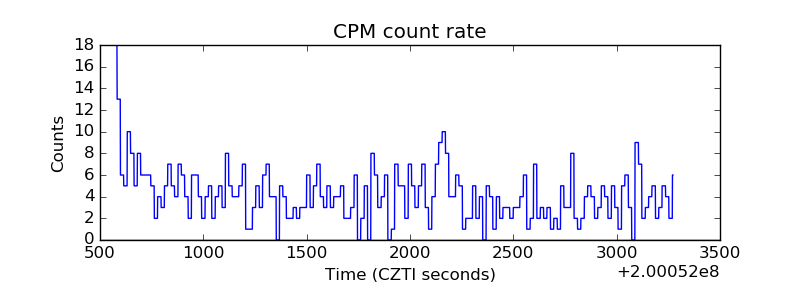 |
| CZT Counter | 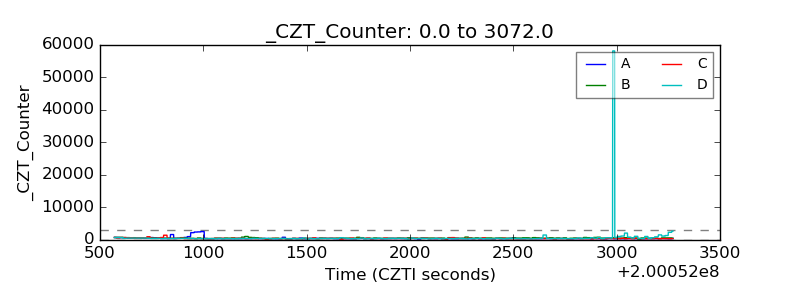 |
| +2.5 Volts monitor |  |
| +5 Volts monitor |  |
| _ROLL_ROT | 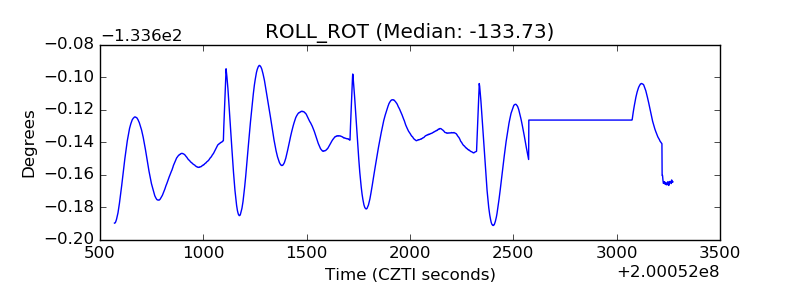 |
| _Roll_DEC | 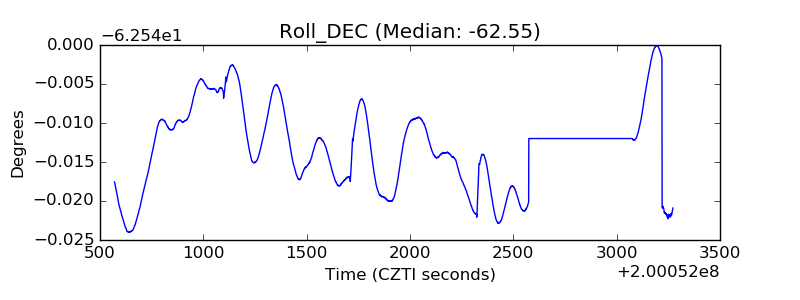 |
| _Roll_RA | 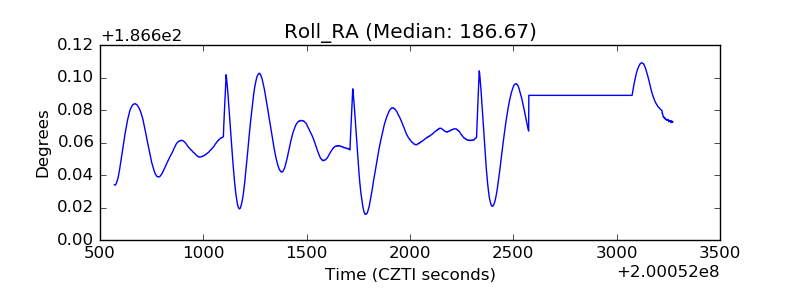 |
| Veto Counter | 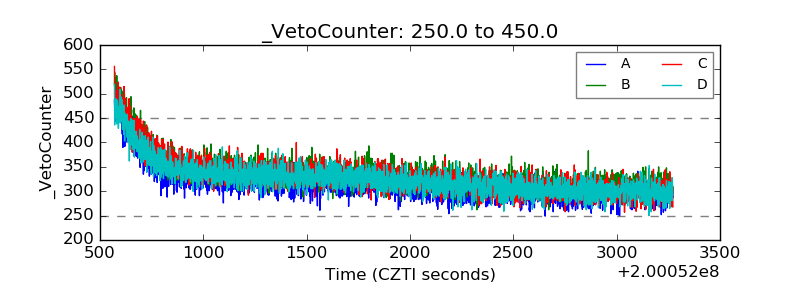 |