| Param | Original file | Final file |
|---|---|---|
| Filename | modeM0/AS1G05_104T01_9000000440_03250cztM0_level2.evt | modeM0/AS1G05_104T01_9000000440_03250cztM0_level2_quad_clean.evt |
| Size (bytes) | 399,951,360 | 69,010,560 |
| Size | 381.4 MB | 65.8 MB |
| Events in quadrant A | 2,641,269 | 436,269 |
| Events in quadrant B | 3,035,744 | 433,107 |
| Events in quadrant C | 2,647,421 | 430,712 |
| Events in quadrant D | 3,413,264 | 404,296 |
| Mode M0 | |||
|---|---|---|---|
| Quadrant | BADHDUFLAG | Total packets | Discarded packets |
| A | 0 | 11719 | 2 |
| B | 0 | 12415 | 1 |
| C | 0 | 11673 | 1 |
| D | 0 | 14038 | 1 |
| Mode SS | |||
|---|---|---|---|
| Quadrant | BADHDUFLAG | Total packets | Discarded packets |
| A | 0 | 110 | 0 |
| B | 0 | 110 | 0 |
| C | 0 | 110 | 0 |
| D | 0 | 110 | 0 |
| Mode M9 | |||
|---|---|---|---|
| Quadrant | BADHDUFLAG | Total packets | Discarded packets |
| A | 0 | 1 | 0 |
| B | 0 | 1 | 0 |
| C | 0 | 1 | 0 |
| D | 0 | 1 | 0 |
| Quadrant | Total seconds | Saturated seconds | Saturation percentage |
|---|---|---|---|
| A | 5511 | 245 | 4.445654% |
| B | 5511 | 241 | 4.373072% |
| C | 5511 | 167 | 3.030303% |
| D | 5511 | 272 | 4.935583% |
Noise dominated data is calculated using 1-second bins in cleaned event files. If a bin has >2000 counts, and if more than 50% of those come from <1% of pixels, then it is considered to be noise-dominated and hence unusable.
| Quadrant | # 1 sec bins | Bins with >0 counts | Bins with >2000 counts | High rate bins dominated by noise | Noise dominated (total time) | Noise dominated (detector-on time) | Marked lightcurve |
|---|---|---|---|---|---|---|---|
| A | 5526 | 5512 | 13 | 13 | 0.24% | 0.24% | 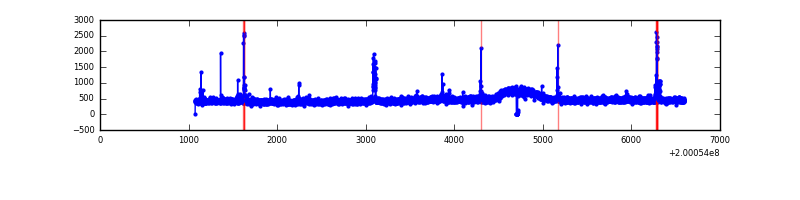 |
| B | 5526 | 5512 | 1 | 1 | 0.02% | 0.02% | 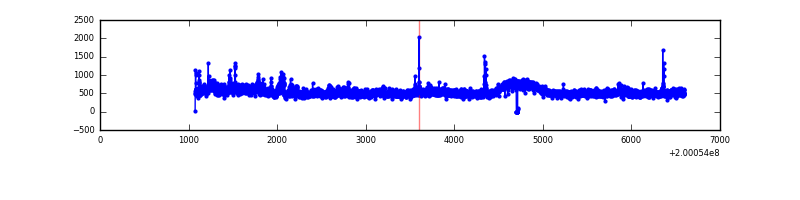 |
| C | 5526 | 5512 | 8 | 8 | 0.14% | 0.15% | 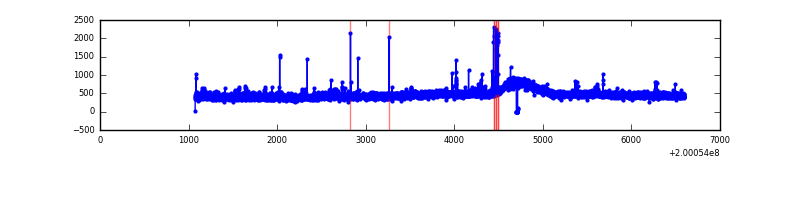 |
| D | 5526 | 5512 | 168 | 168 | 3.04% | 3.05% | 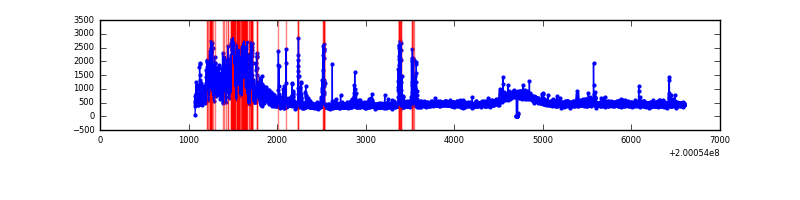 |
Top three noisy pixels from each quadrant. If the there are fewer than three noisy pixels in the level2.evt file, extra rows are filled as -1
| Pixel properties | Quadrant properties | ||||||
|---|---|---|---|---|---|---|---|
| Quadrant | DetID | PixID | Counts | Sigma | Mean | Median | Sigma |
| A | 0 | 118 | 76841 | 561.36 | 654 | 640 | 135.7 |
| A | 0 | 50 | 27205 | 195.7 | 654 | 640 | 135.7 |
| A | 0 | 226 | 13752 | 96.59 | 654 | 640 | 135.7 |
| B | 15 | 204 | 426525 | 3278.8 | 665 | 649 | 129.9 |
| B | 2 | 249 | 17059 | 126.34 | 665 | 649 | 129.9 |
| B | 3 | 209 | 11266 | 81.74 | 665 | 649 | 129.9 |
| C | 14 | 223 | 51807 | 337.8 | 640 | 644 | 151.5 |
| C | 14 | 48 | 38244 | 248.25 | 640 | 644 | 151.5 |
| C | 15 | 208 | 20812 | 133.16 | 640 | 644 | 151.5 |
| D | 13 | 114 | 798808 | 5101.49 | 631 | 611 | 156.5 |
| D | 13 | 239 | 78211 | 495.96 | 631 | 611 | 156.5 |
| D | 13 | 223 | 78010 | 494.68 | 631 | 611 | 156.5 |
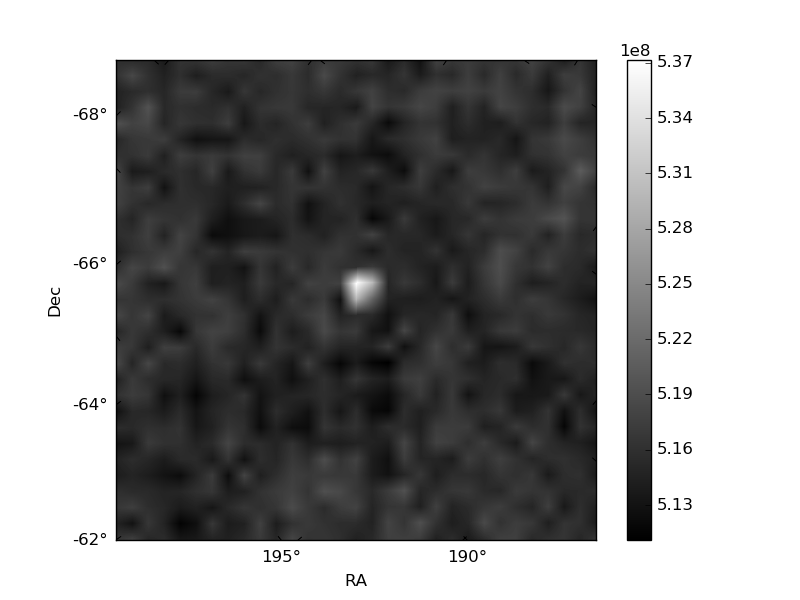
Histogram calculated using DETX and DETY for each event in the final _common_clean file
| Quadrant A | 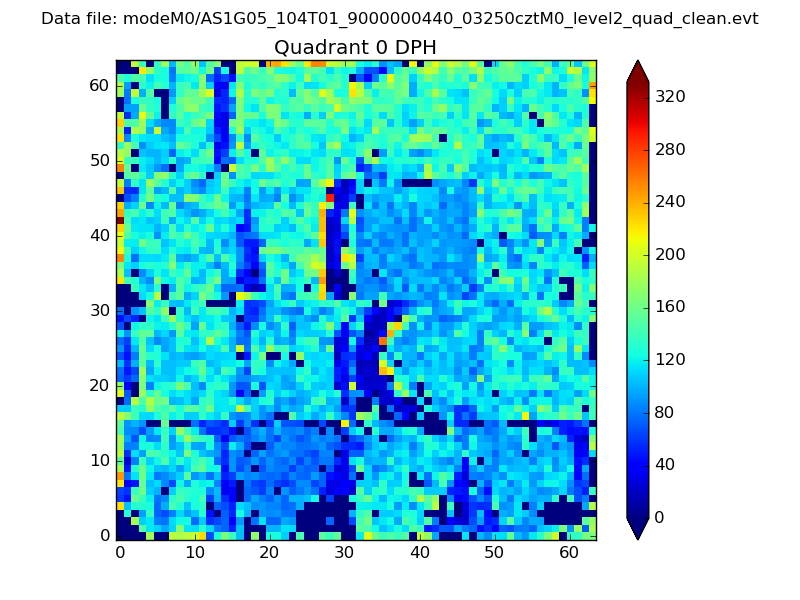 |
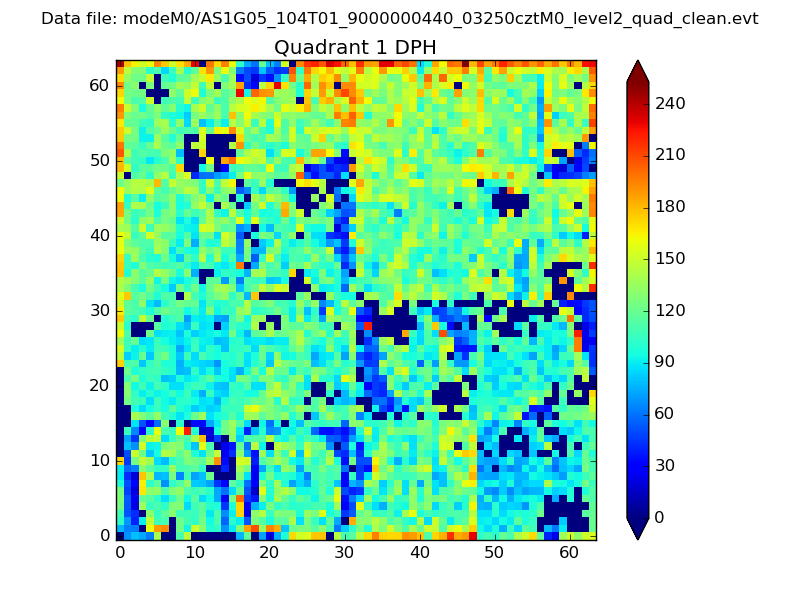 |
Quadrant B |
|---|---|---|---|
| Quadrant D | 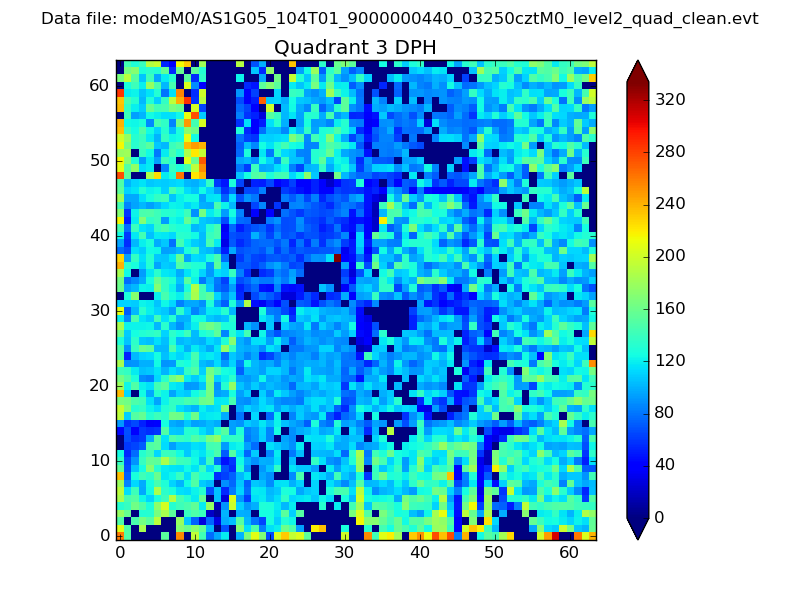 |
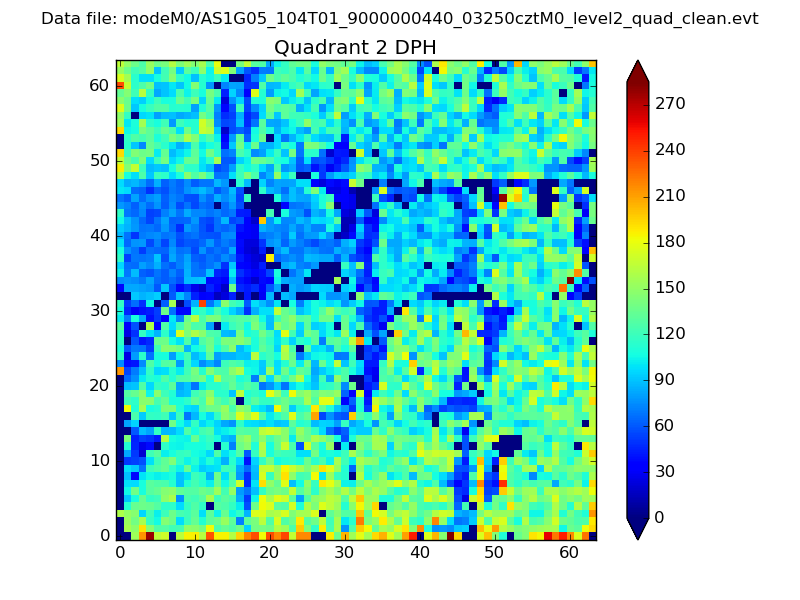 |
Quadrant C |
| Plot type | Count rate plots | Images |
|---|---|---|
| Comparison with Poisson distribution Blue bars denote a histogram of data divided into 1 sec bins. Red curve is a Poisson curve with rate = median count rate of data. |
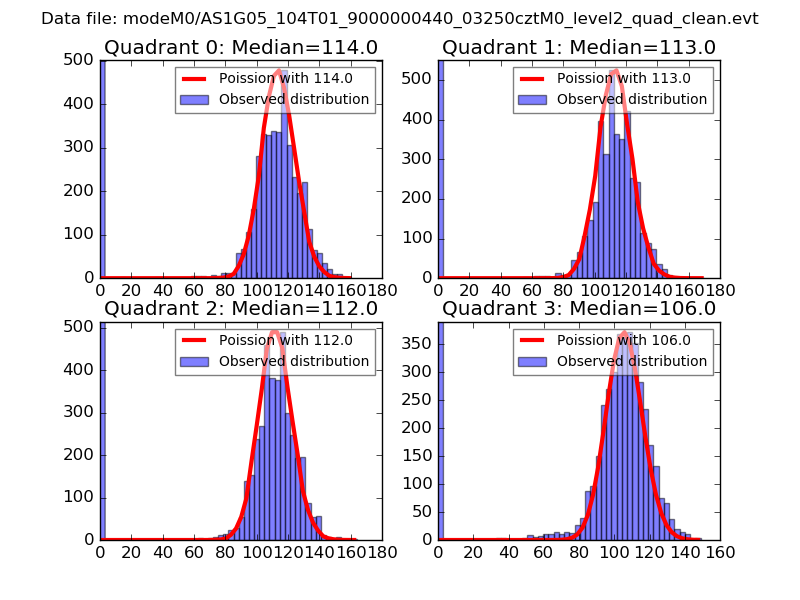 |
 |
| Quadrant-wise count rates Data is divided into 100 sec bins |
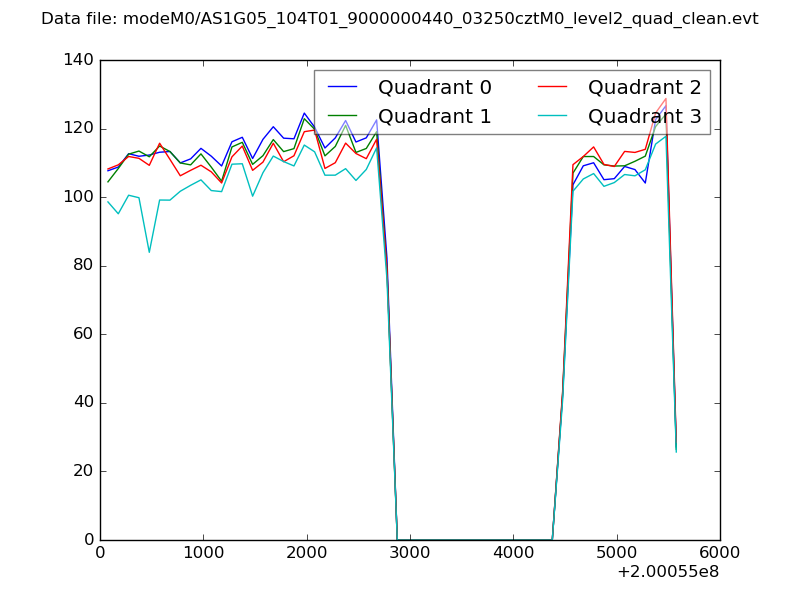 |
|
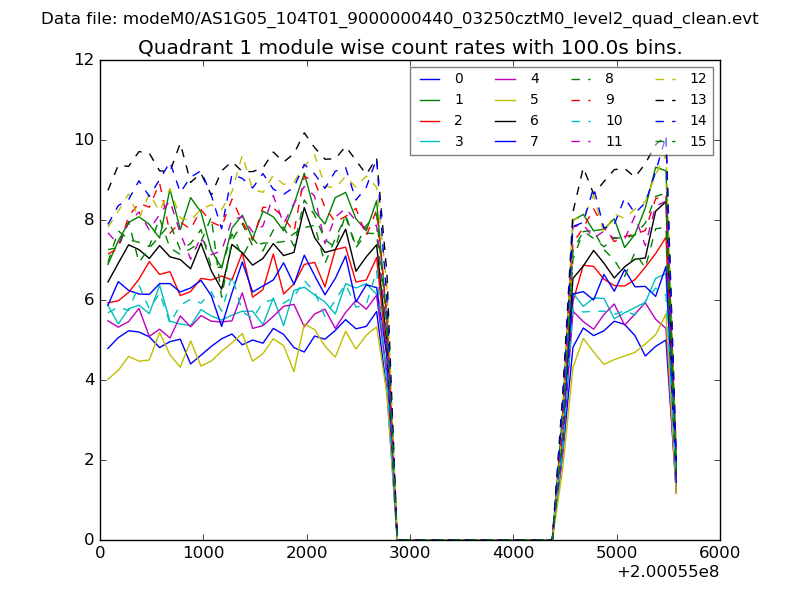
| Module-wise count rates for Quadrant A Data is divided into 100 sec bins |
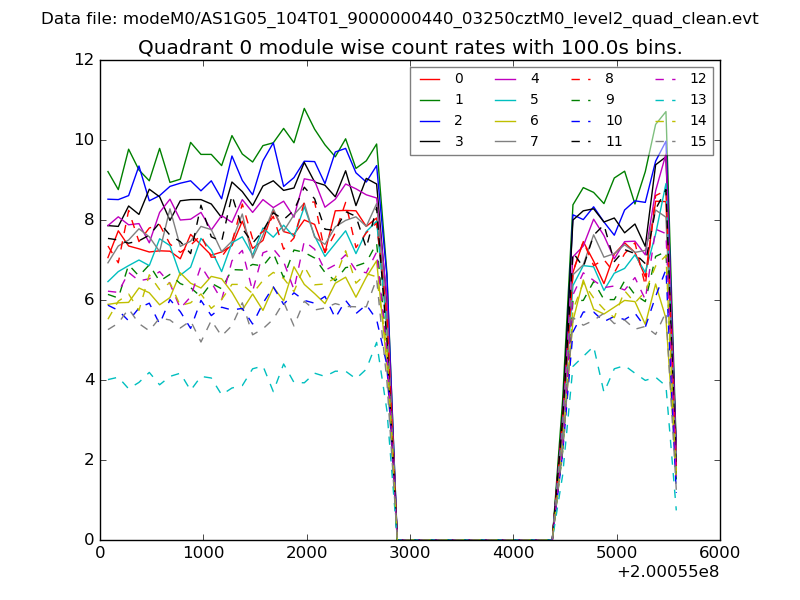 |
 |
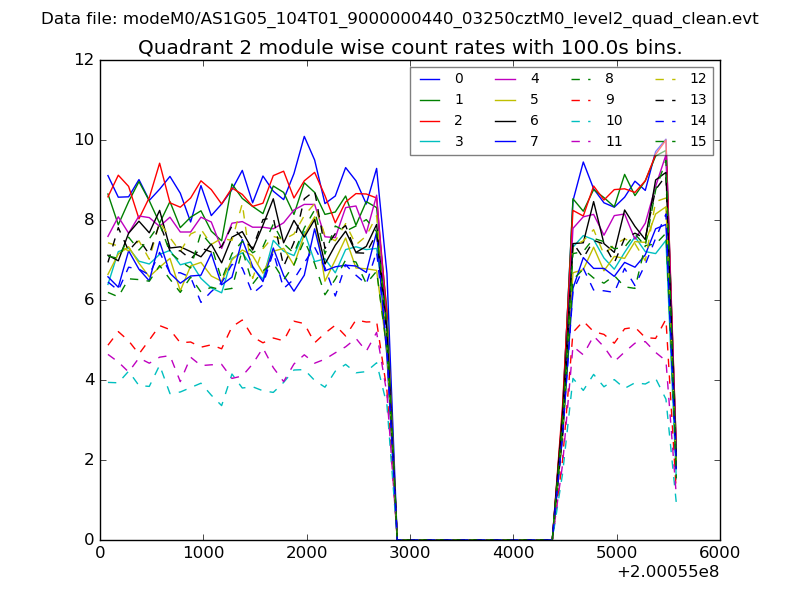
| Module-wise count rates for Quadrant B Data is divided into 100 sec bins |
 |
 |
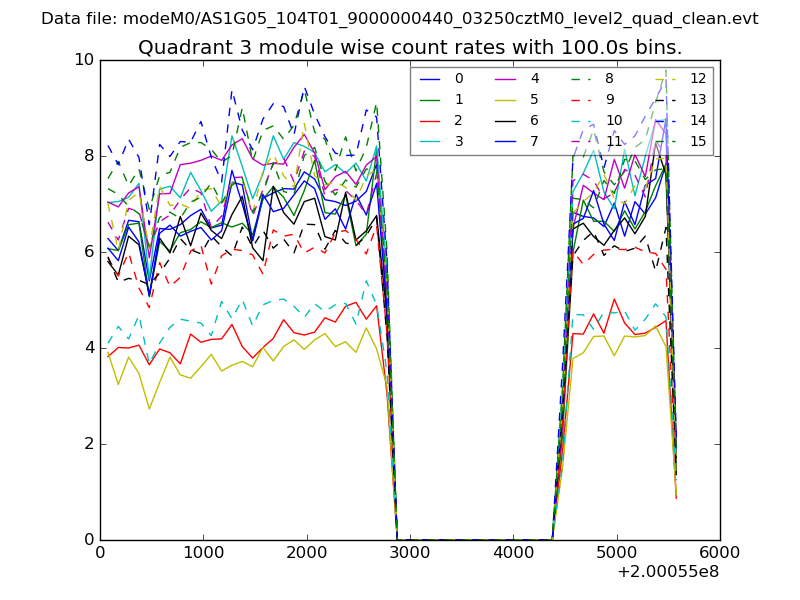
| Module-wise count rates for Quadrant C Data is divided into 100 sec bins |
 |
 |
| Module-wise count rates for Quadrant D Data is divided into 100 sec bins |
 |
 |
| Parameter | Plot |
|---|---|
| CZT HV Monitor | 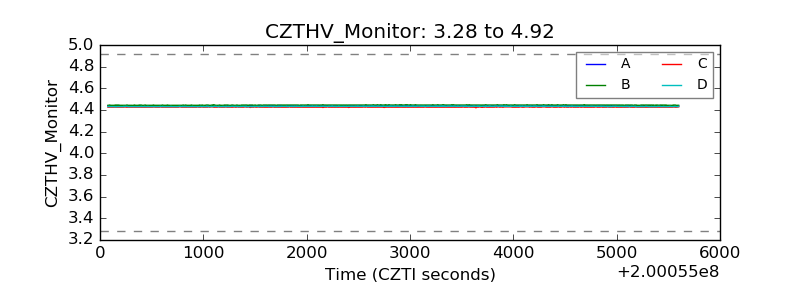 |
| D_VDD |  |
| Temperature 1 | 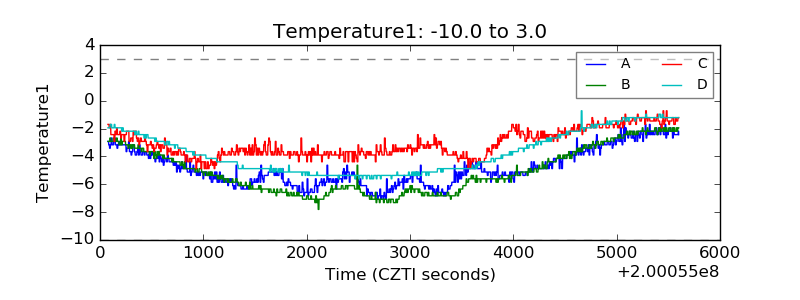 |
| Veto HV Monitor | 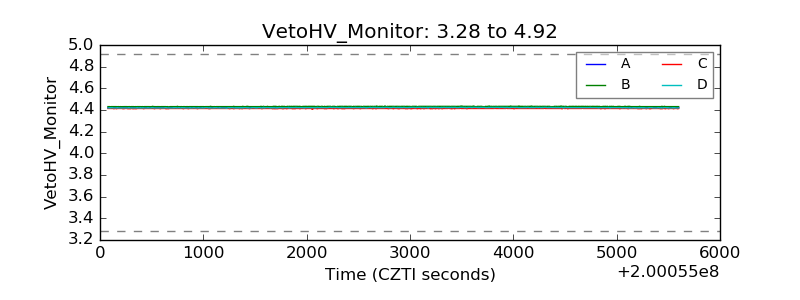 |
| Veto LLD | 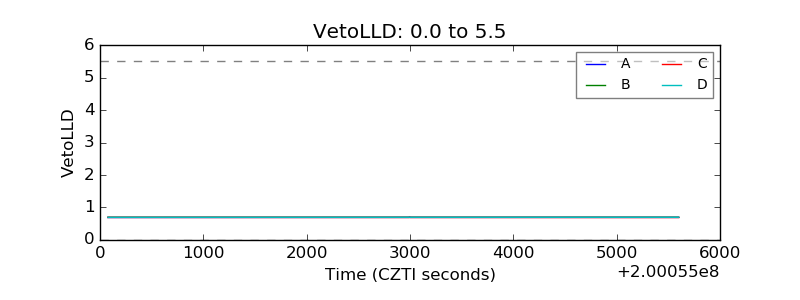 |
| Alpha Counter | 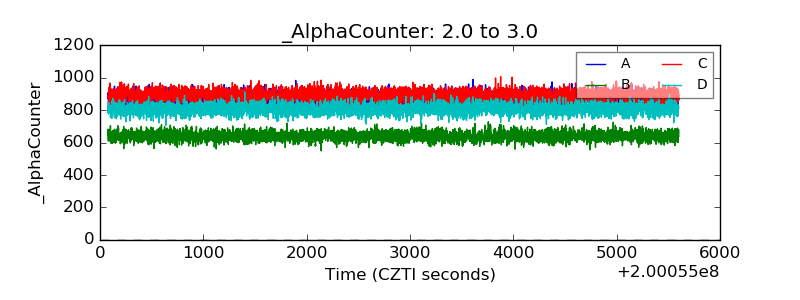 |
| _CPM_Rate | 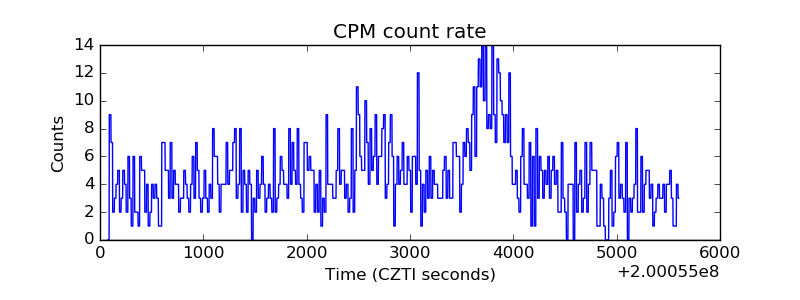 |
| CZT Counter | 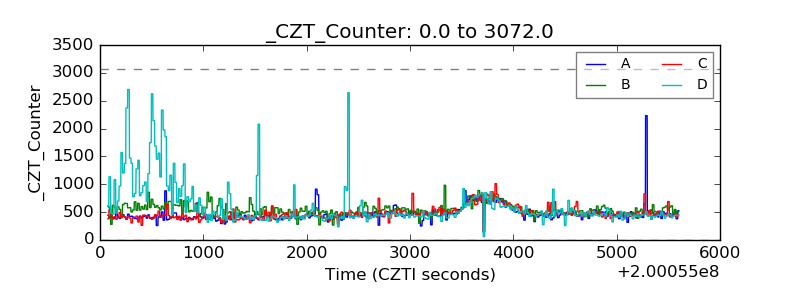 |
| +2.5 Volts monitor |  |
| +5 Volts monitor |  |
| Veto Counter | 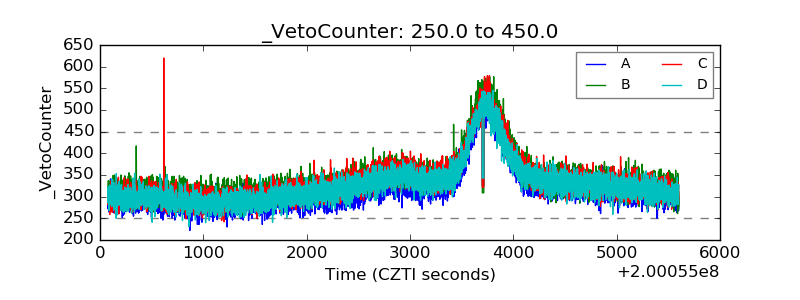 |