| Param | Original file | Final file |
|---|---|---|
| Filename | modeM0/AS1G05_104T01_9000000440_03251cztM0_level2.evt | modeM0/AS1G05_104T01_9000000440_03251cztM0_level2_quad_clean.evt |
| Size (bytes) | 1,652,558,400 | 290,767,680 |
| Size | 1.5 GB | 277.3 MB |
| Events in quadrant A | 10,405,884 | 1,853,394 |
| Events in quadrant B | 13,678,395 | 1,831,190 |
| Events in quadrant C | 11,484,160 | 1,804,869 |
| Events in quadrant D | 12,916,521 | 1,724,651 |
| Mode M0 | |||
|---|---|---|---|
| Quadrant | BADHDUFLAG | Total packets | Discarded packets |
| A | 0 | 47405 | 5 |
| B | 0 | 55882 | 4 |
| C | 0 | 50730 | 4 |
| D | 0 | 55131 | 4 |
| Mode SS | |||
|---|---|---|---|
| Quadrant | BADHDUFLAG | Total packets | Discarded packets |
| A | 0 | 472 | 0 |
| B | 0 | 472 | 0 |
| C | 0 | 472 | 0 |
| D | 0 | 472 | 0 |
| Mode M9 | |||
|---|---|---|---|
| Quadrant | BADHDUFLAG | Total packets | Discarded packets |
| A | 0 | 23 | 0 |
| B | 0 | 23 | 0 |
| C | 0 | 23 | 0 |
| D | 0 | 23 | 0 |
| Quadrant | Total seconds | Saturated seconds | Saturation percentage |
|---|---|---|---|
| A | 23139 | 265 | 1.145253% |
| B | 23139 | 301 | 1.300834% |
| C | 23139 | 345 | 1.490989% |
| D | 23139 | 459 | 1.983664% |
Noise dominated data is calculated using 1-second bins in cleaned event files. If a bin has >2000 counts, and if more than 50% of those come from <1% of pixels, then it is considered to be noise-dominated and hence unusable.
| Quadrant | # 1 sec bins | Bins with >0 counts | Bins with >2000 counts | High rate bins dominated by noise | Noise dominated (total time) | Noise dominated (detector-on time) | Marked lightcurve |
|---|---|---|---|---|---|---|---|
| A | 25484 | 23144 | 30 | 30 | 0.12% | 0.13% | 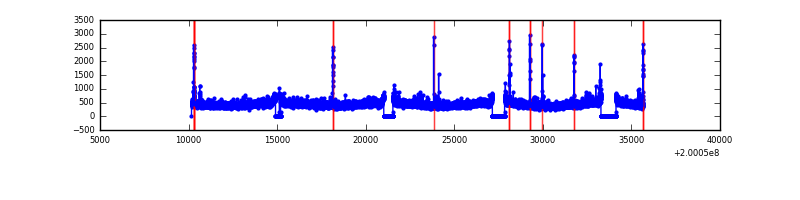 |
| B | 25484 | 23144 | 16 | 16 | 0.06% | 0.07% | 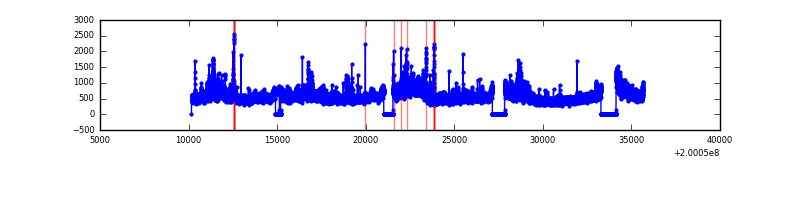 |
| C | 25484 | 23144 | 141 | 141 | 0.55% | 0.61% | 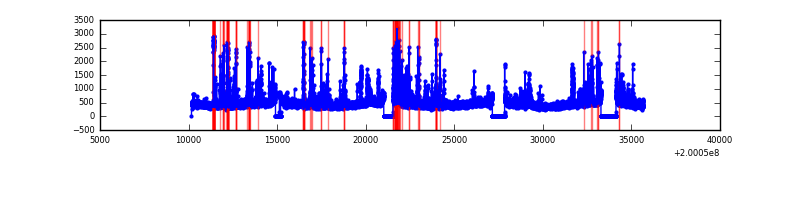 |
| D | 25484 | 23144 | 325 | 325 | 1.28% | 1.40% | 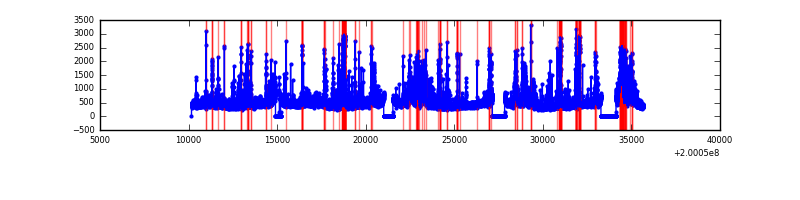 |
Top three noisy pixels from each quadrant. If the there are fewer than three noisy pixels in the level2.evt file, extra rows are filled as -1
| Pixel properties | Quadrant properties | ||||||
|---|---|---|---|---|---|---|---|
| Quadrant | DetID | PixID | Counts | Sigma | Mean | Median | Sigma |
| A | 0 | 118 | 131436 | 239.69 | 2631 | 2578 | 537.6 |
| A | 0 | 50 | 66620 | 119.12 | 2631 | 2578 | 537.6 |
| A | 3 | 1 | 47229 | 83.06 | 2631 | 2578 | 537.6 |
| B | 15 | 204 | 3121454 | 6013.07 | 2676 | 2615 | 518.7 |
| B | 5 | 200 | 76612 | 142.66 | 2676 | 2615 | 518.7 |
| B | 0 | 229 | 71596 | 132.99 | 2676 | 2615 | 518.7 |
| C | 14 | 223 | 965943 | 1628.32 | 2540 | 2557 | 591.6 |
| C | 12 | 175 | 251709 | 421.12 | 2540 | 2557 | 591.6 |
| C | 1 | 192 | 177069 | 294.96 | 2540 | 2557 | 591.6 |
| D | 13 | 114 | 2106499 | 3439.38 | 2516 | 2443 | 611.8 |
| D | 12 | 233 | 467963 | 760.96 | 2516 | 2443 | 611.8 |
| D | 13 | 223 | 392686 | 637.91 | 2516 | 2443 | 611.8 |
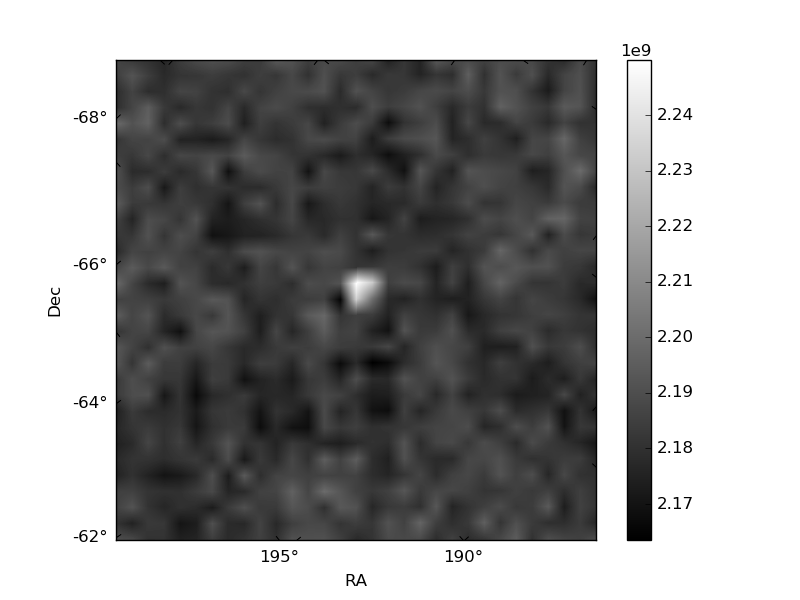
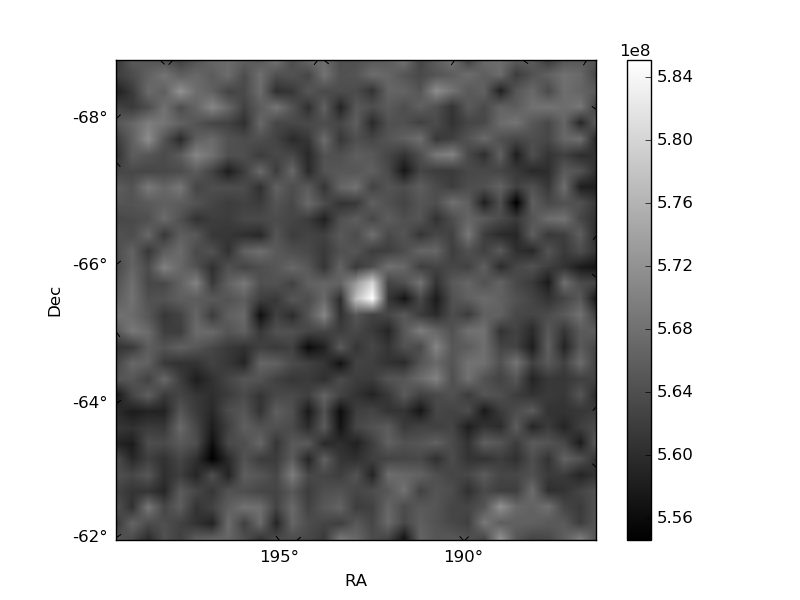
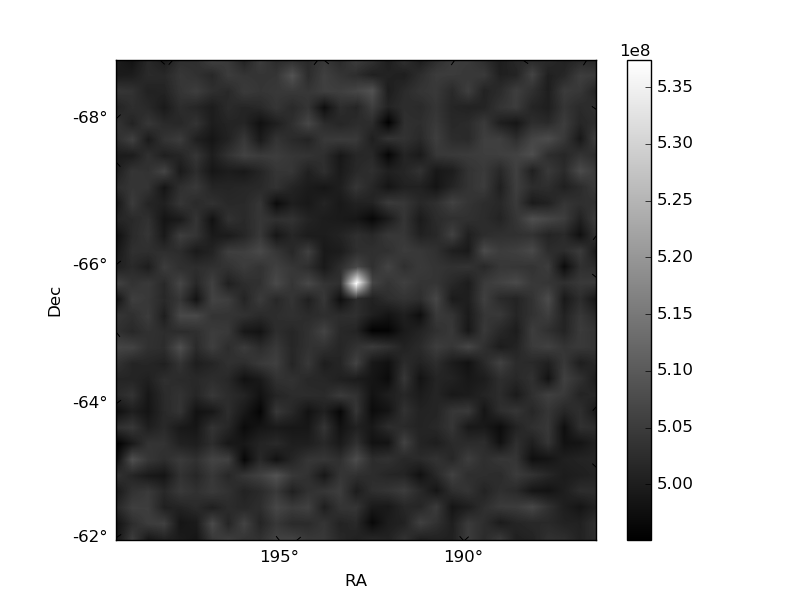
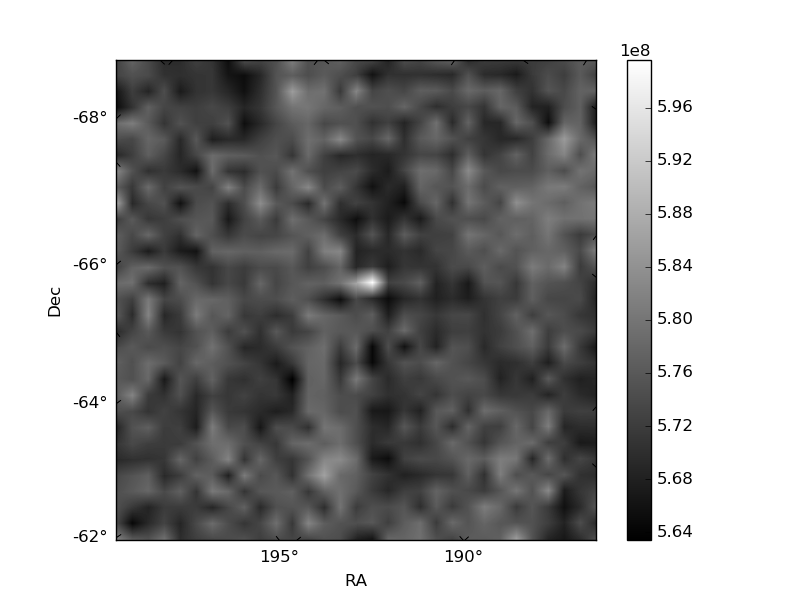
Histogram calculated using DETX and DETY for each event in the final _common_clean file
| Quadrant A | 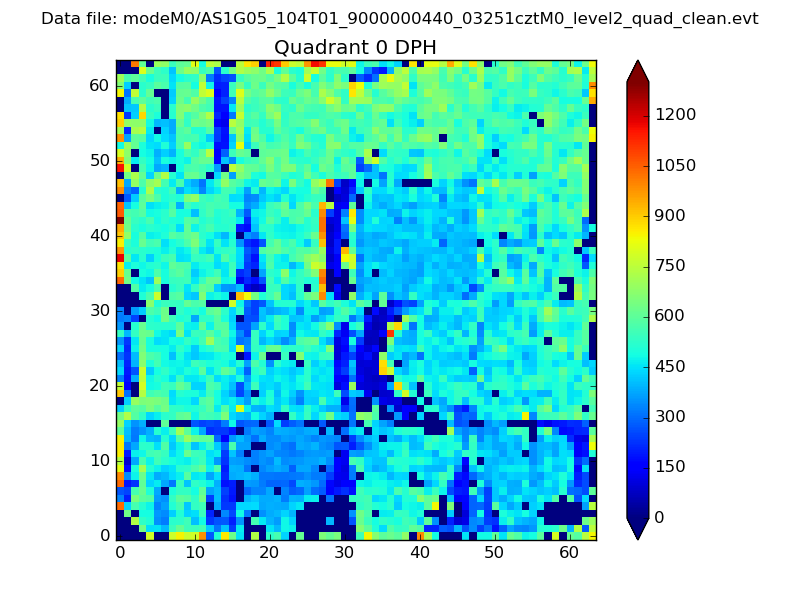 |
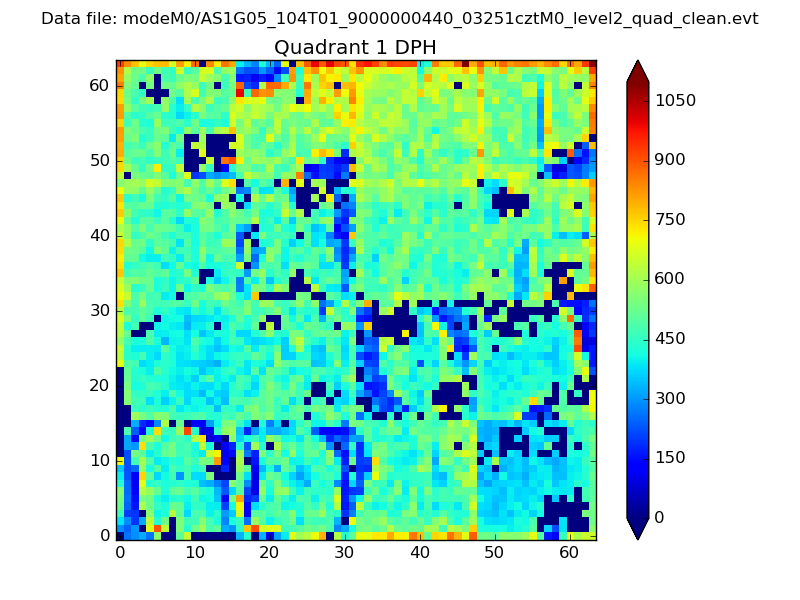 |
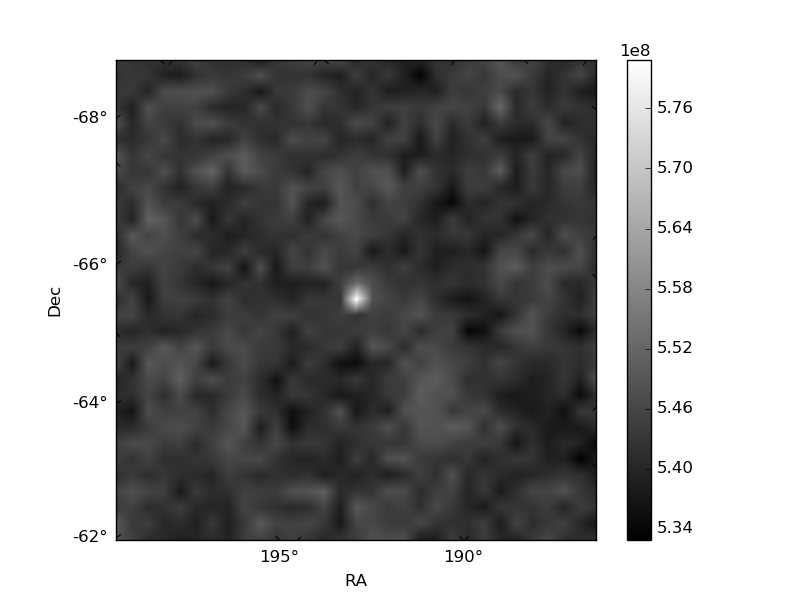
Quadrant B |
|---|---|---|---|
| Quadrant D | 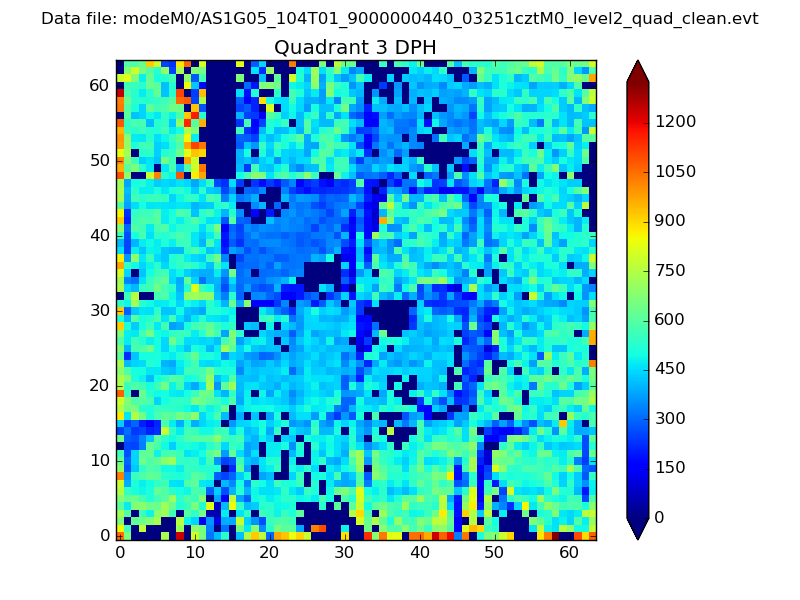 |
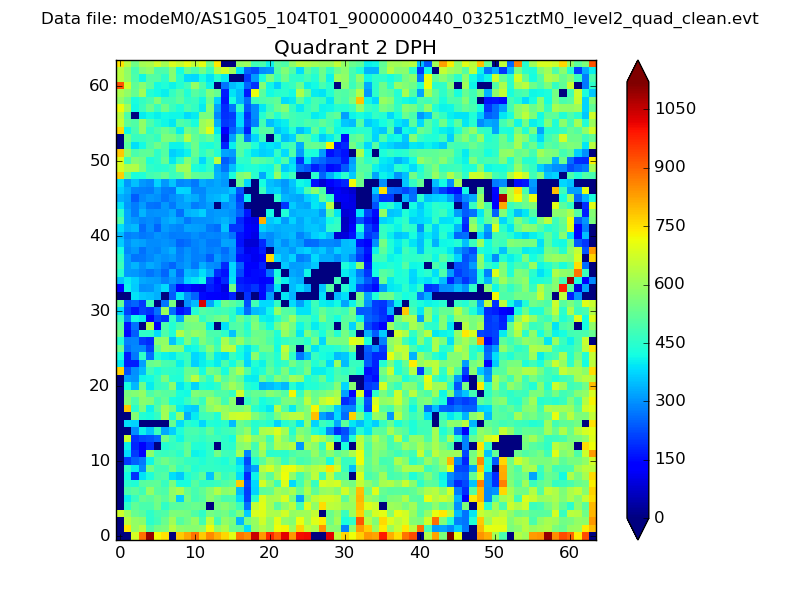 |
Quadrant C |
| Plot type | Count rate plots | Images |
|---|---|---|
| Comparison with Poisson distribution Blue bars denote a histogram of data divided into 1 sec bins. Red curve is a Poisson curve with rate = median count rate of data. |
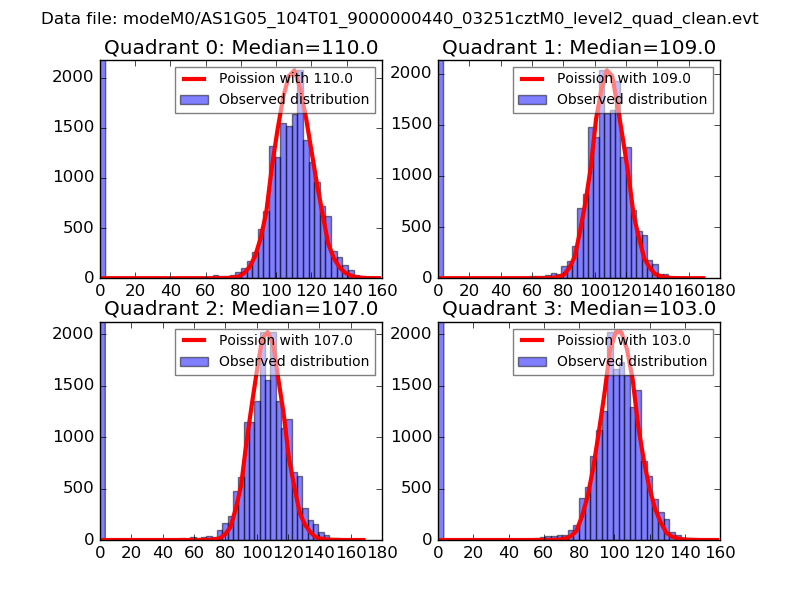 |
 |
| Quadrant-wise count rates Data is divided into 100 sec bins |
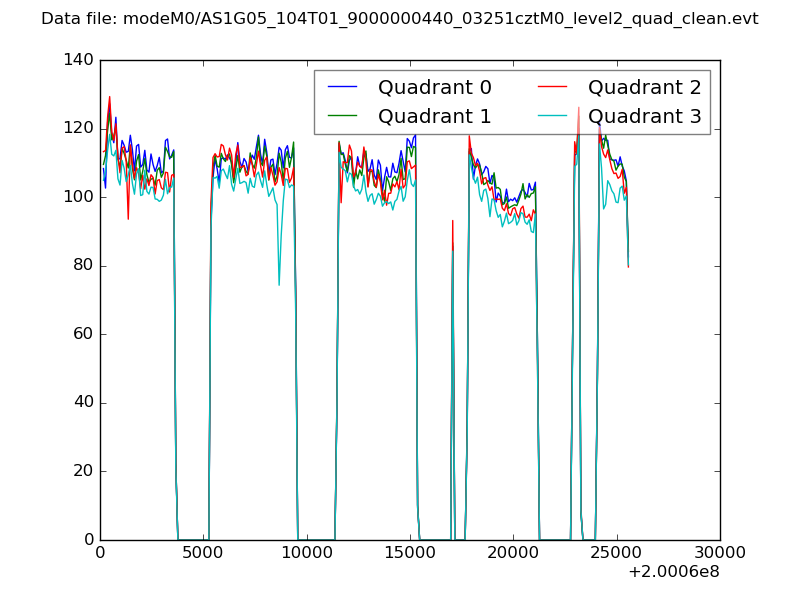 |
|
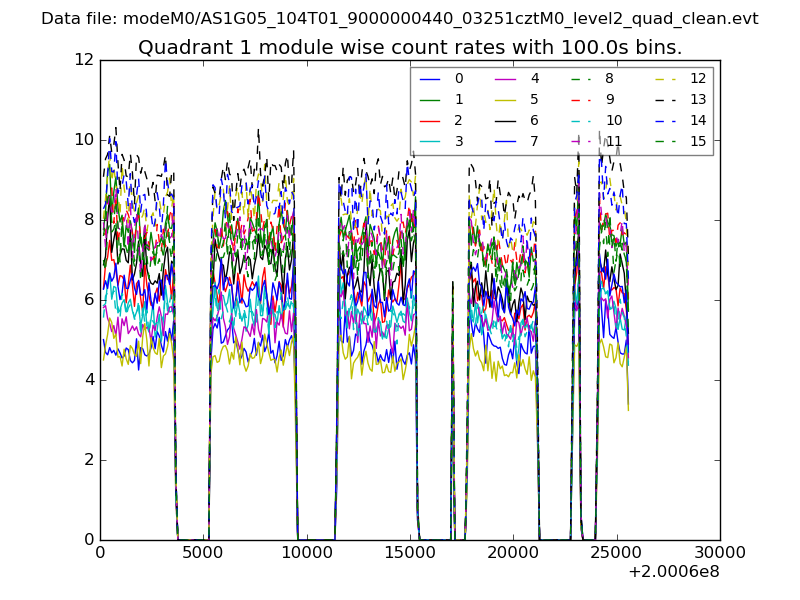
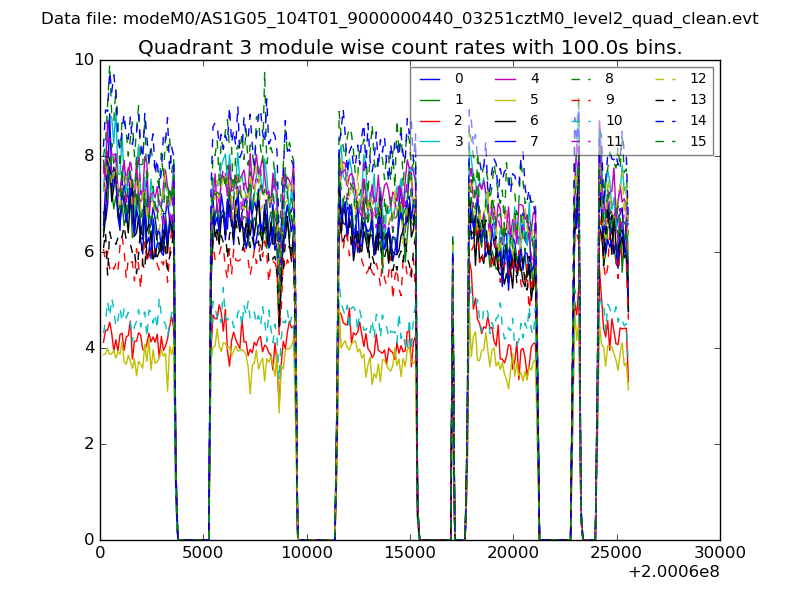
| Module-wise count rates for Quadrant A Data is divided into 100 sec bins |
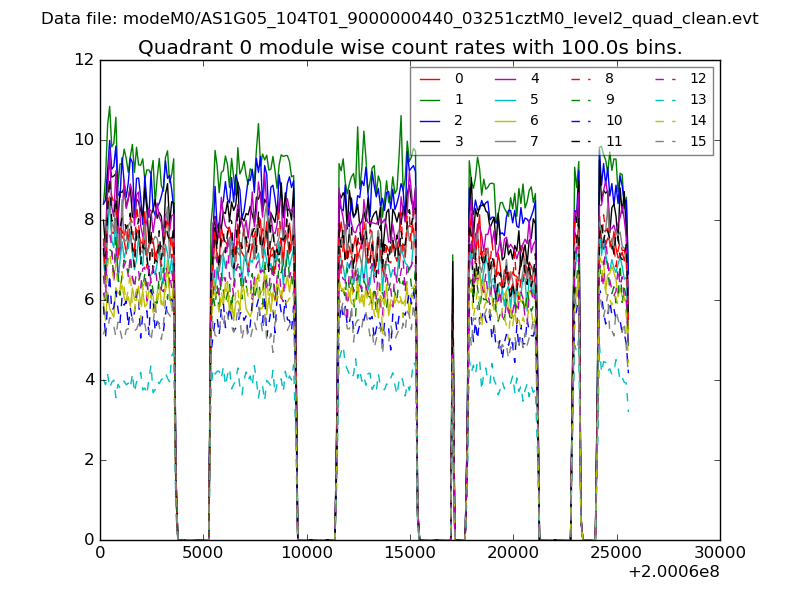 |
 |
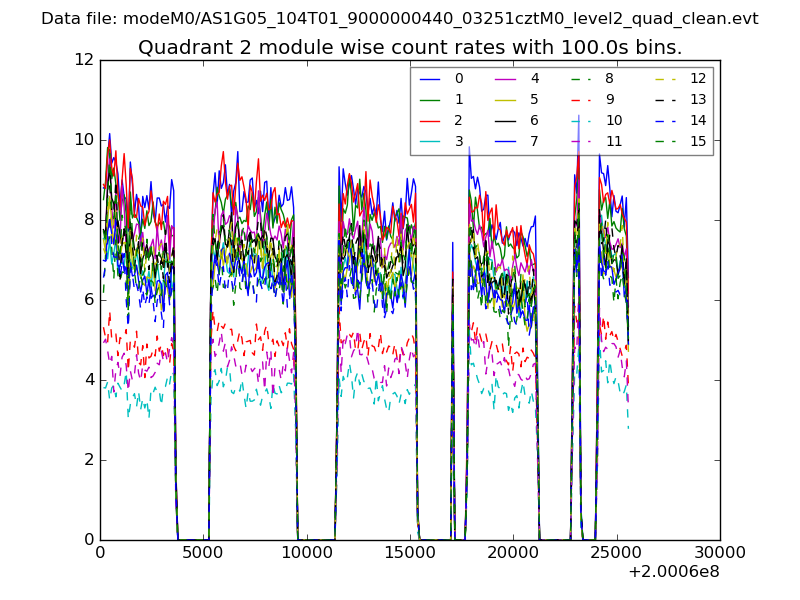
| Module-wise count rates for Quadrant B Data is divided into 100 sec bins |
 |
 |
| Module-wise count rates for Quadrant C Data is divided into 100 sec bins |
 |
 |
| Module-wise count rates for Quadrant D Data is divided into 100 sec bins |
 |
 |
| Parameter | Plot |
|---|---|
| CZT HV Monitor | 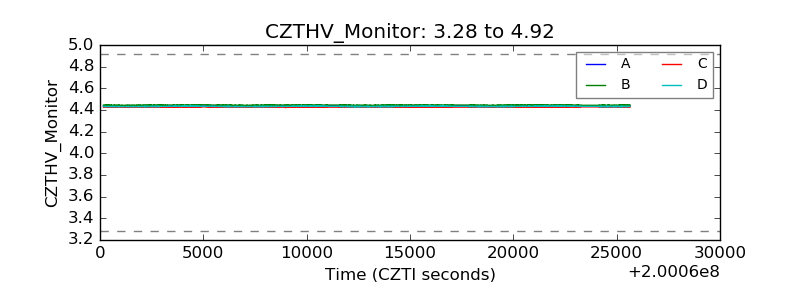 |
| D_VDD | 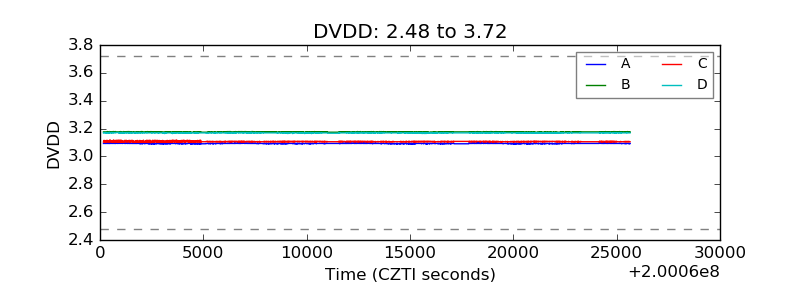 |
| Temperature 1 | 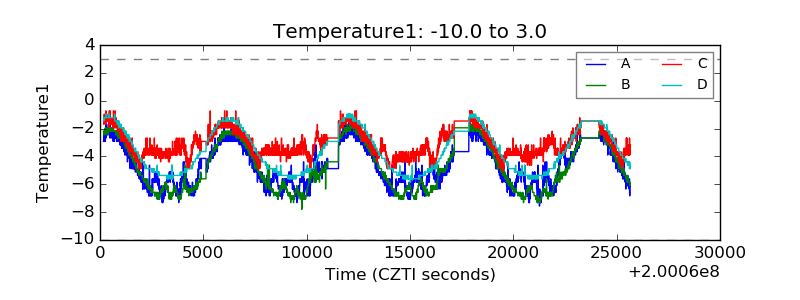 |
| Veto HV Monitor | 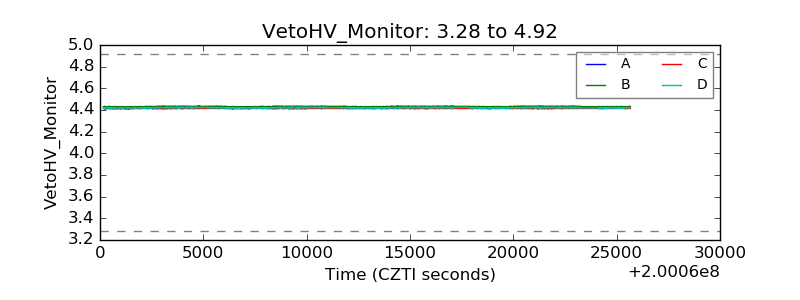 |
| Veto LLD | 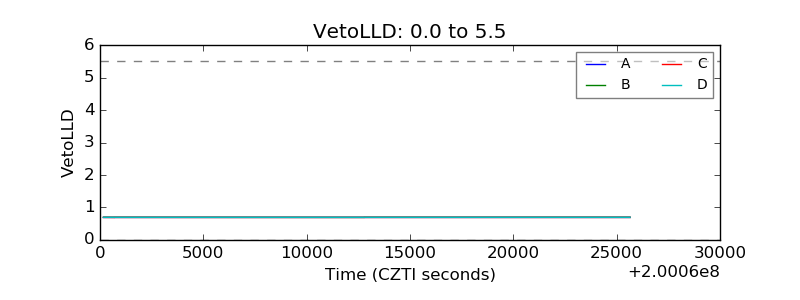 |
| Alpha Counter | 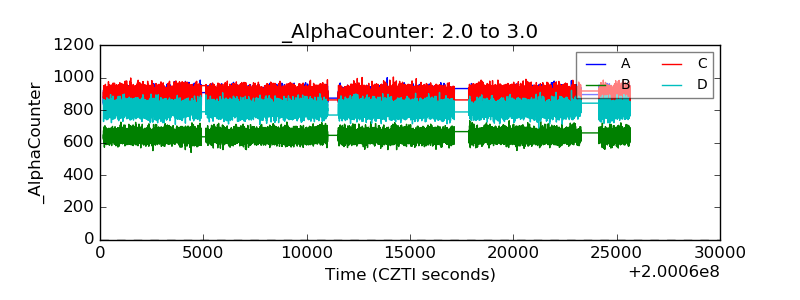 |
| _CPM_Rate | 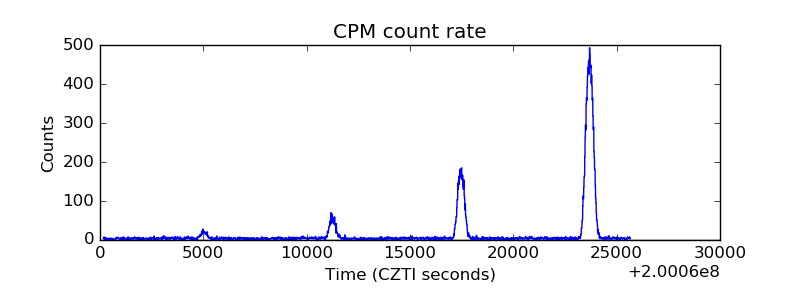 |
| CZT Counter | 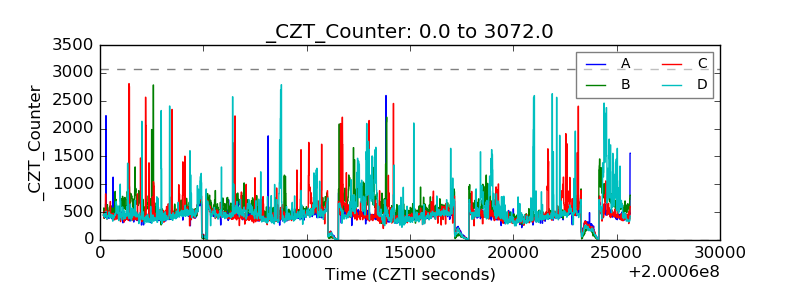 |
| +2.5 Volts monitor |  |
| +5 Volts monitor | 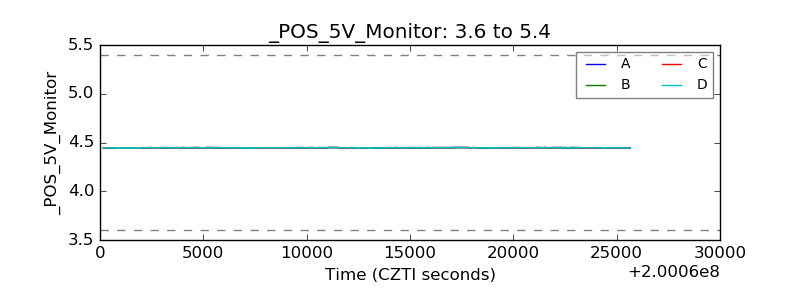 |
| _ROLL_ROT | 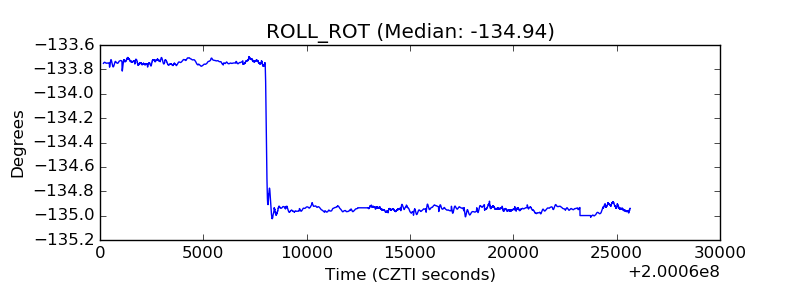 |
| _Roll_DEC | 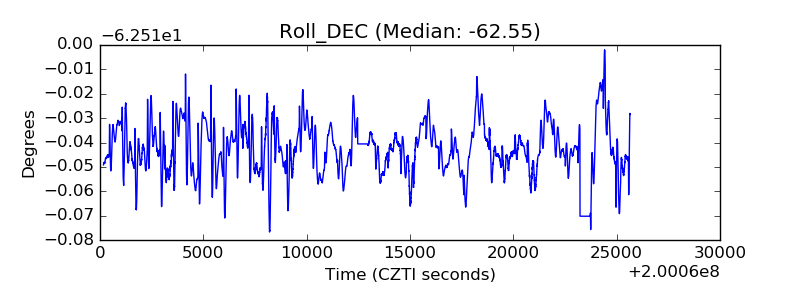 |
| _Roll_RA | 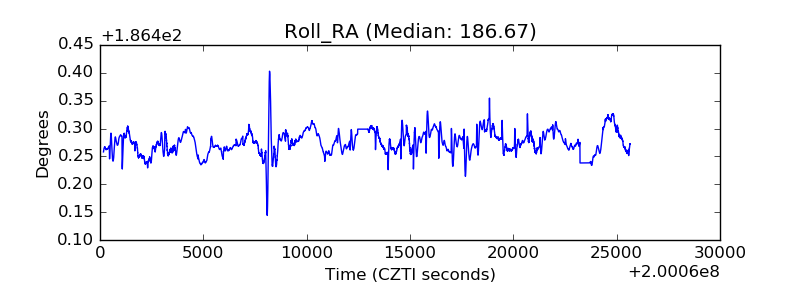 |
| Veto Counter | 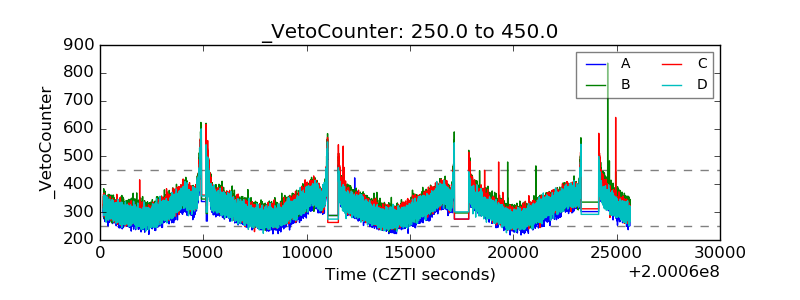 |