| Param | Original file | Final file |
|---|---|---|
| Filename | modeM0/AS1G05_104T01_9000000440_03252cztM0_level2.evt | modeM0/AS1G05_104T01_9000000440_03252cztM0_level2_quad_clean.evt |
| Size (bytes) | 489,084,480 | 84,882,240 |
| Size | 466.4 MB | 81.0 MB |
| Events in quadrant A | 2,947,134 | 543,470 |
| Events in quadrant B | 4,259,801 | 540,487 |
| Events in quadrant C | 3,180,591 | 525,958 |
| Events in quadrant D | 3,980,293 | 504,186 |
| Mode M0 | |||
|---|---|---|---|
| Quadrant | BADHDUFLAG | Total packets | Discarded packets |
| A | 0 | 13438 | 3 |
| B | 0 | 17159 | 2 |
| C | 0 | 14117 | 2 |
| D | 0 | 16850 | 2 |
| Mode SS | |||
|---|---|---|---|
| Quadrant | BADHDUFLAG | Total packets | Discarded packets |
| A | 0 | 132 | 0 |
| B | 0 | 132 | 0 |
| C | 0 | 132 | 0 |
| D | 0 | 132 | 0 |
| Mode M9 | |||
|---|---|---|---|
| Quadrant | BADHDUFLAG | Total packets | Discarded packets |
| A | 0 | 13 | 0 |
| B | 0 | 13 | 0 |
| C | 0 | 13 | 0 |
| D | 0 | 14 | 0 |
| Quadrant | Total seconds | Saturated seconds | Saturation percentage |
|---|---|---|---|
| A | 6545 | 18 | 0.275019% |
| B | 6545 | 51 | 0.779221% |
| C | 6545 | 43 | 0.656990% |
| D | 6545 | 227 | 3.468296% |
Noise dominated data is calculated using 1-second bins in cleaned event files. If a bin has >2000 counts, and if more than 50% of those come from <1% of pixels, then it is considered to be noise-dominated and hence unusable.
| Quadrant | # 1 sec bins | Bins with >0 counts | Bins with >2000 counts | High rate bins dominated by noise | Noise dominated (total time) | Noise dominated (detector-on time) | Marked lightcurve |
|---|---|---|---|---|---|---|---|
| A | 7570 | 6546 | 9 | 9 | 0.12% | 0.14% |  |
| B | 7570 | 6546 | 2 | 2 | 0.03% | 0.03% | 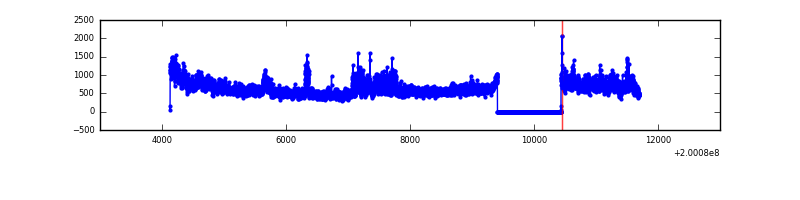 |
| C | 7570 | 6546 | 18 | 18 | 0.24% | 0.27% | 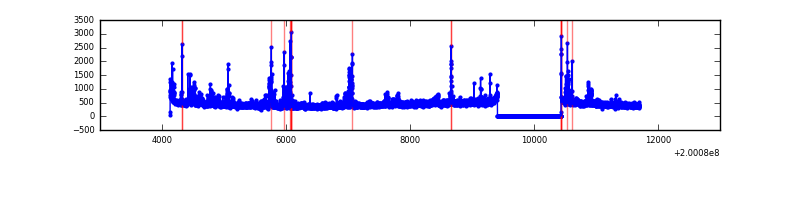 |
| D | 7570 | 6546 | 236 | 236 | 3.12% | 3.61% |  |
Top three noisy pixels from each quadrant. If the there are fewer than three noisy pixels in the level2.evt file, extra rows are filled as -1
| Pixel properties | Quadrant properties | ||||||
|---|---|---|---|---|---|---|---|
| Quadrant | DetID | PixID | Counts | Sigma | Mean | Median | Sigma |
| A | 0 | 118 | 52910 | 338.52 | 743 | 731 | 154.1 |
| A | 0 | 50 | 22267 | 139.72 | 743 | 731 | 154.1 |
| A | 0 | 226 | 12653 | 77.35 | 743 | 731 | 154.1 |
| B | 15 | 204 | 1291794 | 8742.23 | 760 | 743 | 147.7 |
| B | 0 | 229 | 19730 | 128.57 | 760 | 743 | 147.7 |
| B | 5 | 200 | 12288 | 78.18 | 760 | 743 | 147.7 |
| C | 14 | 223 | 210931 | 1249.37 | 717 | 722 | 168.3 |
| C | 6 | 80 | 109184 | 644.64 | 717 | 722 | 168.3 |
| C | 12 | 175 | 33179 | 192.91 | 717 | 722 | 168.3 |
| D | 13 | 114 | 774713 | 4477.54 | 703 | 681 | 172.9 |
| D | 13 | 223 | 465046 | 2686.21 | 703 | 681 | 172.9 |
| D | 9 | 85 | 48967 | 279.32 | 703 | 681 | 172.9 |
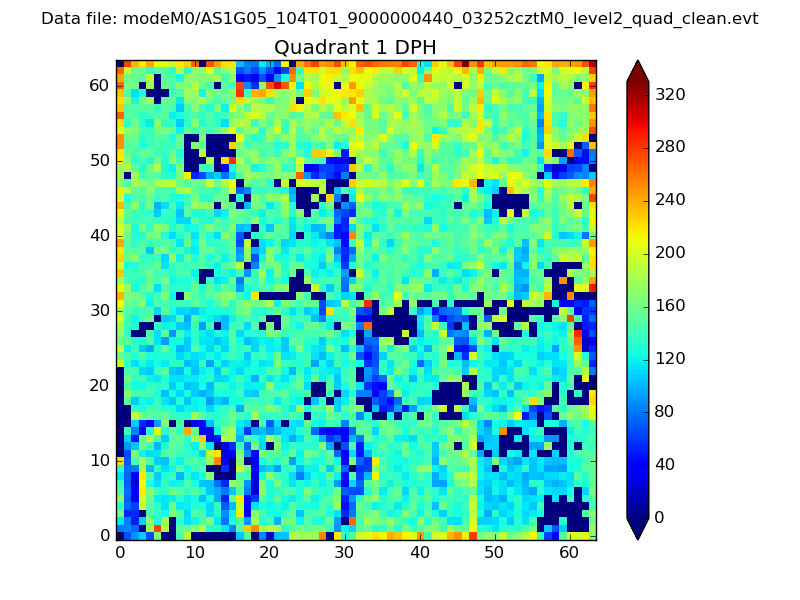
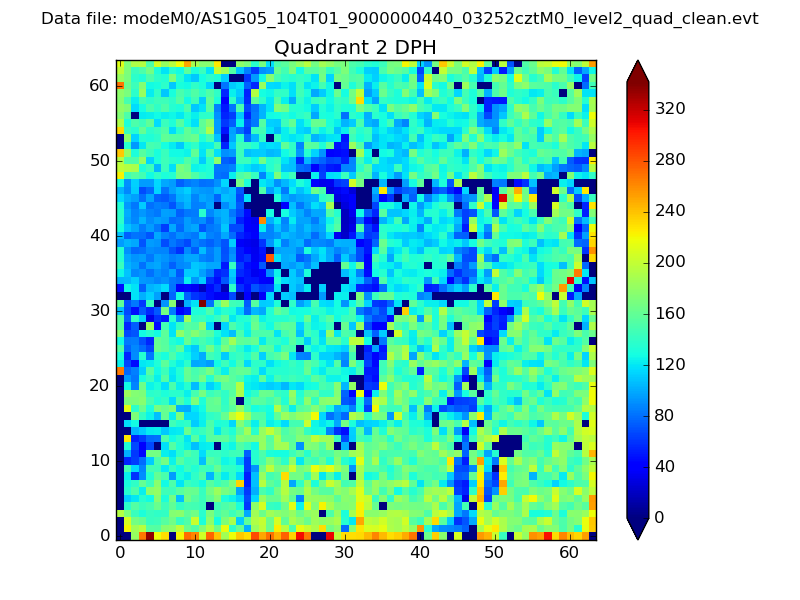
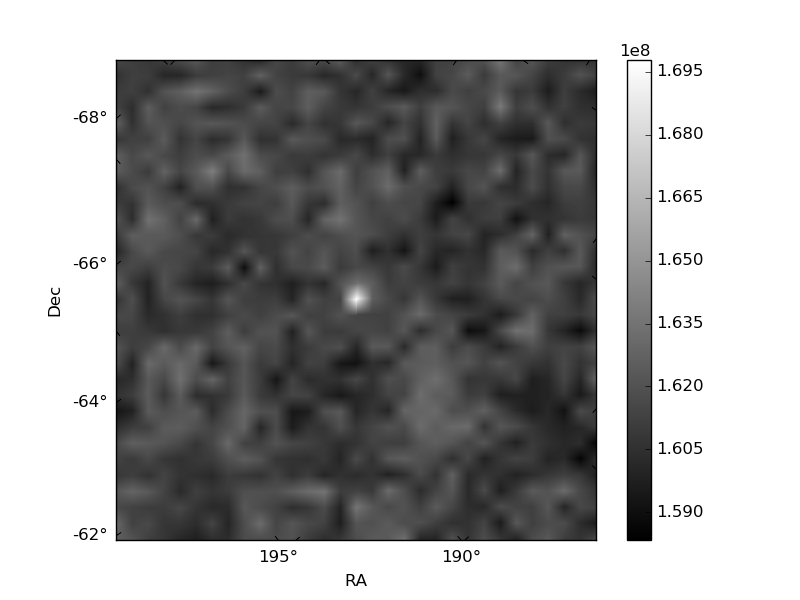
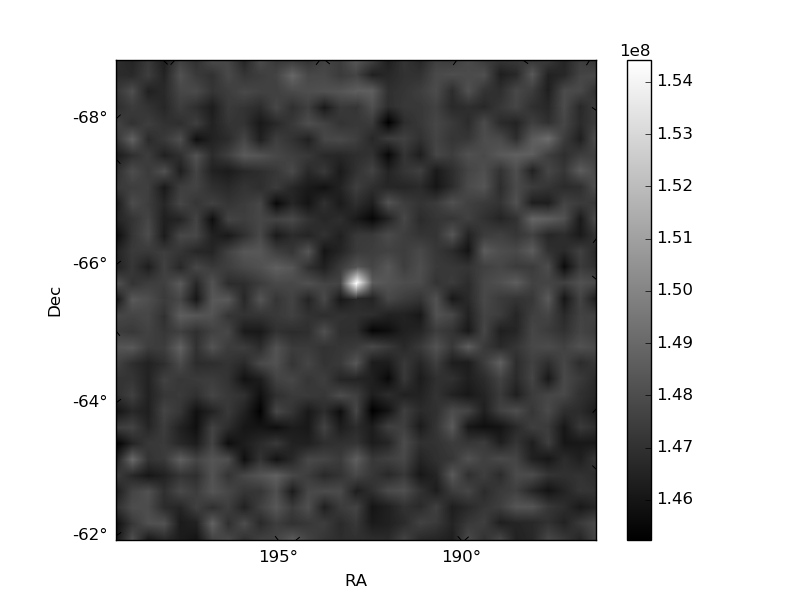
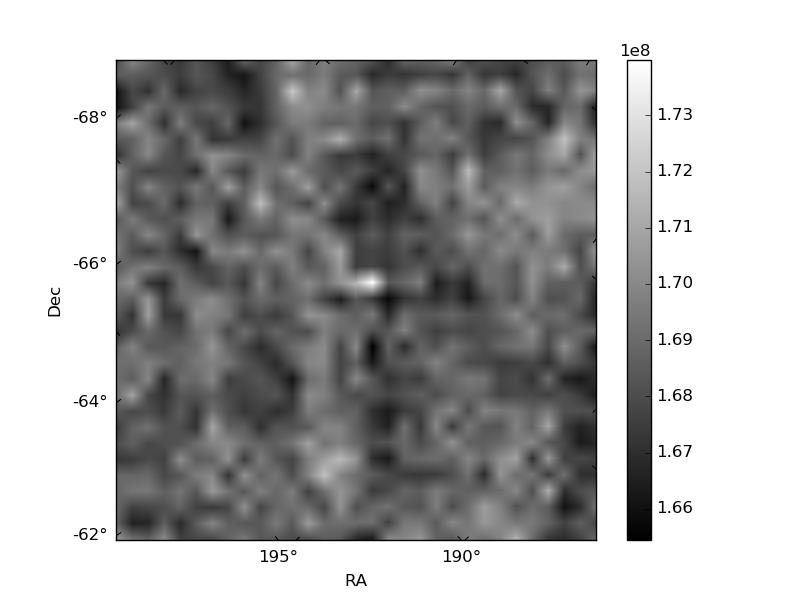
Histogram calculated using DETX and DETY for each event in the final _common_clean file
| Quadrant A | 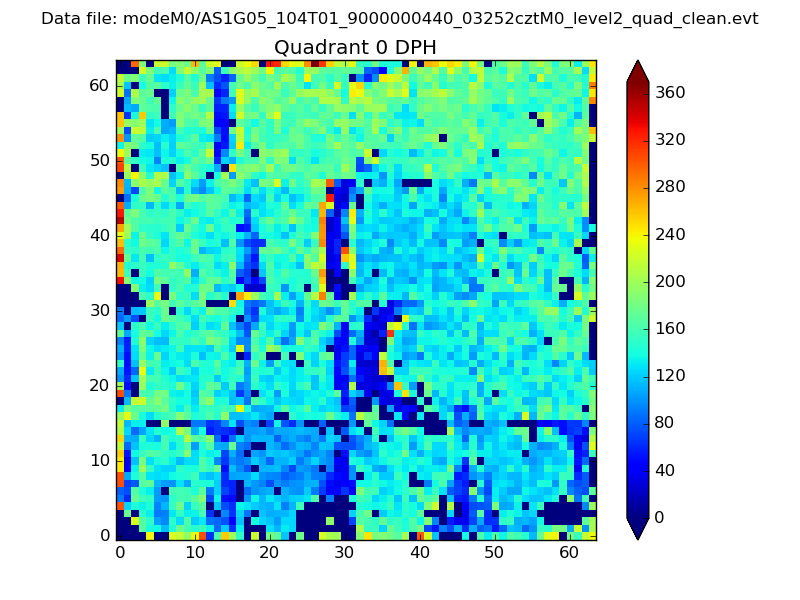 |
 |
Quadrant B |
|---|---|---|---|
| Quadrant D | 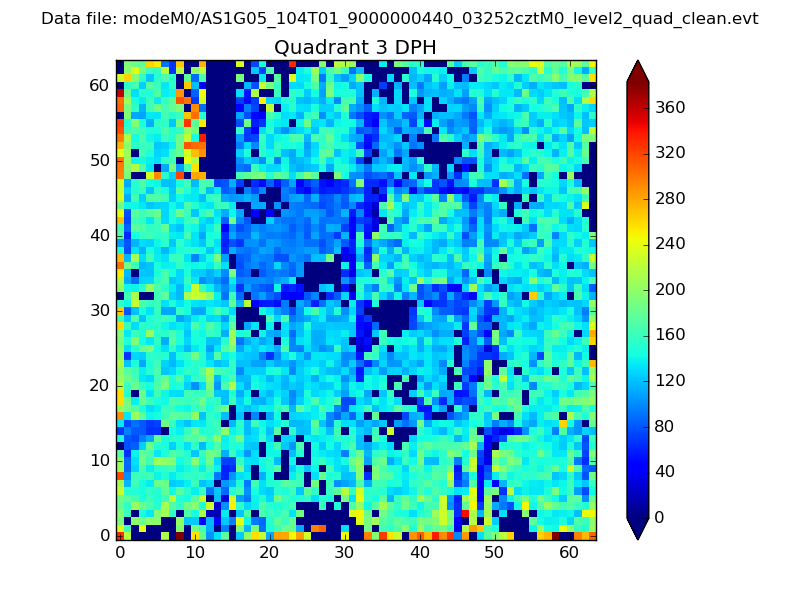 |
 |
Quadrant C |
| Plot type | Count rate plots | Images |
|---|---|---|
| Comparison with Poisson distribution Blue bars denote a histogram of data divided into 1 sec bins. Red curve is a Poisson curve with rate = median count rate of data. |
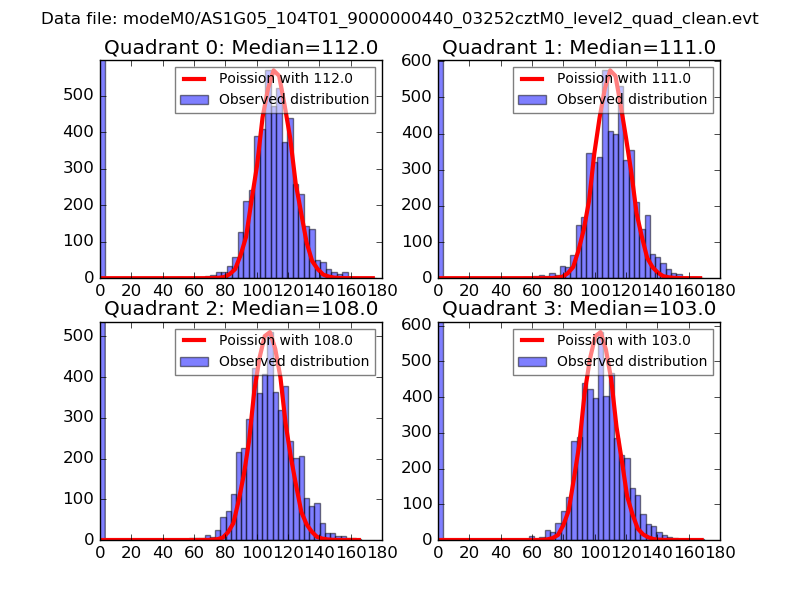 |
 |
| Quadrant-wise count rates Data is divided into 100 sec bins |
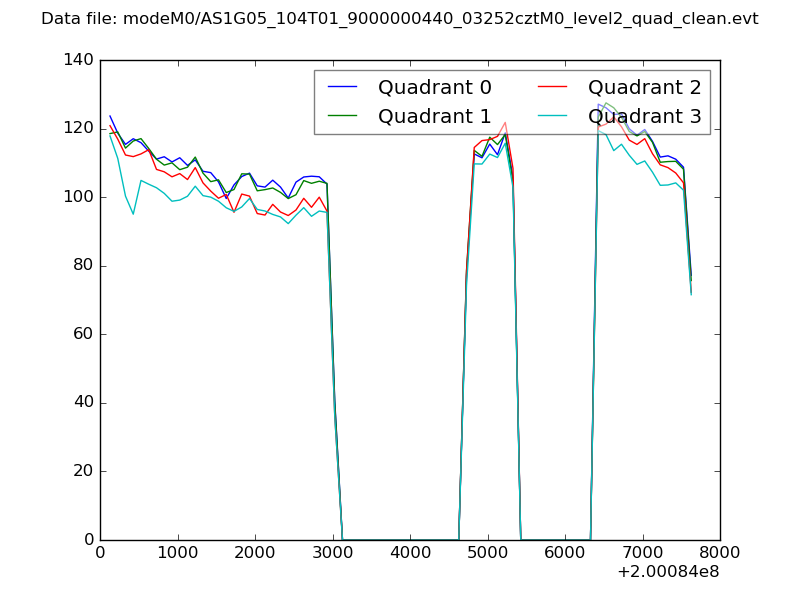 |
|
| Module-wise count rates for Quadrant A Data is divided into 100 sec bins |
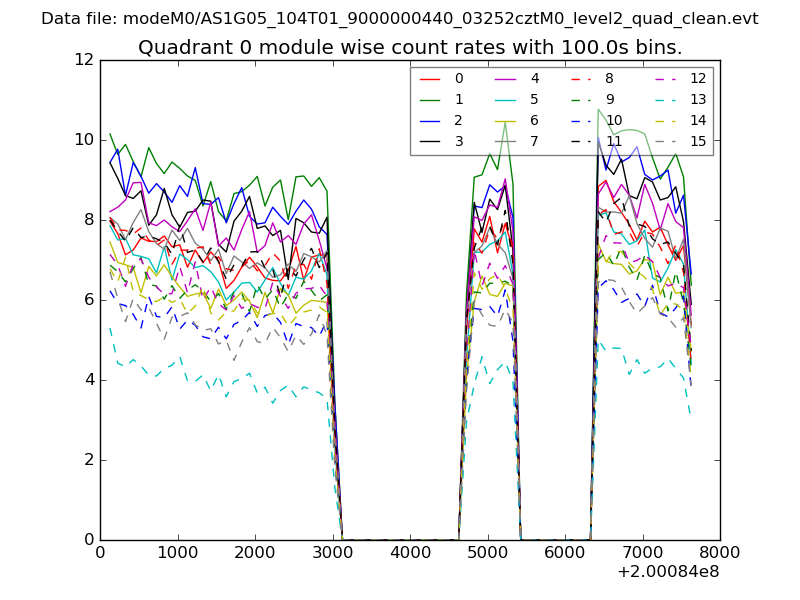 |
 |
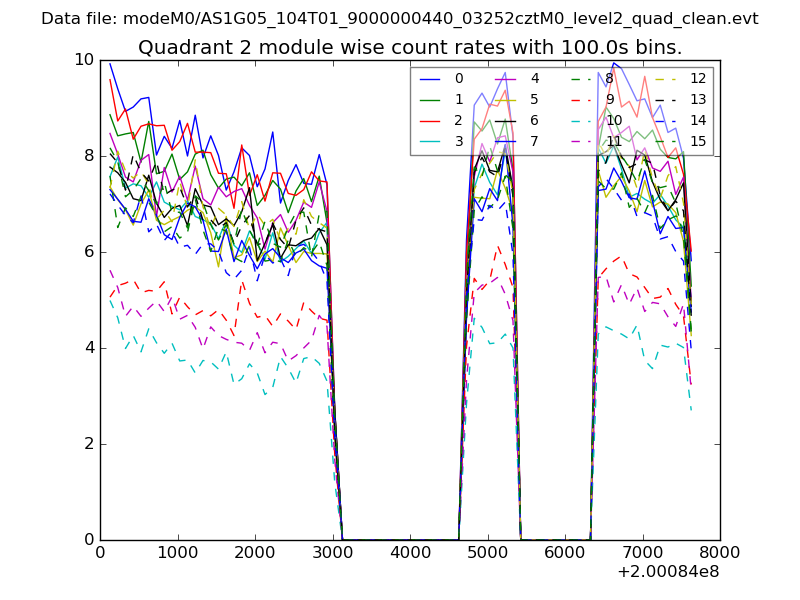
| Module-wise count rates for Quadrant B Data is divided into 100 sec bins |
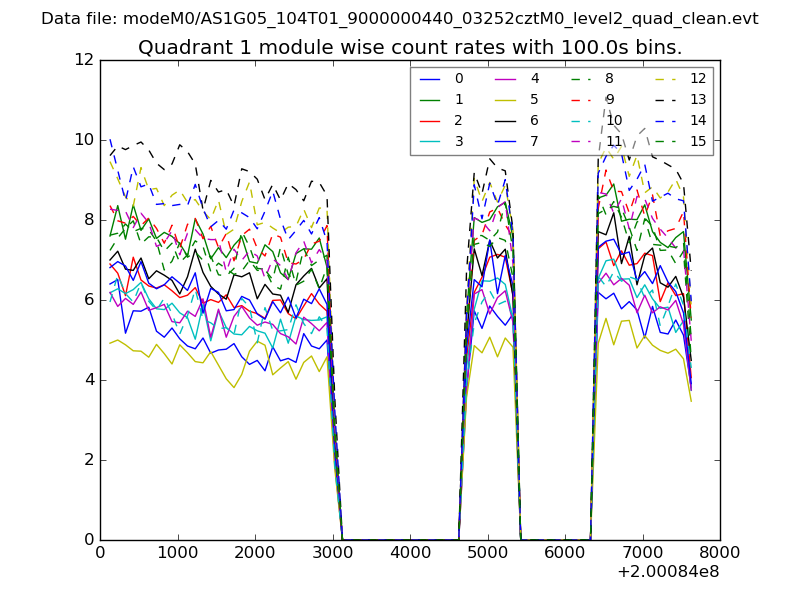 |
 |
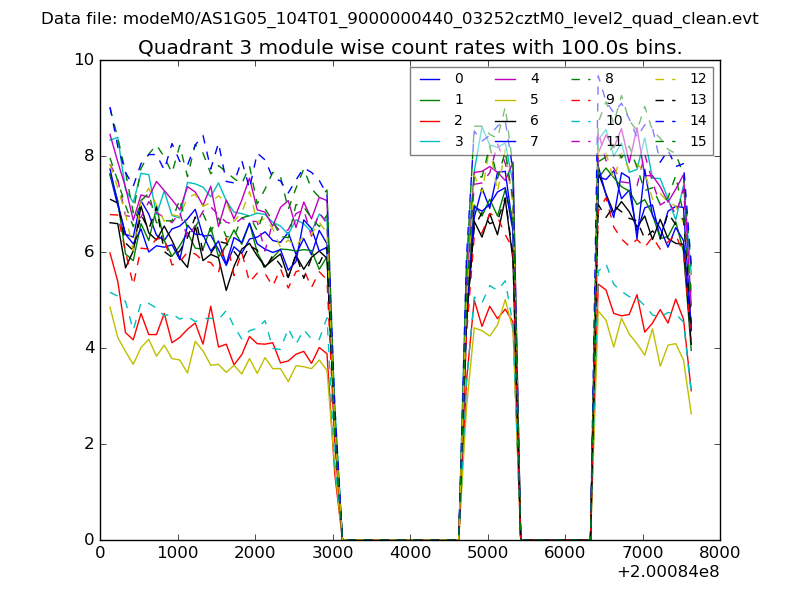
| Module-wise count rates for Quadrant C Data is divided into 100 sec bins |
 |
 |
| Module-wise count rates for Quadrant D Data is divided into 100 sec bins |
 |
 |
| Parameter | Plot |
|---|---|
| CZT HV Monitor | 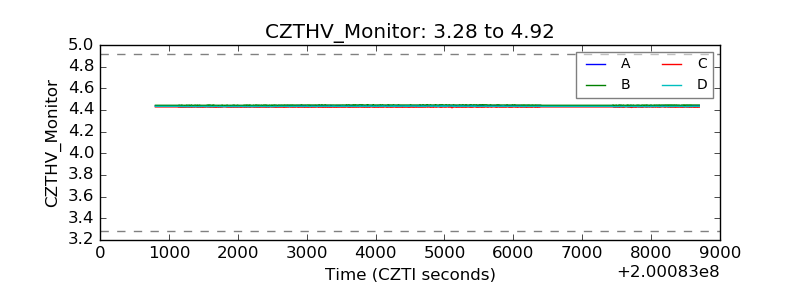 |
| D_VDD | 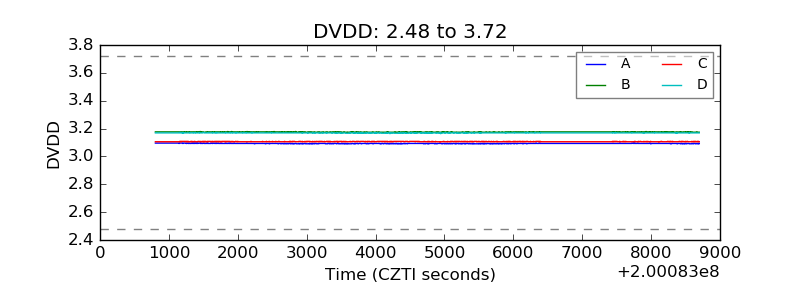 |
| Temperature 1 |  |
| Veto HV Monitor | 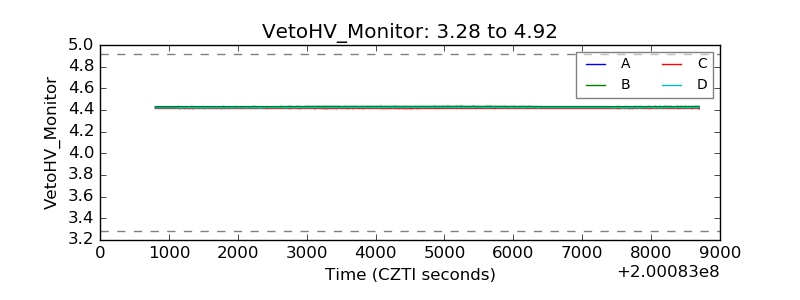 |
| Veto LLD |  |
| Alpha Counter | 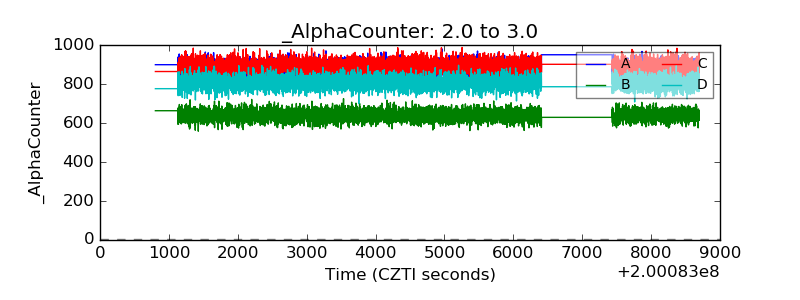 |
| _CPM_Rate | 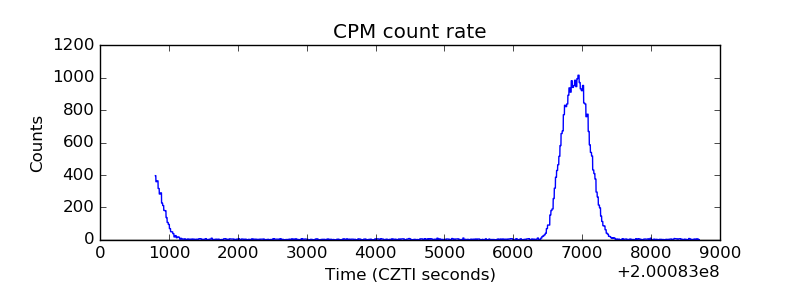 |
| CZT Counter | 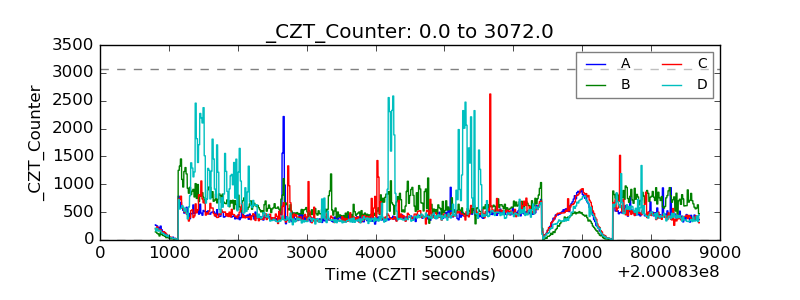 |
| +2.5 Volts monitor |  |
| +5 Volts monitor |  |
| _ROLL_ROT | 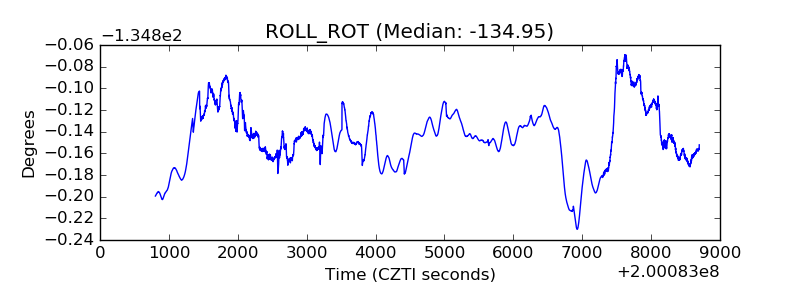 |
| _Roll_DEC | 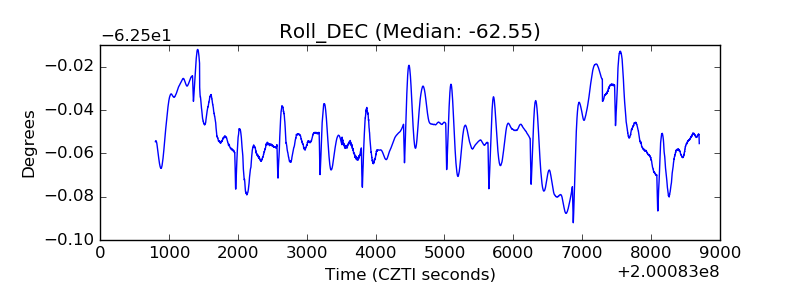 |
| _Roll_RA | 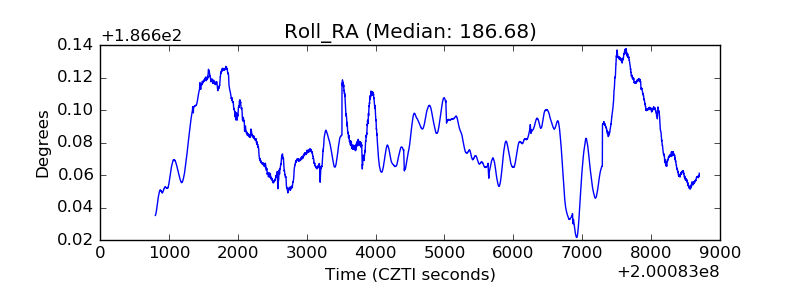 |
| Veto Counter | 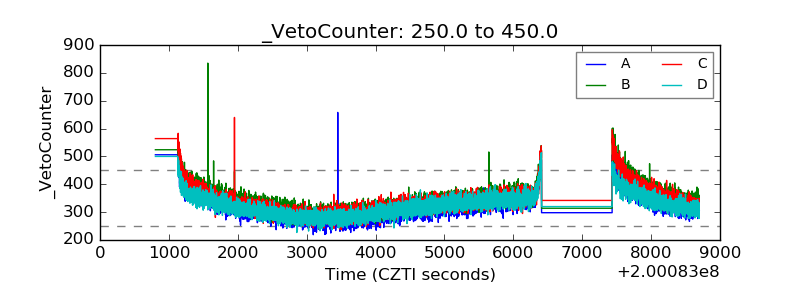 |