| Param | Original file | Final file |
|---|---|---|
| Filename | modeM0/AS1G05_104T01_9000000440_03254cztM0_level2.evt | modeM0/AS1G05_104T01_9000000440_03254cztM0_level2_quad_clean.evt |
| Size (bytes) | 443,073,600 | 87,143,040 |
| Size | 422.5 MB | 83.1 MB |
| Events in quadrant A | 2,935,589 | 559,527 |
| Events in quadrant B | 3,801,092 | 558,058 |
| Events in quadrant C | 3,169,992 | 546,108 |
| Events in quadrant D | 3,070,244 | 521,981 |
| Mode M0 | |||
|---|---|---|---|
| Quadrant | BADHDUFLAG | Total packets | Discarded packets |
| A | 0 | 13383 | 3 |
| B | 0 | 15766 | 2 |
| C | 0 | 14155 | 2 |
| D | 0 | 14101 | 2 |
| Mode SS | |||
|---|---|---|---|
| Quadrant | BADHDUFLAG | Total packets | Discarded packets |
| A | 0 | 132 | 0 |
| B | 0 | 132 | 0 |
| C | 0 | 132 | 0 |
| D | 0 | 132 | 0 |
| Mode M9 | |||
|---|---|---|---|
| Quadrant | BADHDUFLAG | Total packets | Discarded packets |
| A | 0 | 19 | 0 |
| B | 0 | 19 | 0 |
| C | 0 | 19 | 0 |
| D | 0 | 20 | 0 |
| Quadrant | Total seconds | Saturated seconds | Saturation percentage |
|---|---|---|---|
| A | 6497 | 14 | 0.215484% |
| B | 6497 | 55 | 0.846545% |
| C | 6497 | 18 | 0.277051% |
| D | 6497 | 58 | 0.892720% |
Noise dominated data is calculated using 1-second bins in cleaned event files. If a bin has >2000 counts, and if more than 50% of those come from <1% of pixels, then it is considered to be noise-dominated and hence unusable.
| Quadrant | # 1 sec bins | Bins with >0 counts | Bins with >2000 counts | High rate bins dominated by noise | Noise dominated (total time) | Noise dominated (detector-on time) | Marked lightcurve |
|---|---|---|---|---|---|---|---|
| A | 7637 | 6498 | 3 | 3 | 0.04% | 0.05% | 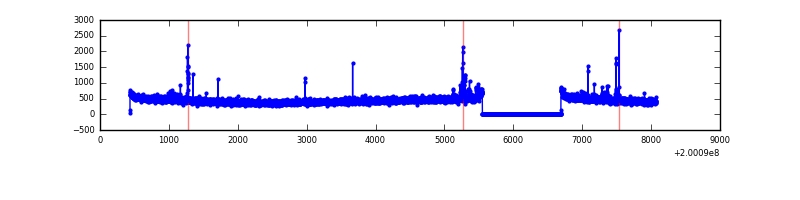 |
| B | 7637 | 6498 | 6 | 6 | 0.08% | 0.09% | 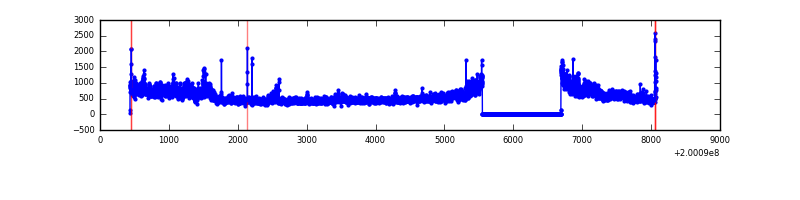 |
| C | 7637 | 6498 | 11 | 11 | 0.14% | 0.17% | 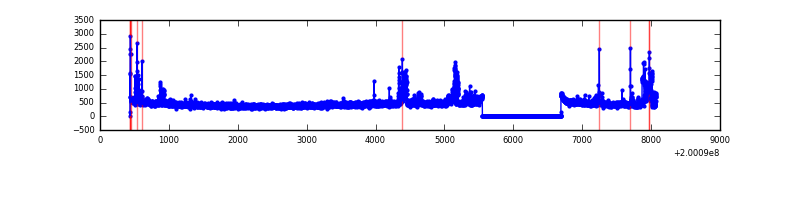 |
| D | 7637 | 6498 | 36 | 36 | 0.47% | 0.55% | 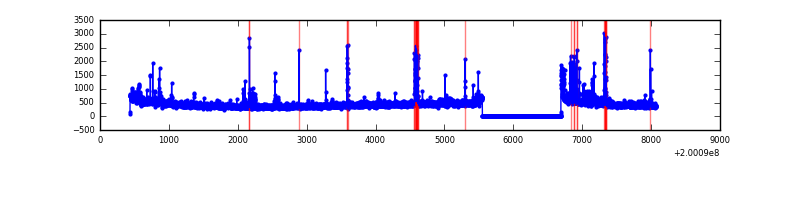 |
Top three noisy pixels from each quadrant. If the there are fewer than three noisy pixels in the level2.evt file, extra rows are filled as -1
| Pixel properties | Quadrant properties | ||||||
|---|---|---|---|---|---|---|---|
| Quadrant | DetID | PixID | Counts | Sigma | Mean | Median | Sigma |
| A | 0 | 118 | 49935 | 322.65 | 741 | 727 | 152.5 |
| A | 0 | 50 | 23038 | 146.29 | 741 | 727 | 152.5 |
| A | 0 | 226 | 12220 | 75.36 | 741 | 727 | 152.5 |
| B | 15 | 204 | 789532 | 5388.44 | 759 | 742 | 146.4 |
| B | 5 | 200 | 34254 | 228.93 | 759 | 742 | 146.4 |
| B | 0 | 229 | 21984 | 145.11 | 759 | 742 | 146.4 |
| C | 14 | 223 | 142965 | 845.38 | 720 | 725 | 168.3 |
| C | 12 | 175 | 127018 | 750.6 | 720 | 725 | 168.3 |
| C | 6 | 80 | 73978 | 435.37 | 720 | 725 | 168.3 |
| D | 13 | 114 | 189142 | 1095.5 | 708 | 690 | 172.0 |
| D | 13 | 223 | 67220 | 386.75 | 708 | 690 | 172.0 |
| D | 13 | 239 | 39282 | 224.34 | 708 | 690 | 172.0 |
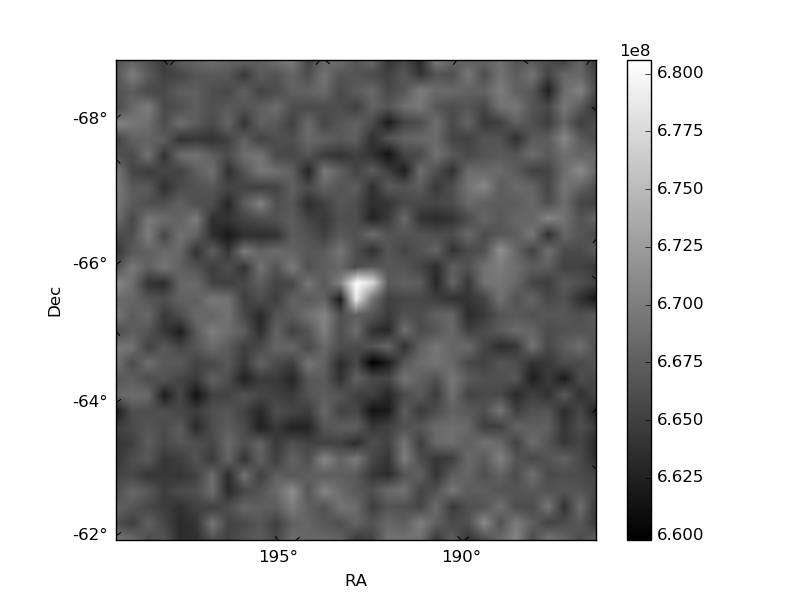
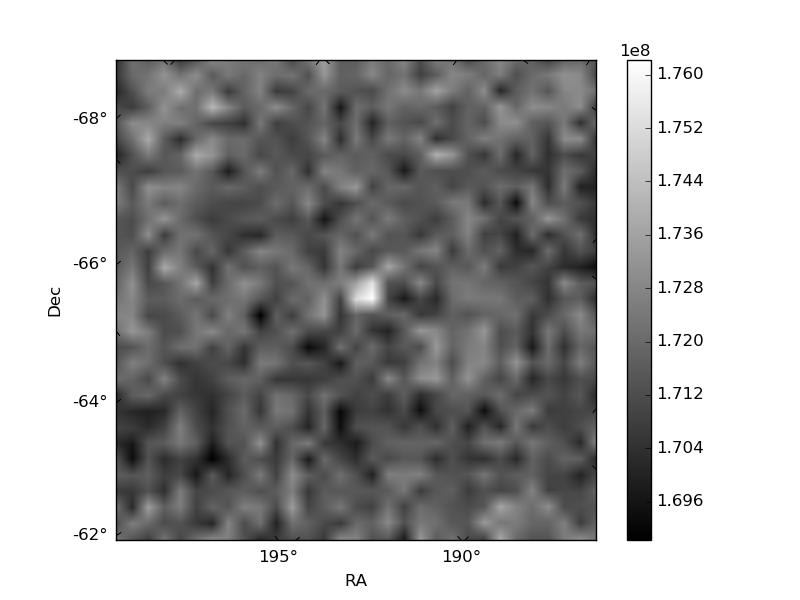
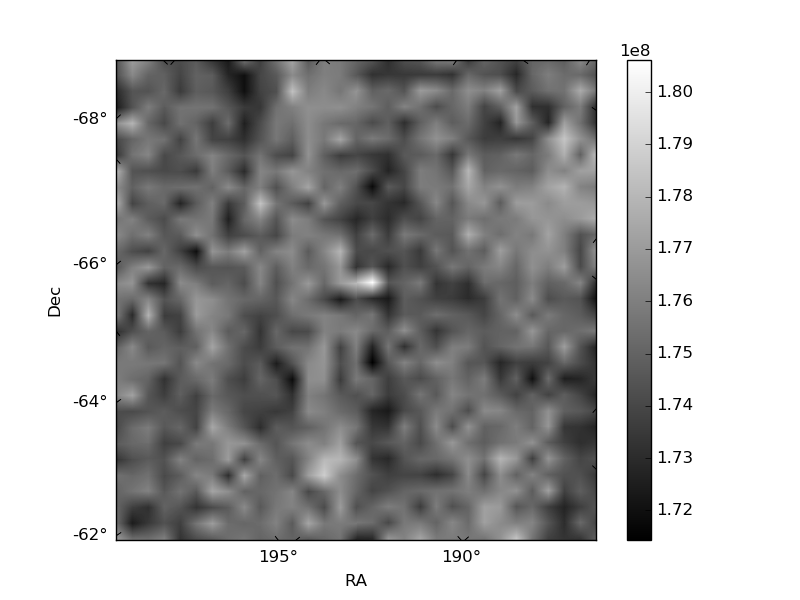
Histogram calculated using DETX and DETY for each event in the final _common_clean file
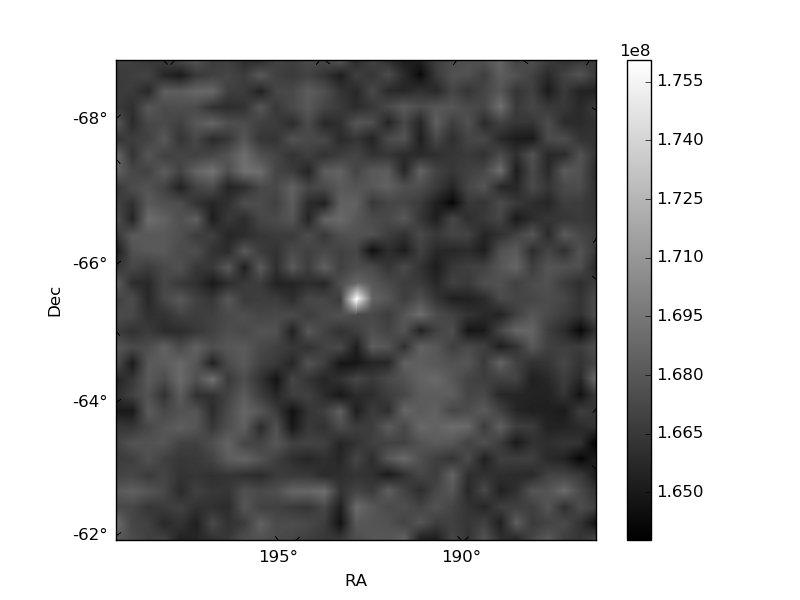
| Quadrant A | 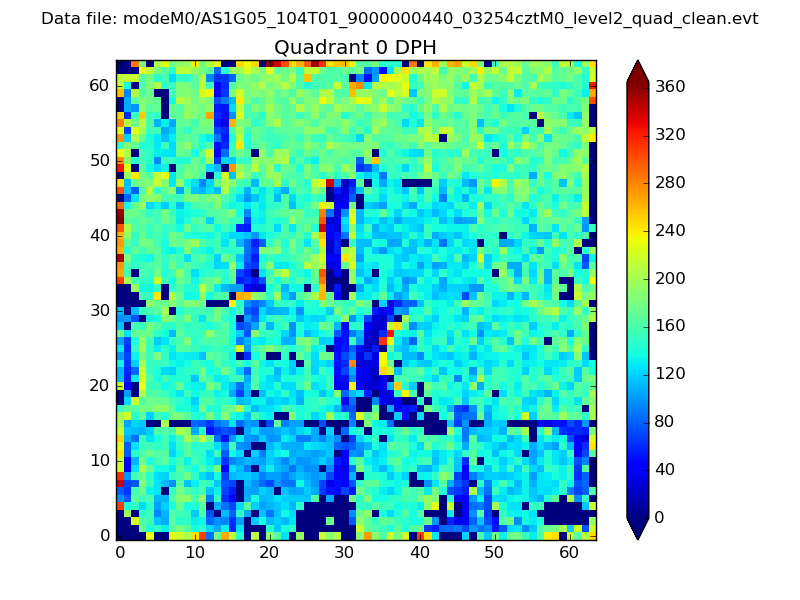 |
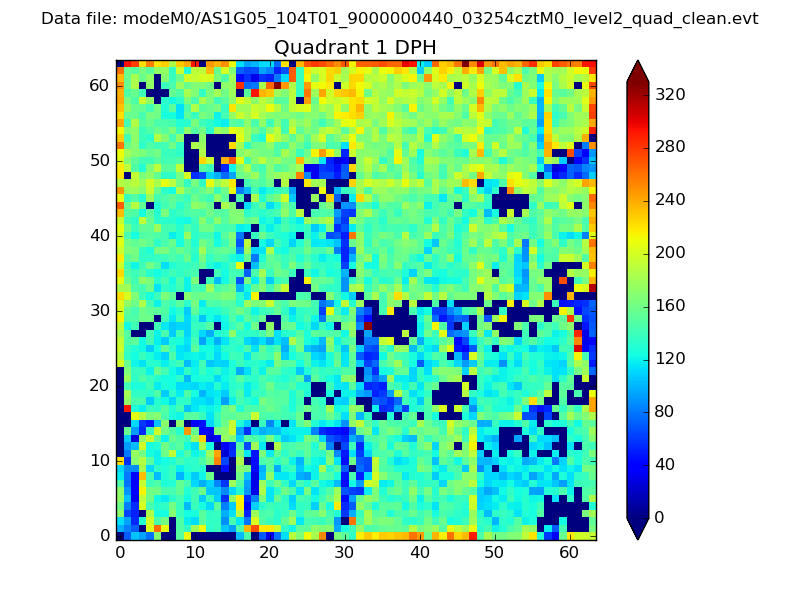 |
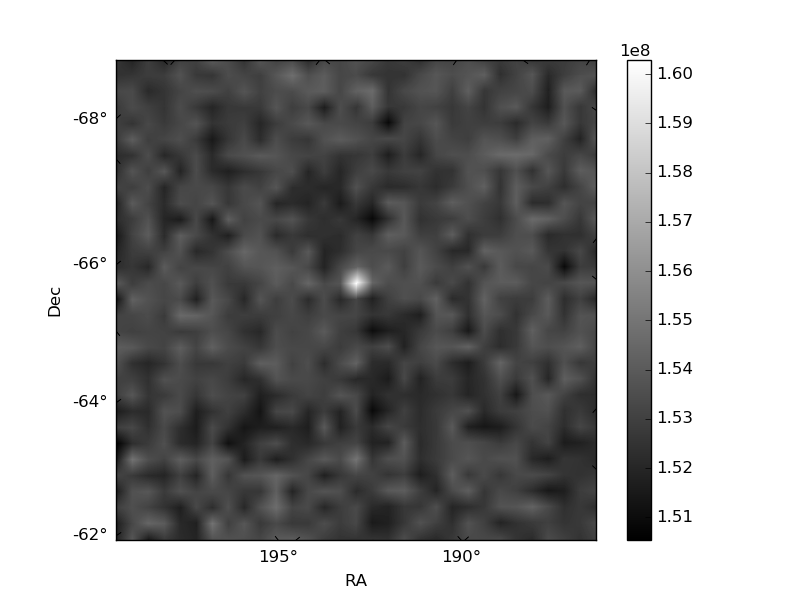
Quadrant B |
|---|---|---|---|
| Quadrant D | 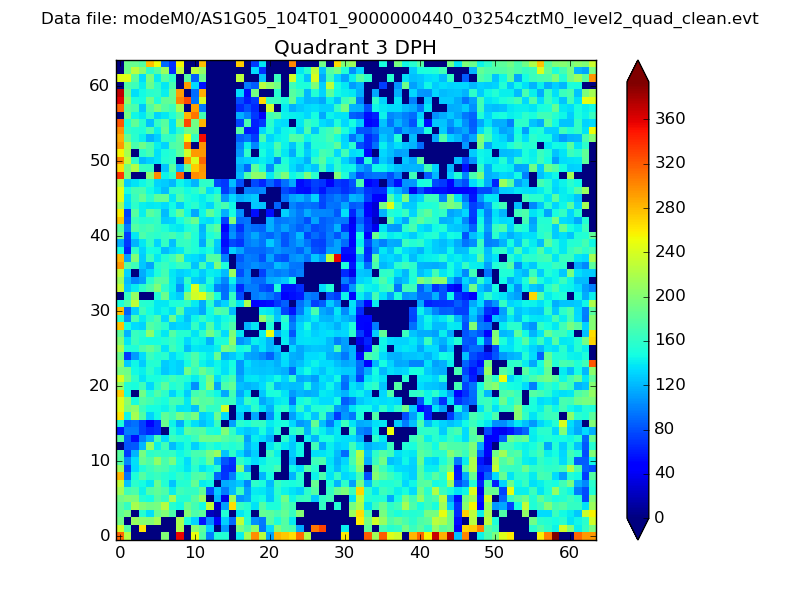 |
 |
Quadrant C |
| Plot type | Count rate plots | Images |
|---|---|---|
| Comparison with Poisson distribution Blue bars denote a histogram of data divided into 1 sec bins. Red curve is a Poisson curve with rate = median count rate of data. |
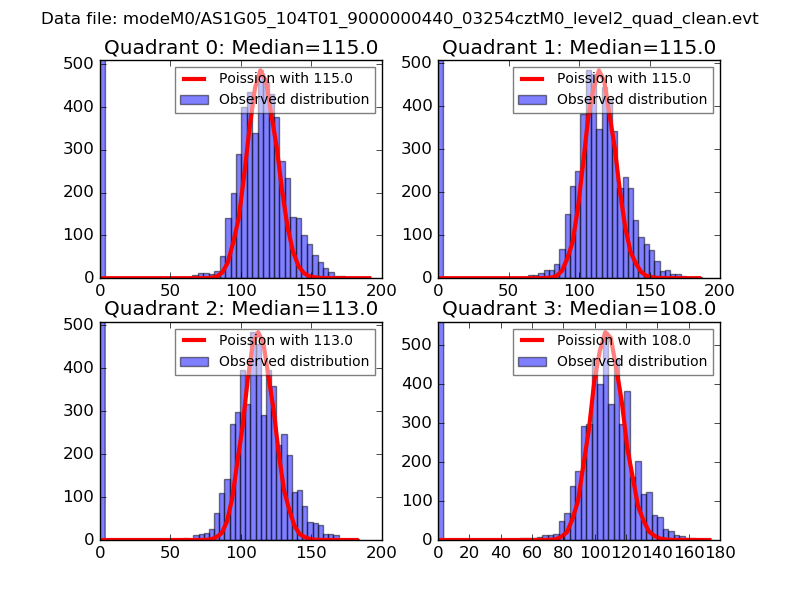 |
 |
| Quadrant-wise count rates Data is divided into 100 sec bins |
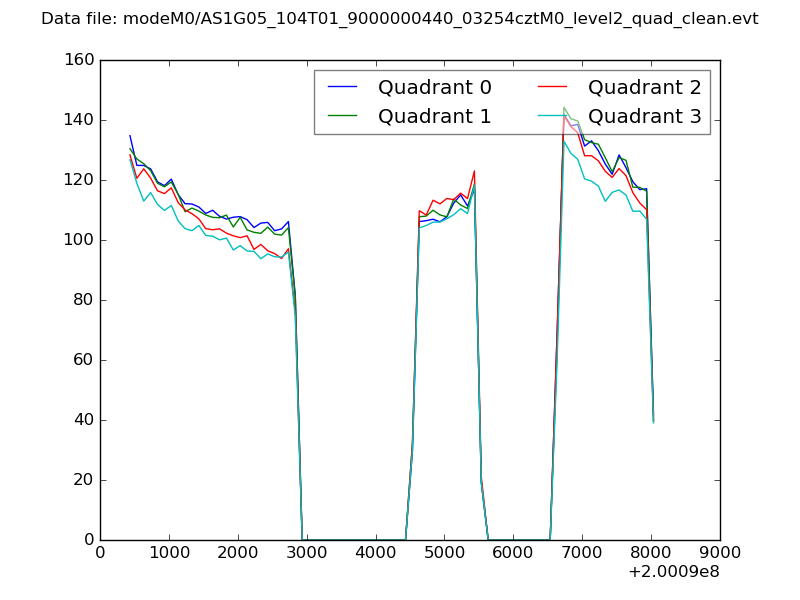 |
|
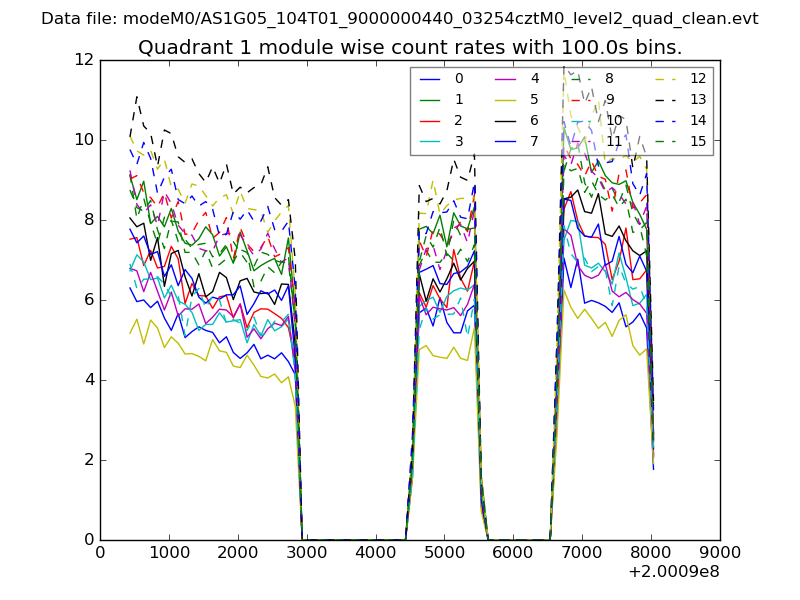
| Module-wise count rates for Quadrant A Data is divided into 100 sec bins |
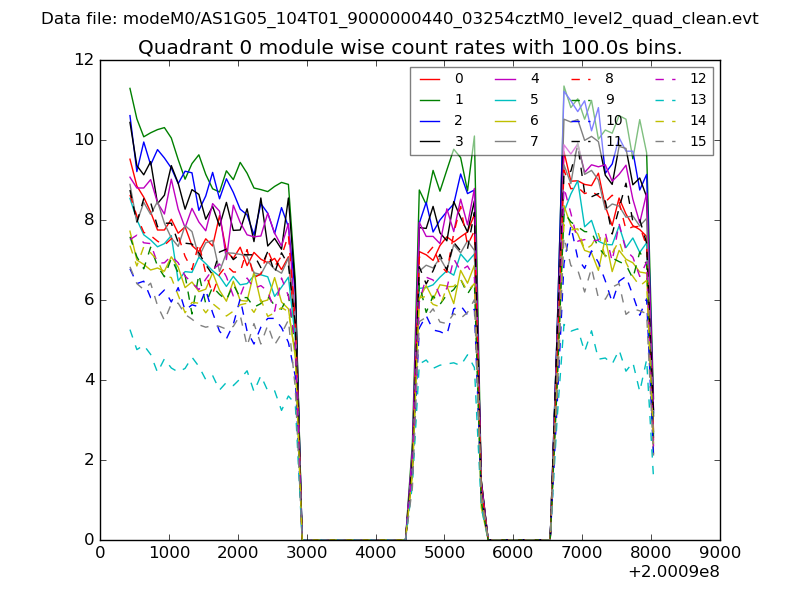 |
 |
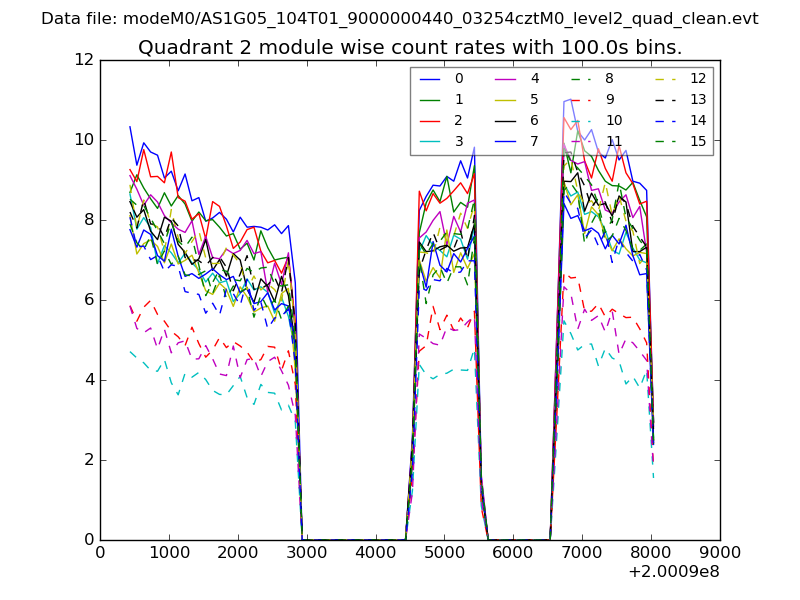
| Module-wise count rates for Quadrant B Data is divided into 100 sec bins |
 |
 |
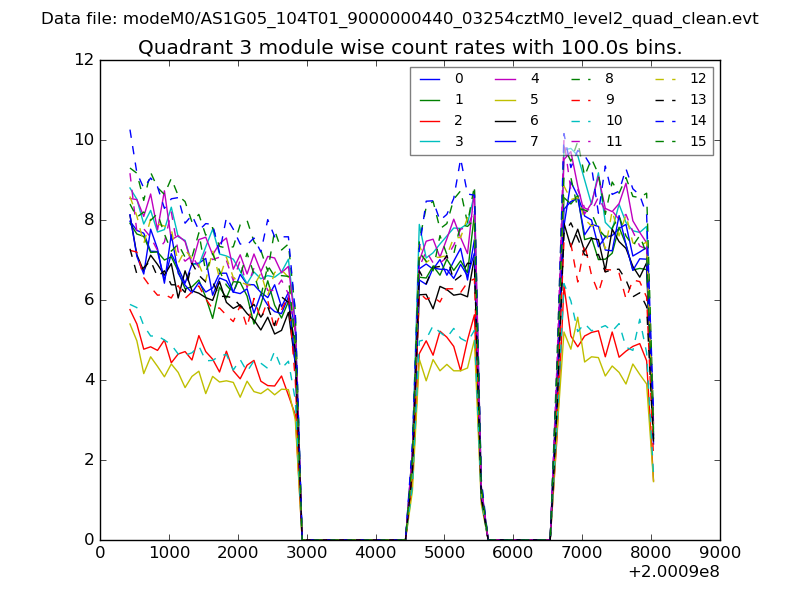
| Module-wise count rates for Quadrant C Data is divided into 100 sec bins |
 |
 |
| Module-wise count rates for Quadrant D Data is divided into 100 sec bins |
 |
 |
| Parameter | Plot |
|---|---|
| CZT HV Monitor | 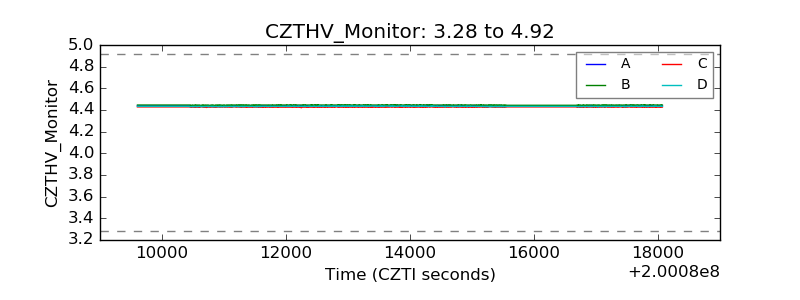 |
| D_VDD | 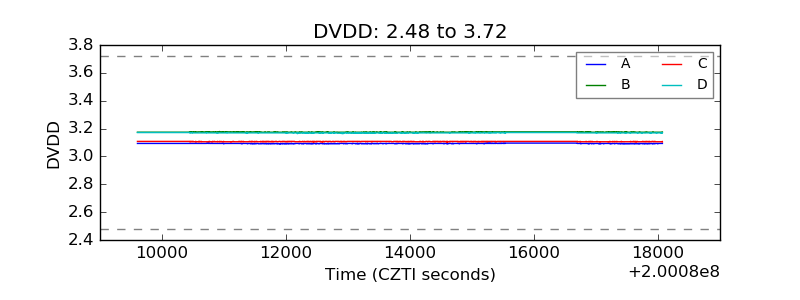 |
| Temperature 1 | 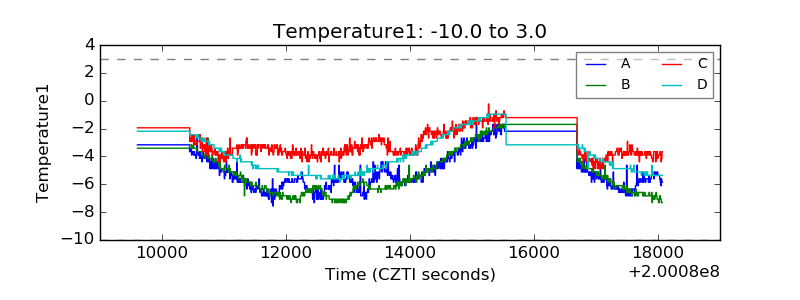 |
| Veto HV Monitor | 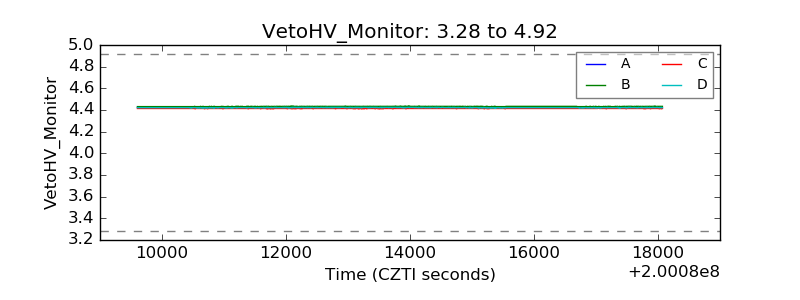 |
| Veto LLD |  |
| Alpha Counter | 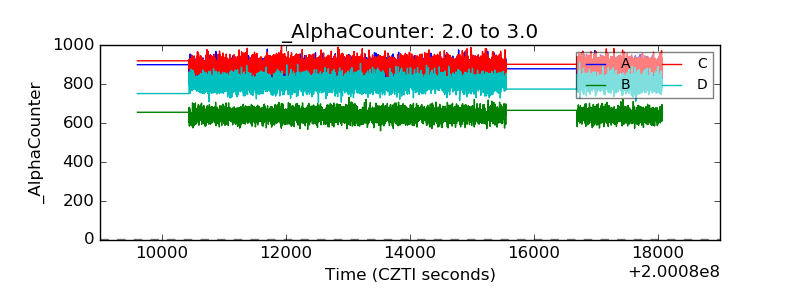 |
| _CPM_Rate | 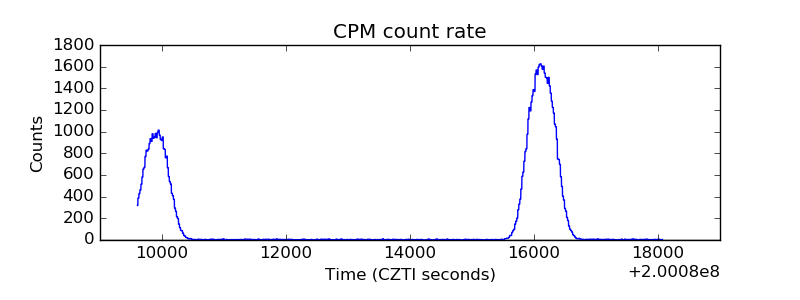 |
| CZT Counter | 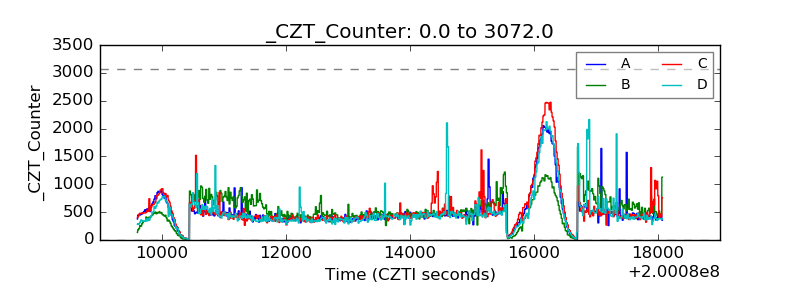 |
| +2.5 Volts monitor |  |
| +5 Volts monitor |  |
| _ROLL_ROT | 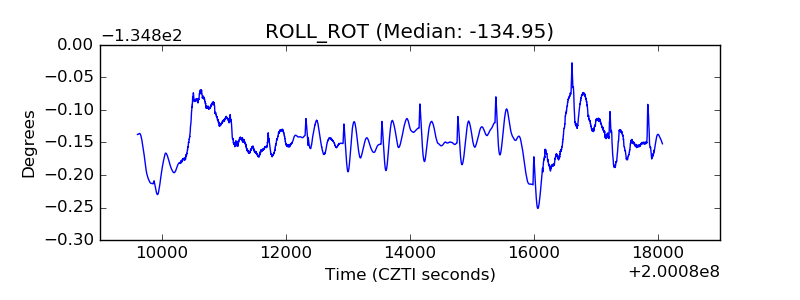 |
| _Roll_DEC | 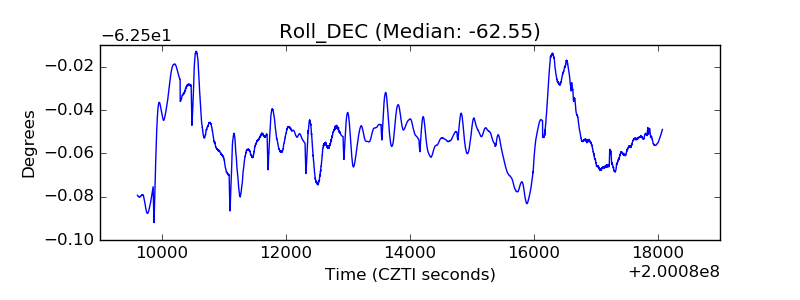 |
| _Roll_RA | 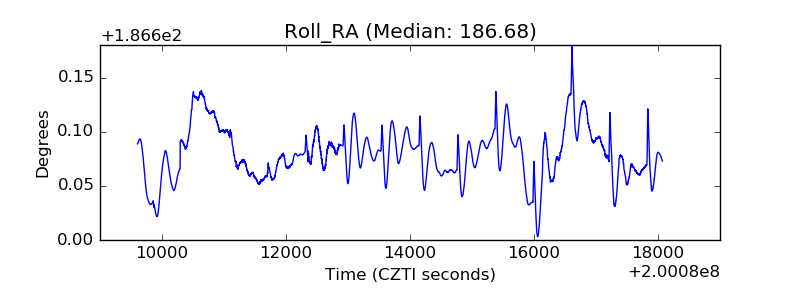 |
| Veto Counter | 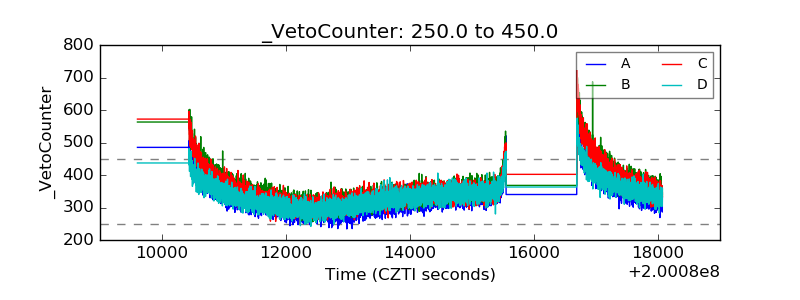 |