| Param | Original file | Final file |
|---|---|---|
| Filename | modeM0/AS1G05_221T01_9000000442cztM0_level2.fits | modeM0/AS1G05_221T01_9000000442cztM0_level2_quad_clean.evt |
| Size (bytes) | 625,968,000 | 704,174,400 |
| Size | 597.0 MB | 671.6 MB |
| Events in quadrant A | 3,712,664 | 4,330,117 |
| Events in quadrant B | 3,626,714 | 4,332,289 |
| Events in quadrant C | 3,617,126 | 4,001,281 |
| Events in quadrant D | 3,159,438 | 3,824,934 |
| Mode M9 | |||
|---|---|---|---|
| Quadrant | BADHDUFLAG | Total packets | Discarded packets |
| A | 0 | 104 | 0 |
| B | 0 | 104 | 0 |
| C | 0 | 104 | 0 |
| D | 0 | 104 | 0 |
| Mode SS | |||
|---|---|---|---|
| Quadrant | BADHDUFLAG | Total packets | Discarded packets |
| A | 0 | 1434 | 0 |
| B | 0 | 1434 | 0 |
| C | 0 | 1434 | 0 |
| D | 0 | 1434 | 0 |
| Mode M0 | |||
|---|---|---|---|
| Quadrant | BADHDUFLAG | Total packets | Discarded packets |
| A | 0 | 148489 | 0 |
| B | 0 | 167166 | 0 |
| C | 0 | 178097 | 0 |
| D | 0 | 160036 | 0 |
| Quadrant | Total seconds | Saturated seconds | Saturation percentage |
|---|---|---|---|
| A | 70572 | 1312 | 1.859094% |
| B | 70572 | 1495 | 2.118404% |
| C | 70572 | 3565 | 5.051579% |
| D | 70572 | 1774 | 2.513745% |
Noise dominated data is calculated using 1-second bins in cleaned event files. If a bin has >2000 counts, and if more than 50% of those come from <1% of pixels, then it is considered to be noise-dominated and hence unusable.
| Quadrant | # 1 sec bins | Bins with >0 counts | Bins with >2000 counts | High rate bins dominated by noise | Noise dominated (total time) | Noise dominated (detector-on time) | Marked lightcurve |
|---|---|---|---|---|---|---|---|
| A | 80781 | 70568 | 0 | 0 | 0.00% | 0.00% |  |
| B | 80782 | 70571 | 0 | 0 | 0.00% | 0.00% |  |
| C | 80781 | 70493 | 0 | 0 | 0.00% | 0.00% |  |
| D | 80782 | 70561 | 0 | 0 | 0.00% | 0.00% | 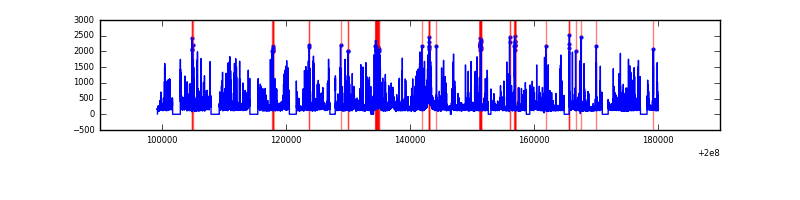 |
Top three noisy pixels from each quadrant. If the there are fewer than three noisy pixels in the level2.evt file, extra rows are filled as -1
| Pixel properties | Quadrant properties | ||||||
|---|---|---|---|---|---|---|---|
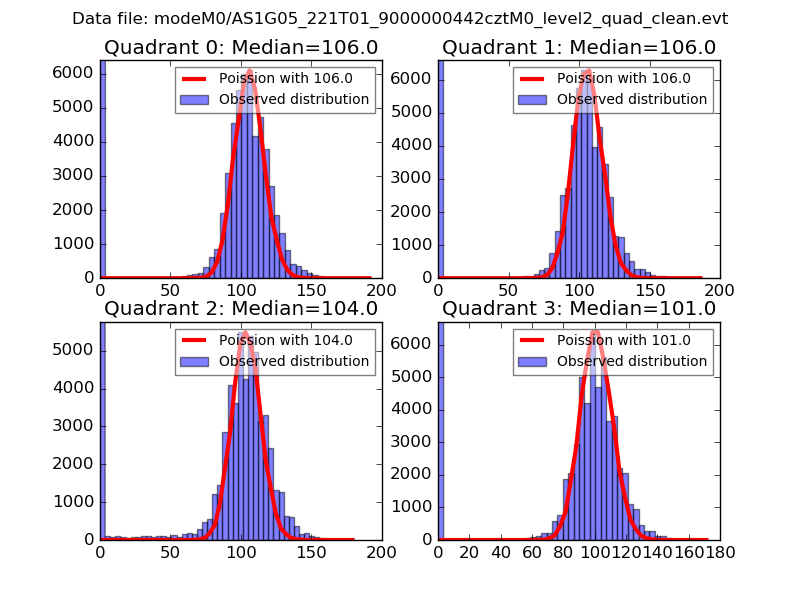
| Quadrant | DetID | PixID | Counts | Sigma | Mean | Median | Sigma |
| A | 14 | 188 | 3645 | 11.05 | 963 | 898 | 248.5 |
| A | 0 | 29 | 3589 | 10.83 | 963 | 898 | 248.5 |
| A | 7 | 110 | 3212 | 9.31 | 963 | 898 | 248.5 |
| B | 2 | 9 | 3188 | 11.88 | 955 | 908 | 191.8 |
| B | 12 | 226 | 2754 | 9.62 | 955 | 908 | 191.8 |
| B | 14 | 254 | 2498 | 8.29 | 955 | 908 | 191.8 |
| C | 1 | 80 | 2631 | 6.93 | 954 | 881 | 252.7 |
| C | 1 | 81 | 2602 | 6.81 | 954 | 881 | 252.7 |
| C | 7 | 111 | 2590 | 6.76 | 954 | 881 | 252.7 |
| D | 11 | 82 | 2811 | 8.17 | 902 | 817 | 244.2 |
| D | 6 | 83 | 2410 | 6.52 | 902 | 817 | 244.2 |
| D | 6 | 231 | 2346 | 6.26 | 902 | 817 | 244.2 |
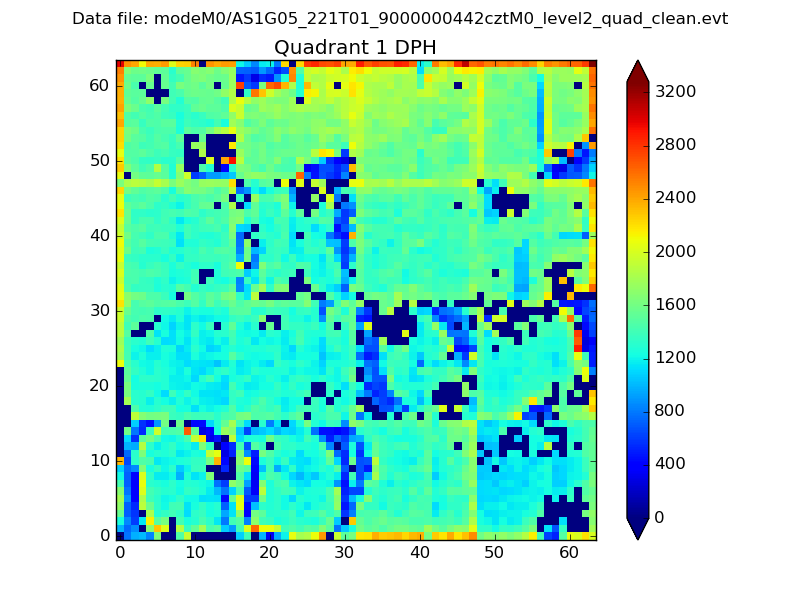
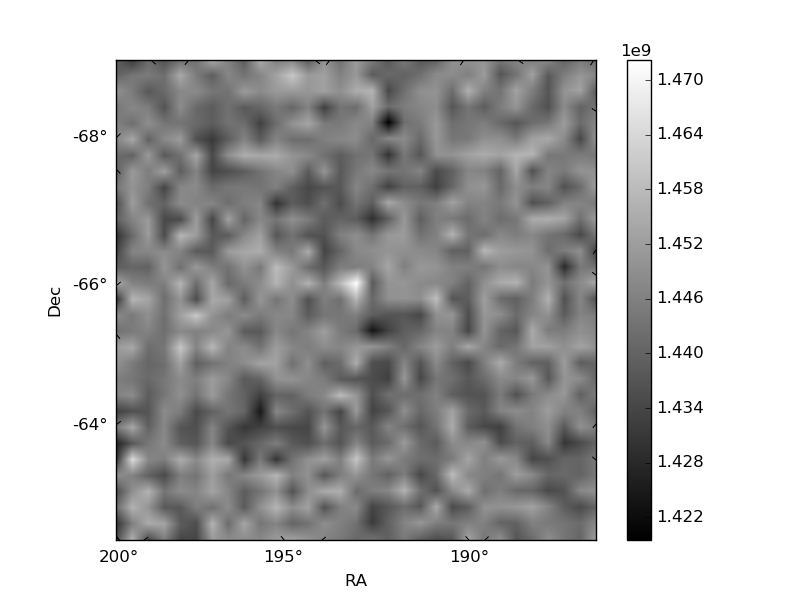
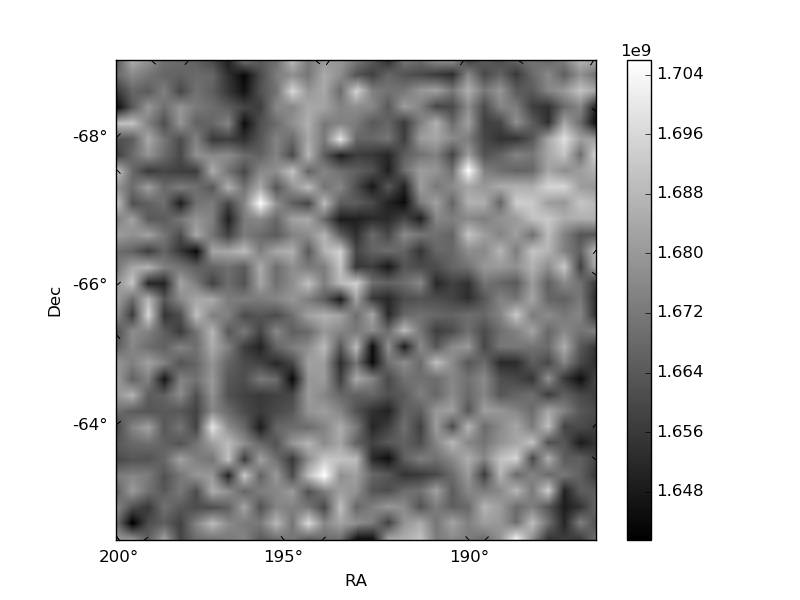
Histogram calculated using DETX and DETY for each event in the final _common_clean file
| Quadrant A |  |
 |
Quadrant B |
|---|---|---|---|
| Quadrant D |  |
 |
Quadrant C |
| Plot type | Count rate plots | Images |
|---|---|---|
| Comparison with Poisson distribution Blue bars denote a histogram of data divided into 1 sec bins. Red curve is a Poisson curve with rate = median count rate of data. |
 |
 |
| Quadrant-wise count rates Data is divided into 100 sec bins |
 |
|
| Module-wise count rates for Quadrant A Data is divided into 100 sec bins |
 |
 |
| Module-wise count rates for Quadrant B Data is divided into 100 sec bins |
 |
 |
| Module-wise count rates for Quadrant C Data is divided into 100 sec bins |
 |
 |
| Module-wise count rates for Quadrant D Data is divided into 100 sec bins |
 |
 |
| Parameter | Plot |
|---|---|
| CZT HV Monitor | 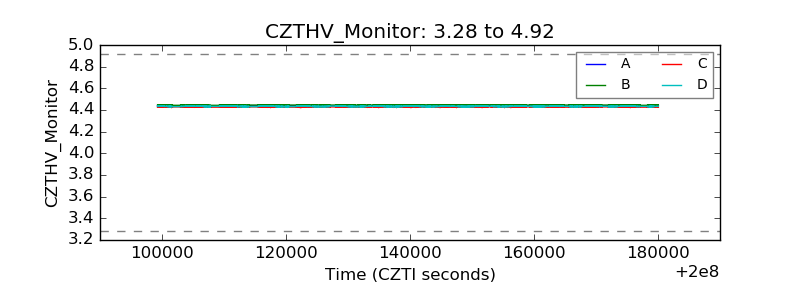 |
| D_VDD | 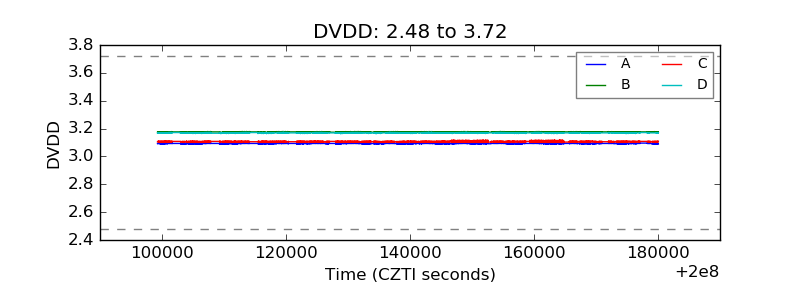 |
| Temperature 1 |  |
| Veto HV Monitor |  |
| Veto LLD |  |
| Alpha Counter |  |
| _CPM_Rate |  |
| CZT Counter |  |
| +2.5 Volts monitor |  |
| +5 Volts monitor |  |
| _ROLL_ROT |  |
| _Roll_DEC |  |
| _Roll_RA | 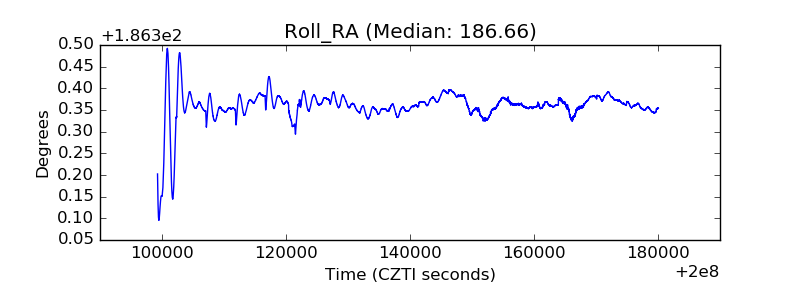 |
| Veto Counter |  |