| Param | Original file | Final file |
|---|---|---|
| Filename | modeM0/AS1G05_221T01_9000000442_03255cztM0_level2.evt | modeM0/AS1G05_221T01_9000000442_03255cztM0_level2_quad_clean.evt |
| Size (bytes) | 282,450,240 | 53,493,120 |
| Size | 269.4 MB | 51.0 MB |
| Events in quadrant A | 1,870,491 | 336,322 |
| Events in quadrant B | 2,533,771 | 338,721 |
| Events in quadrant C | 1,895,610 | 339,565 |
| Events in quadrant D | 1,979,948 | 321,644 |
| Mode M9 | |||
|---|---|---|---|
| Quadrant | BADHDUFLAG | Total packets | Discarded packets |
| A | 0 | 13 | 0 |
| B | 0 | 13 | 0 |
| C | 0 | 13 | 0 |
| D | 0 | 13 | 0 |
| Mode SS | |||
|---|---|---|---|
| Quadrant | BADHDUFLAG | Total packets | Discarded packets |
| A | 0 | 82 | 0 |
| B | 0 | 82 | 0 |
| C | 0 | 82 | 0 |
| D | 0 | 82 | 0 |
| Mode M0 | |||
|---|---|---|---|
| Quadrant | BADHDUFLAG | Total packets | Discarded packets |
| A | 0 | 8249 | 2 |
| B | 0 | 10155 | 1 |
| C | 0 | 8290 | 1 |
| D | 0 | 8684 | 1 |
| Quadrant | Total seconds | Saturated seconds | Saturation percentage |
|---|---|---|---|
| A | 4017 | 7 | 0.174259% |
| B | 4017 | 72 | 1.792382% |
| C | 4017 | 8 | 0.199154% |
| D | 4017 | 34 | 0.846403% |
Noise dominated data is calculated using 1-second bins in cleaned event files. If a bin has >2000 counts, and if more than 50% of those come from <1% of pixels, then it is considered to be noise-dominated and hence unusable.
| Quadrant | # 1 sec bins | Bins with >0 counts | Bins with >2000 counts | High rate bins dominated by noise | Noise dominated (total time) | Noise dominated (detector-on time) | Marked lightcurve |
|---|---|---|---|---|---|---|---|
| A | 5272 | 4018 | 0 | 0 | 0.00% | 0.00% |  |
| B | 5272 | 4018 | 24 | 24 | 0.46% | 0.60% | 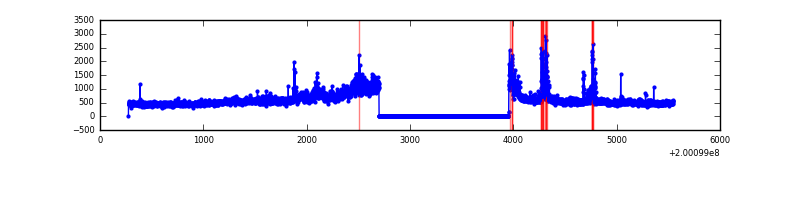 |
| C | 5272 | 4018 | 1 | 1 | 0.02% | 0.02% | 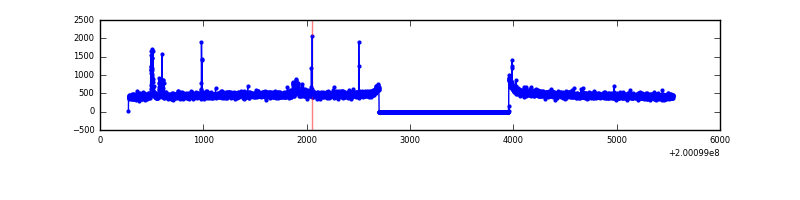 |
| D | 5272 | 4018 | 20 | 20 | 0.38% | 0.50% |  |
Top three noisy pixels from each quadrant. If the there are fewer than three noisy pixels in the level2.evt file, extra rows are filled as -1
| Pixel properties | Quadrant properties | ||||||
|---|---|---|---|---|---|---|---|
| Quadrant | DetID | PixID | Counts | Sigma | Mean | Median | Sigma |
| A | 0 | 118 | 32813 | 330.29 | 475 | 465 | 97.9 |
| A | 0 | 226 | 7853 | 75.43 | 475 | 465 | 97.9 |
| A | 12 | 194 | 4995 | 46.25 | 475 | 465 | 97.9 |
| B | 15 | 204 | 484929 | 5163.59 | 486 | 475 | 93.8 |
| B | 2 | 249 | 145662 | 1547.49 | 486 | 475 | 93.8 |
| B | 5 | 200 | 8419 | 84.67 | 486 | 475 | 93.8 |
| C | 12 | 175 | 40651 | 364.57 | 467 | 471 | 110.2 |
| C | 6 | 80 | 13698 | 120.02 | 467 | 471 | 110.2 |
| C | 1 | 16 | 5350 | 44.27 | 467 | 471 | 110.2 |
| D | 13 | 223 | 95817 | 850.43 | 460 | 446 | 112.1 |
| D | 13 | 114 | 72424 | 641.83 | 460 | 446 | 112.1 |
| D | 13 | 239 | 15909 | 137.89 | 460 | 446 | 112.1 |
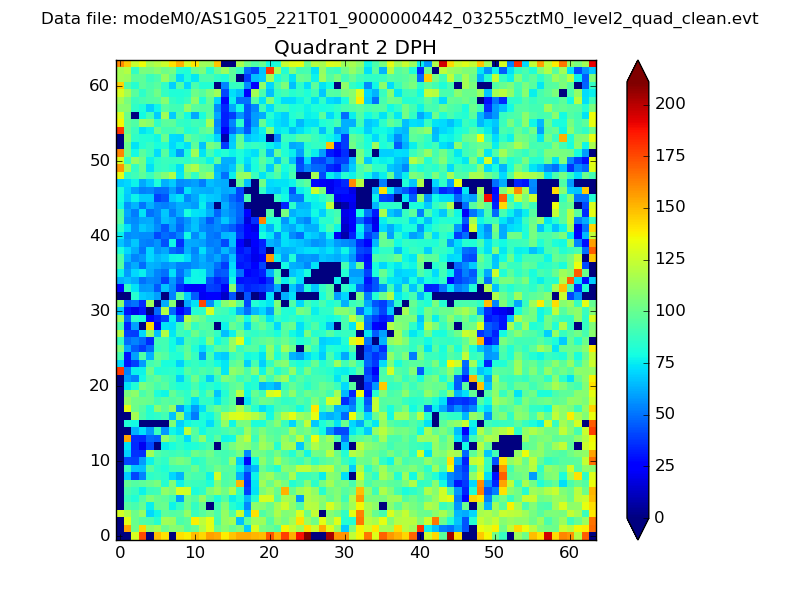
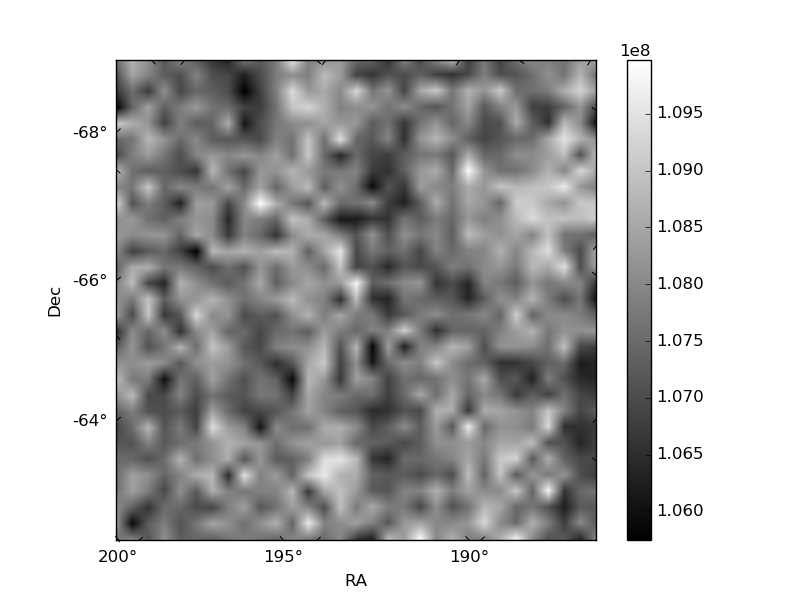
Histogram calculated using DETX and DETY for each event in the final _common_clean file
| Quadrant A | 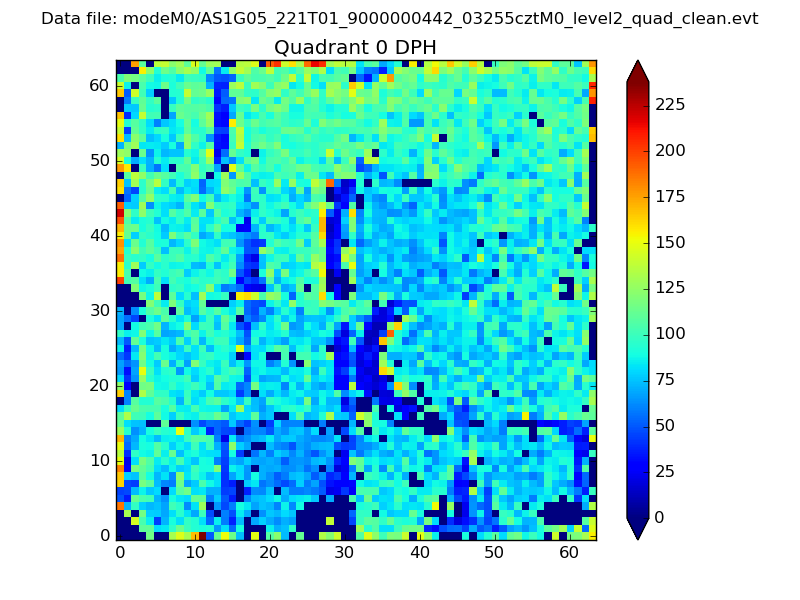 |
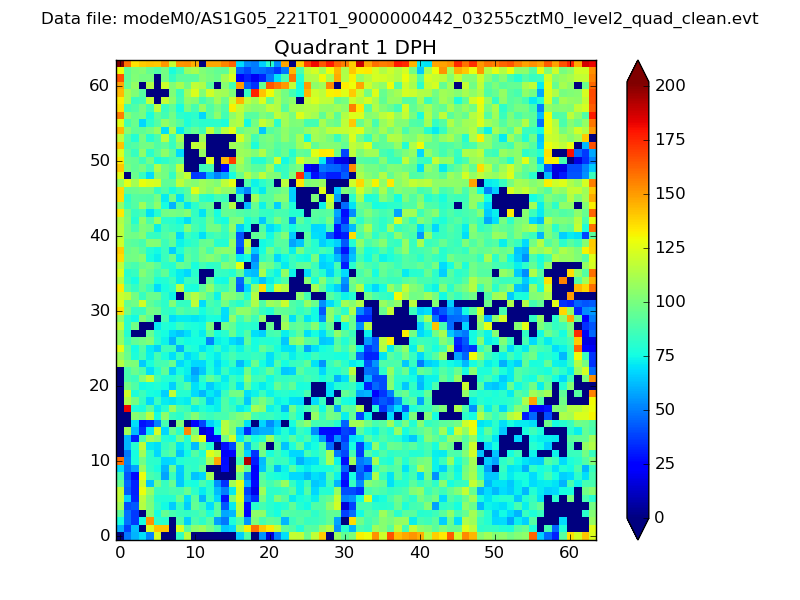 |
Quadrant B |
|---|---|---|---|
| Quadrant D | 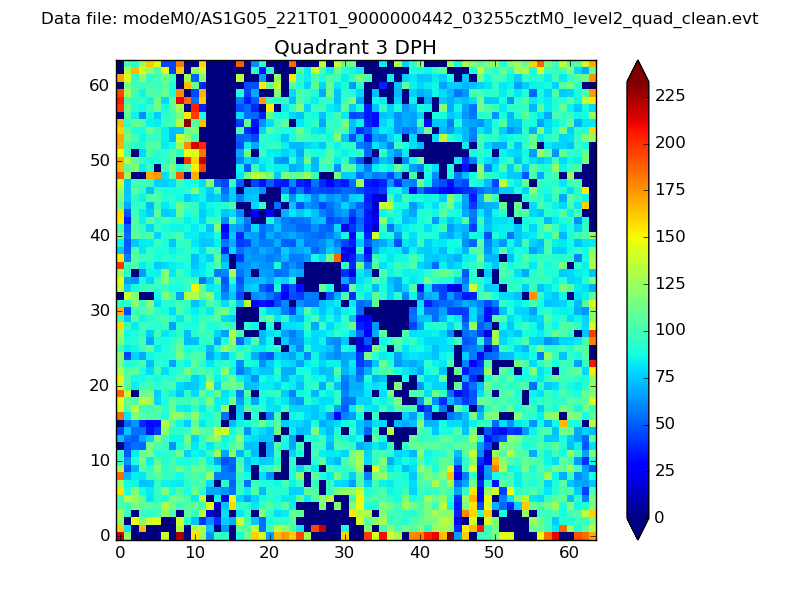 |
 |
Quadrant C |
| Plot type | Count rate plots | Images |
|---|---|---|
| Comparison with Poisson distribution Blue bars denote a histogram of data divided into 1 sec bins. Red curve is a Poisson curve with rate = median count rate of data. |
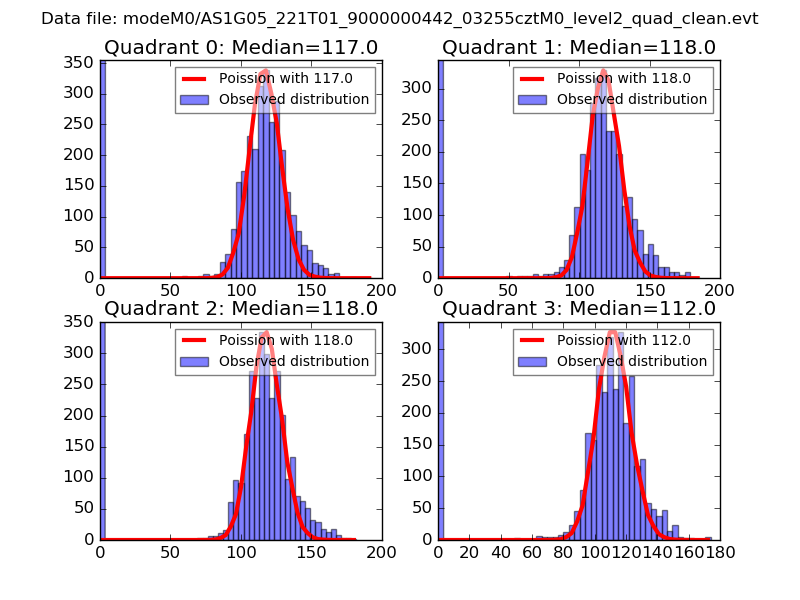 |
 |
| Quadrant-wise count rates Data is divided into 100 sec bins |
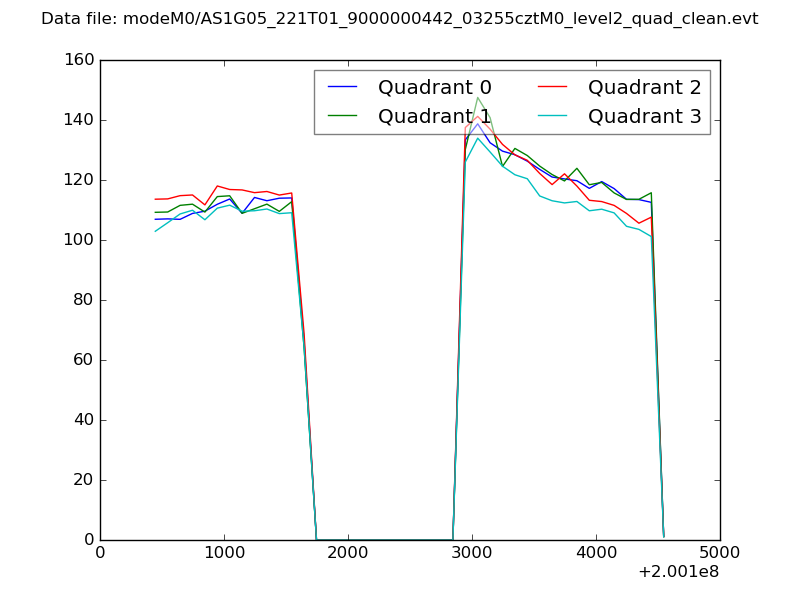 |
|
| Module-wise count rates for Quadrant A Data is divided into 100 sec bins |
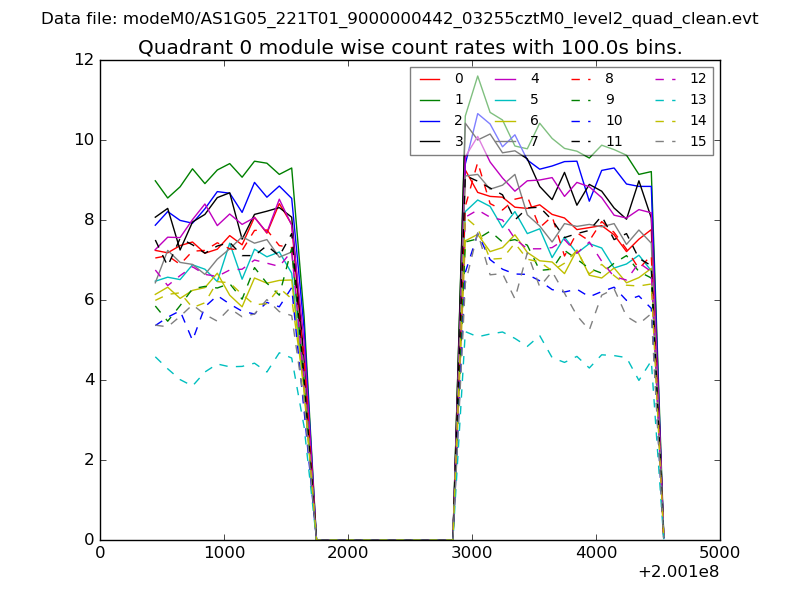 |
 |
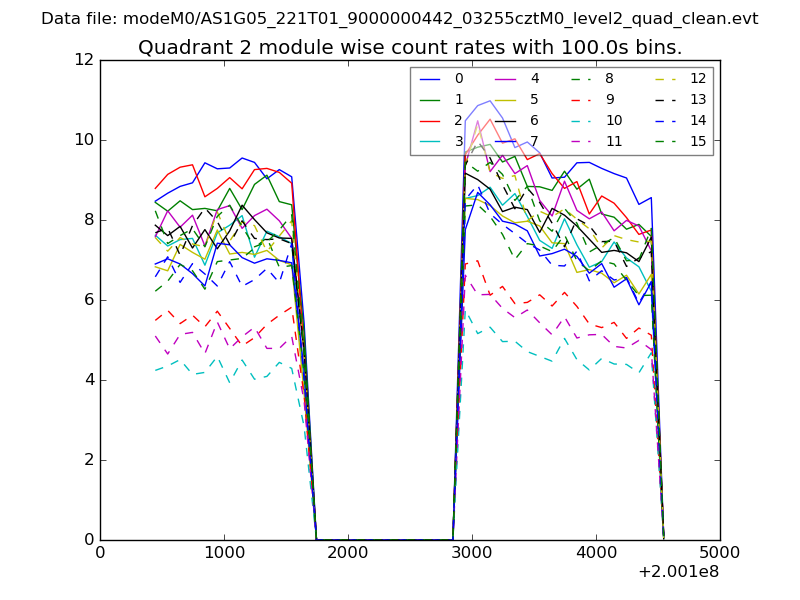
| Module-wise count rates for Quadrant B Data is divided into 100 sec bins |
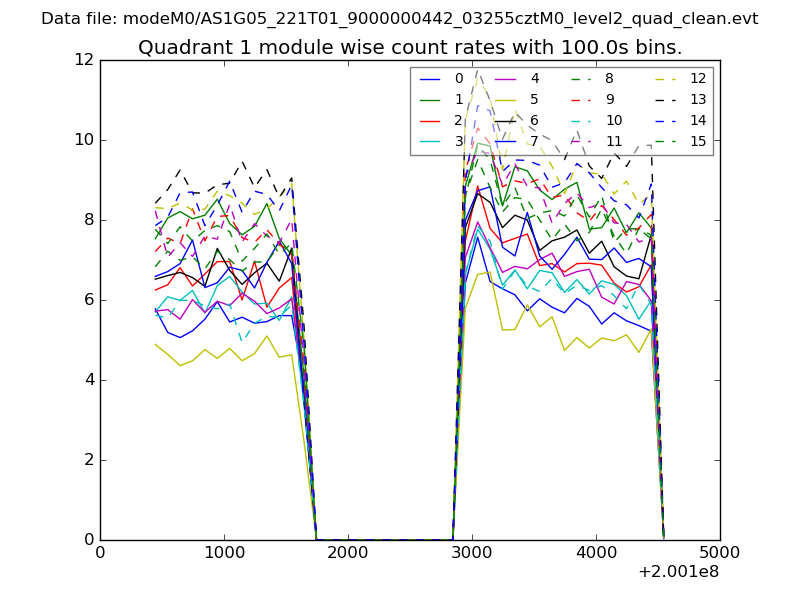 |
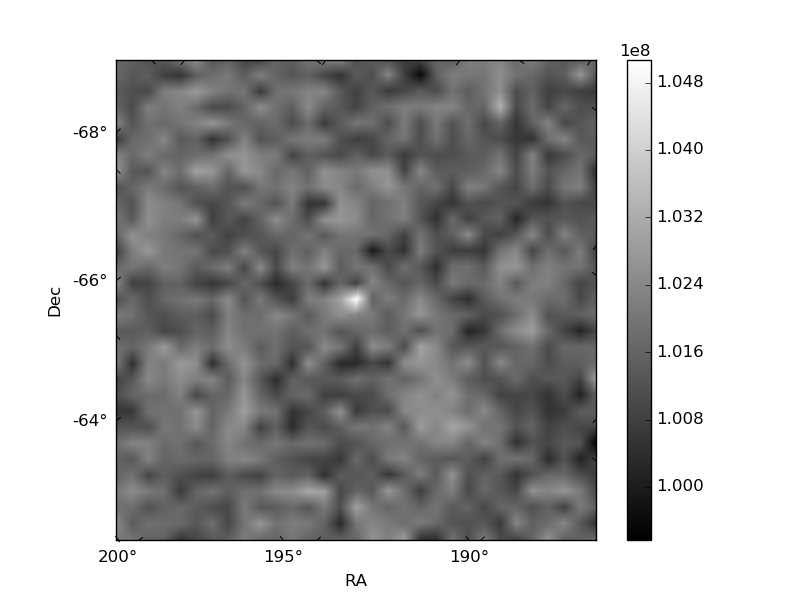 |
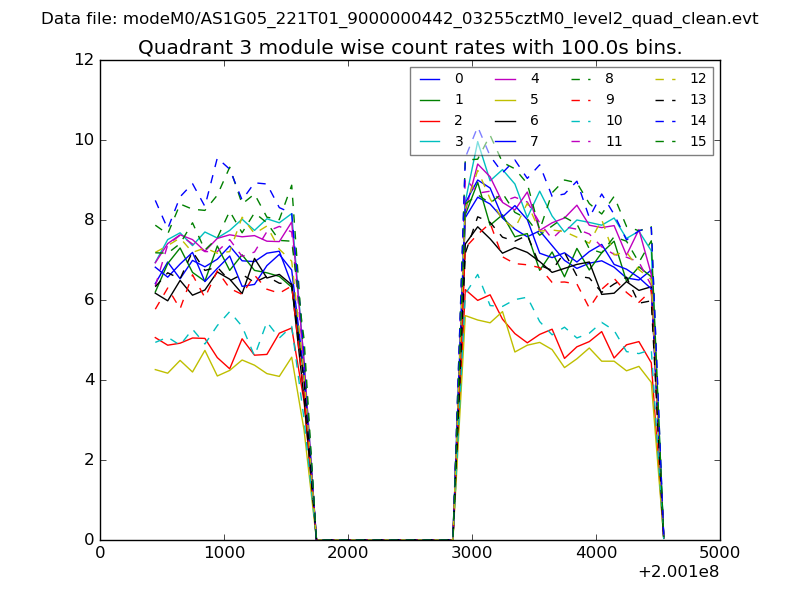
| Module-wise count rates for Quadrant C Data is divided into 100 sec bins |
 |
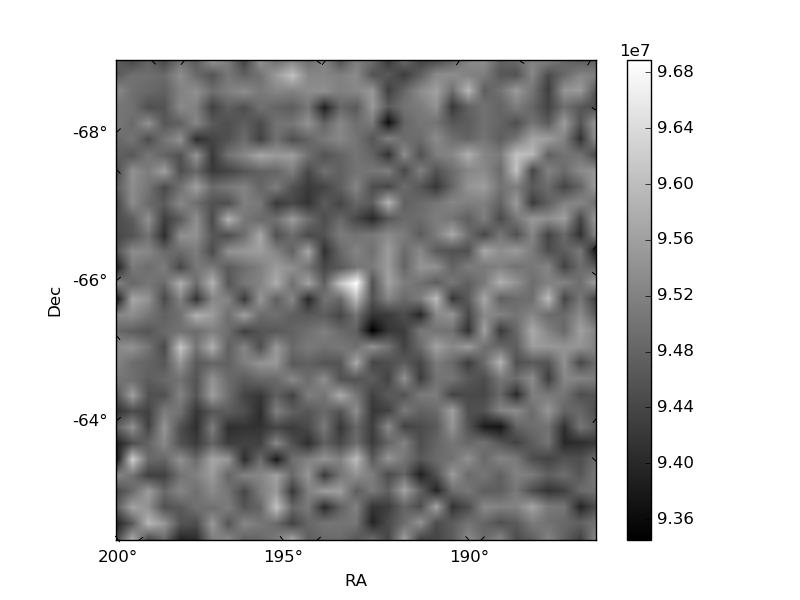 |
| Module-wise count rates for Quadrant D Data is divided into 100 sec bins |
 |
 |
| Parameter | Plot |
|---|---|
| CZT HV Monitor | 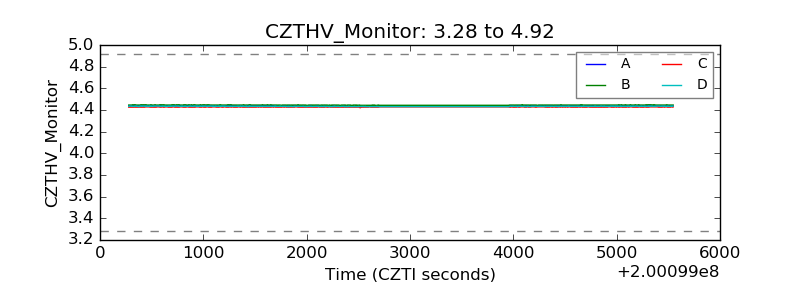 |
| D_VDD | 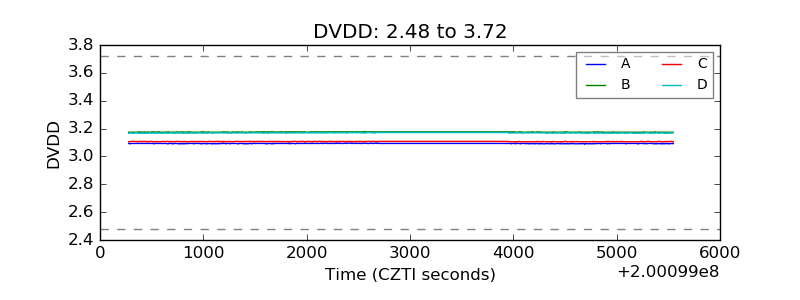 |
| Temperature 1 | 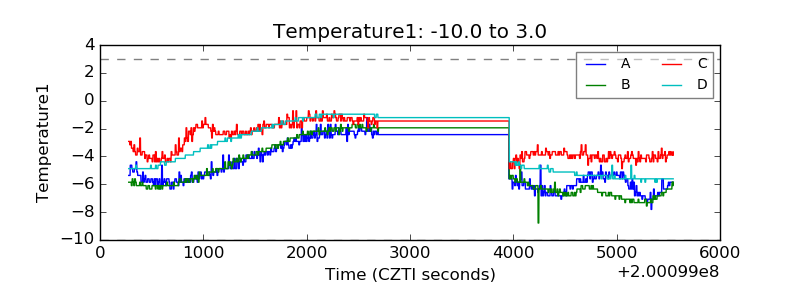 |
| Veto HV Monitor | 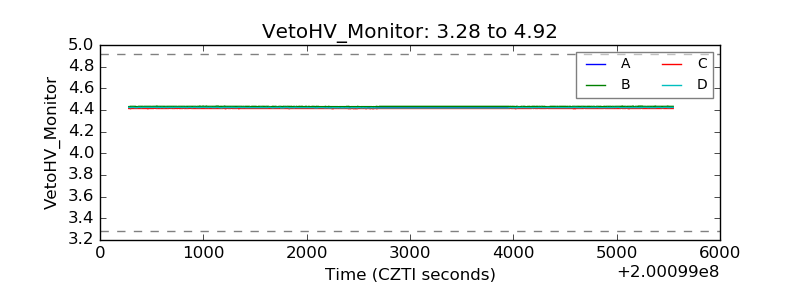 |
| Veto LLD |  |
| Alpha Counter | 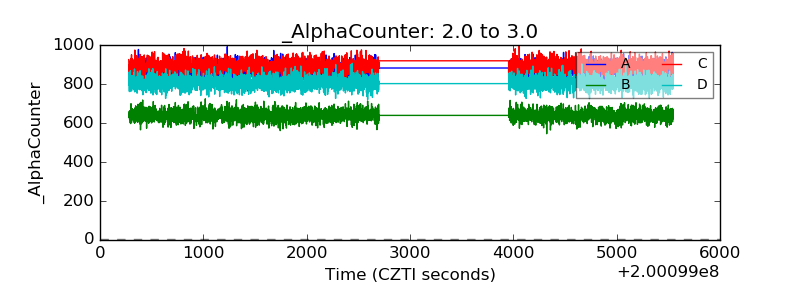 |
| _CPM_Rate | 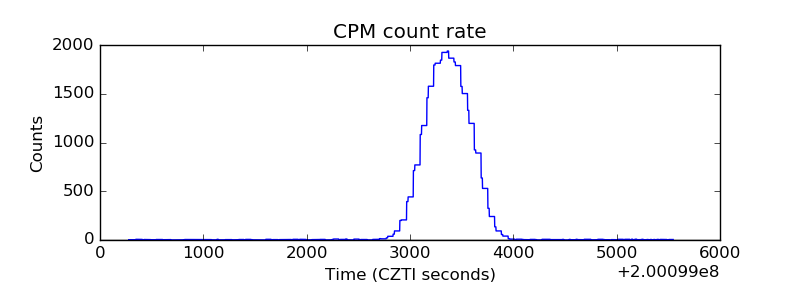 |
| CZT Counter | 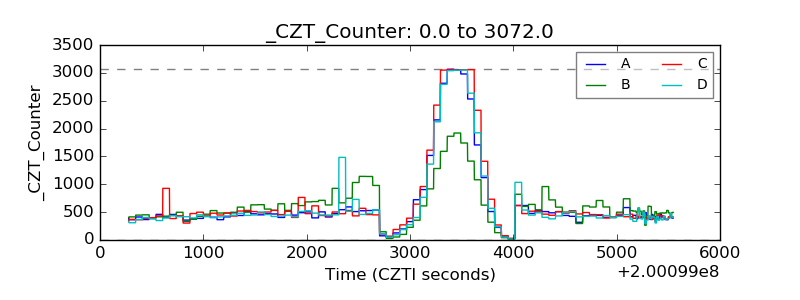 |
| +2.5 Volts monitor |  |
| +5 Volts monitor |  |
| Veto Counter | 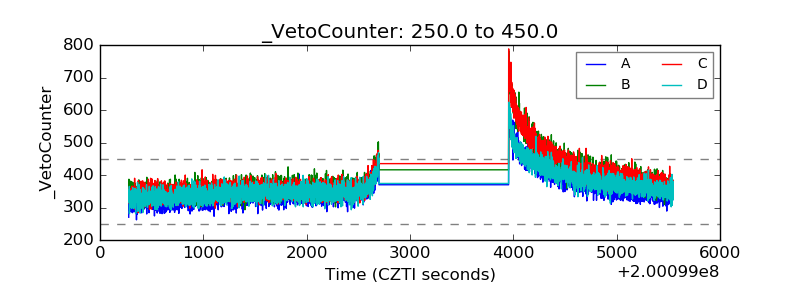 |